I. INTRODUCTION
Since the first report of bismuth germanium oxide (Bi4Ge3O12 or BGO) as a scintillator in 1973, this material has slowly started to replace the ubiquitous thallium-doped sodium iodide (NaI:Tl) in many of its applications. Reference Yen, Shionoya and Yamamoto1,Reference Dieguez, Arizmendi and Cabrera2 Some of the properties that have led to this substitution include the good stopping power of the high Z numbered Bi, high density (7.112 g/cm3), robust nature (hardness 5 Mho), air-stability (nonhygroscopic), radiation hardness (stable to 5.1 × 10⁴ Gy), small afterglow (0.005% after 3 ms), rapid rise/decay time (high scintillation efficiency), good energy resolution (at 5–20 MeV), low self-absorption, photofraction, and a four times larger absorption coefficient. Reference Yen, Shionoya and Yamamoto1–Reference Santana, de Mello, Valerio and Macedo5 Even though scintillator BGO materials have only 20% of the light emission of NaI(Tl), the maximum emission occurs at 480 nm and covers a wide range of wave lengths (375–650 nm) with a significant portion of the emission above 500 nm. While this may not be favorable for scintillation collection by photomultiplier tubes, this broad emission can be effectively collected by the new avalanche photodiode arrays. 3 Furthermore, BGO single crystals produce ∼8500 photons per 1 MeV of energy radiation that it absorbs. Reference Yen, Shionoya and Yamamoto1,Reference Dieguez, Arizmendi and Cabrera2,Reference van Eijk4 Altogether, these properties make BGO of interest for scintillator applications that require detection of low amounts of γ radiation.
While there are numerous phase diagrams reported for BGO, Reference Zyryanov, Smirnov and Ivanovskaya6 four main phases are reported: (i) sillenite (Bi12GeO20), aurivillius (Bi2GeO5), eulytite (Bi4Ge3O12), and benitoite (Bi2Ge3O9). Of these, the eulytite (E-BGO) phase is desired for scintillator applications based on its inherent properties (vide infra). Since E-BGO has a cubic structure and is optically isotropic, Reference Yen, Shionoya and Yamamoto1 polycrystalline ceramic components will not demonstrate light scattering at the grain boundaries. Thus, the production of E-BGO polycrystalline materials offers an intriguing alternative to the laborious single crystal E-BGO components. In addition, a higher surface area is expected for the smaller polycrystalline particles that may significantly reduce the sintering temperature and promote the densification process. These properties would assist in minimizing the formation of oxygen vacancies Reference Shimanskii and Vasil'eva7 that can degrade the optical quality of the E-BGO components. Reference Kisteneva, Akrestina, Shandarov, Mandel, Grebenchukov, Pozdeeva and Kargin8 The synthesis of phase-pure E-BGO powders may also replace the nonstoichiometric BGO starting powders, Reference Novoselov, Makarov, Fedotov, Ivannikova and Shubin9 thereby leading to higher quality, single crystal optical components, and facilitating the fabrication of low cost, high volume E-BGO ceramic scintillators, and/or large size γ-ray detectors.
Due to this interest in polycrystalline E-BGO scintillators, Reference Yen, Shionoya and Yamamoto1–3 a study to define its properties under a variety of radiation-induced environments was proposed. To realize this effort, a rapid, reliable, and large scale synthesis route to phase-pure E-BGO was necessary. Several methods have been reported for the production of E-BGO. Typically, these methods follow the established Czochralski process to grow large single crystals of E-BGO in cube or cylindrical forms. Reference Yen, Shionoya and Yamamoto1,Reference Dieguez, Arizmendi and Cabrera2 Otherwise, synthetic routes to E-BGO are limited to melts, Reference Novoselov, Makarov, Fedotov, Ivannikova and Shubin9–Reference Borowiec, Majchrowski, Zmija, Szymczak, Zayarniuk, Michalski and Baranski11 mechanochemical, Reference Santana, de Mello, Valerio and Macedo5,Reference Zyryanov, Smirnov and Ivanovskaya6,Reference Macedo and Hernandes12 solution routes Reference Tseng13,Reference Kozhbakhteeva and Leonyuk14 and one report of a solid-state synthesis of the metal oxides that successfully generated nano-BGO:Eu. Reference Polosan, Matei and Logofatu15 The two solution routes reported were of interest since they are convenient methods for producing large scale powders and have reportedly demonstrated control over the phase and morphology of the E-BGO based on the choice of surfactants and solution pH. However, both routes use nitric acid (HNO3) to minimize bismuth reduction following solvothermal (SOLVO) Reference Kozhbakhteeva and Leonyuk14 and solution precipitation (SPPT) Reference Tseng13 methodologies which have the potential to lead to unwanted contamination. The SOLVO route yields crystals up to 500 nm in size from a mixture of the metal oxides (Bi2O3 and GeO2) that are slurried in aqueous ammonium fluoride (NH4F) in the presence of HNO3 and heated at 310 °C at 20–50 MPa. Reference Kozhbakhteeva and Leonyuk14 In contrast, the SPPT route involved the dissolution of GeO2 and Bi(NO3)3 in HNO3, dilution with urea and water, heating the reaction mixture to 90 °C, and followed by the addition of sodium hydroxide. The initial (2 min) material isolated from this complex reaction mixture was found to be amorphous, but additional heating for 1 h led to phase-pure E-BGO (PDF entry 00-034-0416). Reference Tseng13,16 After decanting and heating to 500 °C in air, flower-like E-BGO crystals were isolated with a trace of the sillenite impurity reported. Reference Tseng13
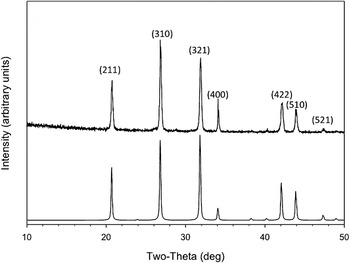
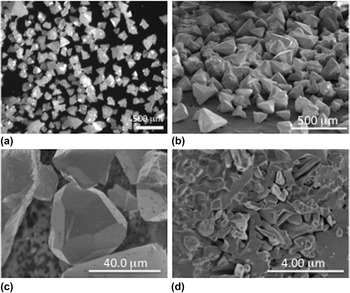
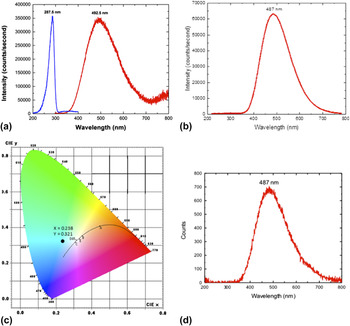
This work built on the research reported by Chen et al. where aurivillius (Bi2GeO5) nanorods were formed from a SOLVO mixture of Bi(NO3)3·5H2O and GeO2 dissolved in the presence of cetyltrimethyl ammonium bromide (CTAB) heated at 180 °C for 48 h, washed (water and ethanol), and dried at 80 °C for 6 h. Reference Chen, Bi, Wu, Li and Fu17 Surprisingly, the work by Chen et al. was not aimed at the E-BGO scintillator materials (referring to it as an impurity). Reference Chen, Bi, Wu, Li and Fu17 While both SPPT and SOLVO processing methods were investigated, only the latter process was found to successfully produce E-BGO and this will be the focus of this report. A variety of precursors were investigated but the optimal route proved to follow Eq. (1). In general, (Bi(NO3)3·5H2O) and GeO2 were dissolved in water and heated in a Parr™ digestion bomb at 185 °C for 24 h. Powder x-ray diffraction (PXRD) (PDF 00-034-0416, Fig. 1) and SEM (Fig. 2) identified the resulting powder as submillimeter-sized E-BGO. The synthesis, characterization, and the luminescent properties (Fig. 3) of the E-BGO materials generated from Eq. (1) are discussed in detail.
 $$4{\rm{Bi}}{({\rm{N}}{{\rm{O}}_3})_3} \cdot 5{{\rm{H}}_{\rm{2}}}{\rm{O}} + 3{\rm{Ge}}{{\rm{O}}_{\rm{2}}}\mathrel{\mathop{\kern0pt\longrightarrow}\limits_{{\rm{Parr\; Bomb\; 185}}\;^\circ {\rm{C}}}^{{{\rm{H}}_{\rm{2}}}{\rm{O}}}} {\rm{ B}}{{\rm{i}}_4}{({\rm{Ge}}{{\rm{O}}_{\rm{4}}})_3} + 12{\rm{HN}}{{\rm{O}}_{\rm{3}}}$$
Powder XRD patterns of E-BGO produced and listed as (condition/phase): (bottom) E-BGO simulated pattern, (top) E-BGO (PDF 00-034-0416).

Images of the as-synthesized SOLVO E-BGO (24 h at 185 °C): (a) optical (500 μm) and SEM at (b) 500 μm, (c) 40 μm, and (d) 4 μm.

Luminescent behavior of the E-BGO powders (low concentration sample): (a) PL, (b) CL, (c) chromaticity of the emission (sample location indicated by the •), and (d) radioluminescence induced by x-ray.

II. EXPERIMENTAL SECTION
All experiments were performed under ambient conditions in a hood. All samples were used as received (Aldrich), including Bi(NO3)3·5H2O (99.99%) and GeO2 (99.998%). The H2O used was collected from a Milli-Q, Millipore water purification system using a ProgardR T3 cartridge.
Preparation of Bi 4 (GeO 4 ) 3 . Bi(NO3)3·5H2O (8.25 g, 17.0 mmol) was added to a Teflon™ liner of a 100 mL Parr™ digestion bomb filled with ∼70 mL of H2O. GeO2 (1.47 g, 14.0 mmol) was added to this mixture and another ∼15 mL of H2O was added, followed by gentle stirring. The bomb was then sealed and placed in an oven at 185 °C. After heating for 24 h, the bomb was removed and allowed to cool to room temperature. The contents were centrifuged, the mother liquor decanted off, and the powder washed 3 times with H2O. The remaining white precipitate was then dried under vacuum (10−3 Torr) at room temperature until a free flowing powder resulted. This powder was ground up with a mortar and pestle prior to analysis. The yield was 81.4% (4.31 g). The PXRD pattern was found to be in agreement with E-BGO (PDF: 00-034-0416).
A. Temporal study
Following the standard preparation of Bi4(GeO4) (vide infra), a set of reactions were prepared individually and placed into the oven. At pre-selected times (i.e., at hour: 1, 2, 6, and 12 and week: 1, 2, 6, and 12), the different bombs were removed, allowed to cool to room temperature, and worked up as described above. Each sample upon drying was analyzed using PXRD and TEM.
B. Concentration study
The reactant amounts and heating conditions listed above for the standard preparation of Bi4(GeO4)3 were used for the ‘medium’ route. Half and double the amounts were used for the ‘low’ and the ‘high’ concentration samples, respectively. These were made at the same time, heated, and worked up as noted above.
C. Powder x-ray diffraction
PXRD was performed by a PANalytical X’Pert Pro diffractometer using Cu Kα radiation (1.5406 Å) and a RTMS X’Celerator detector (PANalytical, Inc., Westborough, MA). Data were collected over a 2θ range of 10–100° at a scan rate of 0.15°/s and a zero background holder was used. The XRD patterns were analyzed using JADE 9 software (Materials Data, Inc., Livermore, CA) and indexed using The Powder Diffraction File PDF-4+ 2013. Reference Chen, Bi, Wu, Li and Fu17
D. Density He-pycnometry measurements
A gas pycnometer (Micromeritics, AccyPyc 1340, Micromeritics Instrument Corporation, Norcross, GA) was used to determine the powder density of E-BGO powder. The E-BGO samples were vacuum baked at 90 °C overnight prior to the density measurement. The dried powder was quickly weighed, transferred into a 10 mL cup, and placed in the closed test cell. Helium gas was used as the displacing medium to ensure maximum penetration and accuracy. The change in pressure before and after connecting the reference (fixed volume) and test cells were used to calculate the total volume and density of the E-BGO powder.
E. Thermal analysis (TGA/DSC)
The differential scanning calorimetry analysis (DSC) and thermogravimetric analysis (TGA) data for the E-BGO powder were collected by a Netzsch STA449C (simultaneous thermal analysis) system (NETZSCH Instruments North America, LLC, Burlington, MA) from room temperature to 1200 °C at a ramp rate of 5 °C/min. Standard calibration procedures were performed prior to the data collection. Sample was loaded in an alumina pan and covered with lid, and measurement was conducted under flowing air (100 mL/min).
F. Variable-temperature powder x-ray diffraction
Variable-temperature powder x-ray diffraction (VT-PXRD) experiments were performed using a Scintag PAD X diffractometer (Thermo Electron Inc., Waltham, MA), equipped with a sealed-tube source (Cu Kα, λ = 0.15406 nm), an incident-beam mirror optic, a peltier-cooled Ge solid-state detector, and a Buehler hot-stage with Pt/Rh heating strip and surround heater. Scintag instrument power settings were 40 kV and 30 mA, and fixed slits were used. Temperature calibration was performed using thermal expansion behavior of known materials (e.g., alumina) and calibrated to ±5 °C. The heating chamber was setup to run under air or flowing N2 gas (UHP). Samples were heated using a 20 °C/min ramp rate to the desired analysis temperature and held at the desired set point temperature while the XRD scan was measured. Diffraction patterns were collected over a scan range of 10–70° 2θ using a step-size of 0.05° 2θ and a count time of 1 s. XRD scans were collected in 20 °C temperature increments from room temperature up to 800 °C.
G. Scanning electron microscopy
Particles were deposited on adhesive conductive carbon placed upon standard 12.7 mm diameter SEM pin mounts. SEM images were collected using a Hitachi s-5100 scanning electron microscope (SEM; Hitachi High-Technologies Corporation, Tokyo, Japan) or an FEI Quanta series scanning electron microscope.
H. Photoluminescence measurements
The photoexcitation and emission spectra of E-BGO powder were measured by a standard fluorometer (PTI, QuantaMaster, Photon Technology International, Edison, NJ), using a Xe arc lamp as the light source. The system was coupled with a double monochromator on the excitation side and a single monochromator on the emission side. A long band pass filter (320 nm) was used to avoid frequency multiplication during data collection. Photoluminescence (PL) response was measured using a front-face measurement technique. PL spectra were collected at 0.25 nm per step for an accumulation time of 0.1 s. Both excitation and emission spectra were corrected with respect to the fluctuation of the light source and quantum efficiency of the photomultiplier tube.
I. Cathodoluminescence measurements
The powder prepared by a low concentration solution was placed on conducting carbon tape and mounted on a SEM stub for cathodoluminescence measurement. The cathodoluminescence (CL) responses were collected on an SEM equipped with CL detector (Gatan MonoCL4, Gatan, Inc., Pleasanton, CA). Luminescence spectrum induced by the electron excitation (20 keV, 0.83 nA) was collected by an elliptical mirror and captured by a CCD camera with a multichannel analyzer. Each CL spectroscopic response was collected for 30 s from 218 to 780 nm.
J. Radioluminescence measurements
The submillimeter size crystals prepared by a low concentration solution were used for the radioluminescence (RL) measurement. The luminescence spectrum was excited using a standard sealed-tube x-ray source (Cu Kα ∼8.0 keV; 40 kV, 30 mA) and was collected by a photonic multichannel analyzer (Hamamatsu, PMA-12 C100027, Bridgewater, NJ) in a dark box.
K. Diffuse reflectance spectrum
The band gap of E-BGO was estimated from the diffuse-reflectance spectrum obtained using a UV-vis system (Shimadzu) and using the Kubelka–Munk function and Tauc equation (Eq. 2, see Sec. III. B. 5). Reference Tuac18
III. RESULTS AND DISCUSSION
The interest in determining the properties of E-BGO under a variety of radiation environments required a simple synthesis method. As stated earlier, there are a limited number of solution routes, Reference Tseng13,Reference Kozhbakhteeva and Leonyuk14 which are complicated by the addition of HNO3 and other reagents that could lead to trace impurities. The work presented in this report details the (A) synthesis, (B) powder characterization, and (C) processing parameters of the E-BGO materials obtained through the simple SOLVO route, which uses only Bi(NO3)3·5H2O and GeO2 [as shown in Eq. (1)]. Based on these data, a possible (D) mechanism for the growth process is discussed.
A. Synthesis
The limited number of useful Ge compounds that were commercially available led us to investigate the air-stable, water soluble GeO2 precursor. Once water was selected as the solvent system, Bi(NO3)3·5H2O was chosen based on its high solubility in H2O. After a number of attempts made to generate pure E-BGO, it was determined that the addition of excess GeO2 helped to minimize/eliminate non-innocent Bi by-products and any residual GeO2 could be easily removed by washing with water or by thermal treatment (see Supporting Information for more details on impure samples). The samples were added to water [Eq. (1)] in a Parr™ digestion bomb (upon mixing the pH = ∼4.0; within 1 min pH = ∼1.0), sealed, and heated to 185 °C for ∼24 h. After cooling to room temperature, the white precipitate was separated from the mother liquor (pH = ∼1.0) by centrifugation, washed, and dried in vacuo for 12 h. The resulting free flowing white powder appeared to be shiny and crystalline.
B. Powder characterization
To further identify the bulk materials isolated from the above synthesis, (1) PXRD, (2) microscopy (optical, SEM), (3) density, (4) luminescent properties (i.e., PL, CL, and RL), and (5) band gap estimation analyses were undertaken. The results from these studies are discussed in the following sections.
1. PXRD
The E-BGO calculated PXRD pattern [Fig. 1(a)] and the resulting hydrothermal generated powders (Bi4Ge3O12; Fig. 1(b); PDF 00-034-0416) were found to be in good agreement. While this process has been optimized to generate the eulytite material (see Experimental section), several different PDF entries were initially identified for the E-BGO phase (see Supporting Information) isolated during the early development of this synthesis route. Adjustments to the processing conditions (e.g., 24 h heating schedule, concentration, etc.) yielded more consistent results for the E-BGO phase as matching entry 00-034-0416 as documented in the PDF database. 16 The E-BGO powders made here may be of interest for use as starting raw materials since they are phase pure while others often suffer from mixed phases or lower densities (even after high temperature annealing). Reference Novoselov, Makarov, Fedotov, Ivannikova and Shubin9
2. Microscopy
Optical images of the E-BGO samples [Fig. 2(a)] revealed a shiny, crystalline material that appears to consist of tetrahedral-shaped particles. SEM analysis revealed similar shaped grains approaching 40 μm in size [Figs. 2(b)–2(d)]. The surface of the particles was observed to be fairly smooth and appear quite faceted. As the magnification was increased, some smaller particles were observed on the surface of some of the samples, which appear as parallelepiped- and irregular-shaped plates. In addition, smaller irregular-shaped particles were noted in the background. The surface images [Fig. 2(d)] may reflect some smaller growth particles or that the larger particles may be composed of agglomerated smaller particles. Determination of the density of the particles was undertaken to clarify which of these conditions exists.
3. Density
The density measured for the standard prepared materials was found to be 6.982(3) g/cm3, as determined by a He pycnometer. This is equivalent to a 98.18% of the theoretical density of 7.112 g/cm3 determined via single crystal x-ray density measurement. This indicates that the particles observed are quite dense and the smaller particles noted in Fig. 2(d) must be surface particulates. Thus, it was expected that these crystals would possess both high optical quality and high density to minimize light scatter due to porosity and refractive index mismatch at the interface of a second phase.
4. Luminescent properties
To determine their luminescent properties and whether the bulk E-BGO powders were of any utility as a phosphor or scintillator, the luminescent properties were determined. Excitation (Ex) and emission (Em) peaks were noted at 287.5 and 492.5 nm, respectively. The PL spectra are shown in Fig. 3(a) and are consistent with bulk crystal literature reports on the expected Ex and Em results. Reference Yen, Shionoya and Yamamoto1,Reference van Eijk4,Reference Tseng13,Reference Bordun19
The CL response for the E-BGO crystals prepared by low concentration route was measured. Figure 3(b) illustrates the spectroscopic emission for the E-BGO powders, which is similar to their PL response, with a broadband emission having a maximum at 487 nm. These results indicate that E-BGO will be effective for both detection of photonic and ionization excitation sources and would be of interest for phosphor, electroluminescence, x-ray imaging, and scintillation detection applications. The overall emission color was calculated according to CIE color space with color coordinates of 0.238(x)/0.321(y), which is a slightly bluish white. Figure 3(c) shows a chromaticity emission spectrum with the dark circle indicating where this E-BGO sample falls in this spectrum (note: this broad emission comes from a single phase sample not a combination of 3 phosphors as is commonly used in solid-state lighting applications). To move closer to standard D65 daylight (with coordinates of 0.3129(x)/0.3292(y)), an effective red-shift dopant such as Eu3+ may be added to render better white-light emitting characteristics. The radioluminescence induced by the x-ray excitation is consistent with the CL response, as both of these sources produce ionization luminescence. Finally, the RL [Fig. 3(d)] response confirms the potential of this material for medical applications. Reference Katoh, Yasuda, Shiga, Hasegawa, Onimaru, Shimizu, Bengua, Ishikawa, Tamaki and Shirato20
5. Band gap estimation
Part of the characterization of the E-BGO powders involved the determination of the band gap (using a Tauc plot). Such information reveals the optical absorption spectrum of a material. In a Tauc plot, a single phase material will have a distinct absorption onset as defined by a nearly linear region in the plot that yields the energy of the optical band gap of the sample. The diffuse reflectance spectrum was converted to a Kubelka–Munk function (F(R)), which is proportional to the absorption coefficient (α). F(R) was then substituted into Tauc equation (Eq. (2), where E g is the optical band gap and hυ is the photon energy). Fitting routines were performed by plotting (hυF(R))1/n versus hυ for the E-BGO powder (or Tauc plot) where the intersection of the uprising curve to the horizontal axis is the estimated E g (optical band gap). Reference Tauc, Grigorov and Vancu21
 $${(h{\rm{\upsilon \alpha }})^{1/n}} = A(h{\rm{\upsilon }} - {E_{\rm{g}}})\;\sim\;{(h{\rm{\upsilon }}F(R))^{1/n}}\quad.$$
From the Tauc plot, using both the Kubelka–Munk function and Tauc equation [Eq. (2)], the estimated band gap was found to be ∼3.64 eV. This is in agreement with the reported literature value of ∼3.6 eV. Reference Polosan, Galca and Secu22 The exponent n = 2, derived from the Tauc plot suggests that the transition is an indirect allowed transition. Therefore, the band gap of the powders generated in this process is in good agreement with other high quality single crystal materials. Since the estimated band gap is 3.64 eV (∼361 nm), it is not surprising that all the emission spectra are the same, regardless if it was induced by photoexcitation (287.5 nm or 4.31 eV) or by CL (>4–20 keV) and x-ray (∼8 keV), as these excitations have exceeded the band gap and will produce the same host excitation.
C. Processing parameters
1. Thermal stability
Additional studies were undertaken to determine if the thermal stability of the E-BGO powders was sufficient for higher temperature processing that may be necessary for specific applications such as single crystal melt growth processes. This study involved (a) TGA/DSC, (b) VT-PXRD, and some processing studies.
a. TGA/DSC
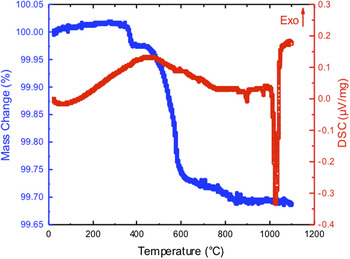
Initially, TGA/DSC curves were obtained to determine if any melts, crystallization, or decomposition pathways could be elucidated. From all samples studied, a two-step, slow weight loss of average 0.75% was noted. A sample of a first pass TGA/DSC is shown in Fig. 4. The first weight loss was attributed to entrapped water, whereas the second step was tentatively assigned to the loss of GeO2 [note: this is consistent with the VT-PXRD (vide infra and supporting information) data]. Up to 1000 °C, there were no additional weight losses or thermal events recorded, indicating the stability of the E-BGO powder. An endotherm was noted in the DSC (Fig. 4) at 1034 °C, which is consistent with the literature report for the bulk E-BGO melting point of 1049.85 °C. 3 A sample that was heat-treated to 950 °C followed by cooling and reheating demonstrated no weight loss but the same melting point. This indicates that a low-temperature heat process will remove GeO2 impurities and that the E-BGO material is relatively stable up to its melting point.
TGA/DSC curves of initial hydrothermal E-BGO powder.

b. VT-PXRD
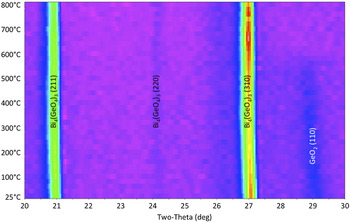
VT-PXRD of an E-BGO sample heated in UHP N2 (ramp rate 20 °C/min to 800 °C) and monitored via XRD is shown in Fig. 5. The initial scan shows the typical diffraction pattern for E-BGO. A very minor second phase was detected in the initial XRD pattern prior to heating, which disappears upon heating to 540 °C. This was initially thought to be a Bi-containing species [i.e., Bi6O7 (04-015-6628) and Bi2GeO5 (04-011-0087)] due to the volatility noted; however, these were eliminated from consideration, since the VT-PXRD of impure samples (see Supporting information) revealed that Bi impurities would induce decomposition of the E-BGO phase. This left the potential identity of the impurity as GeO2 (argutite; PDF 00-035-0729). For this identification to be valid, significant adjustment of the GeO2 unit cell must be made. The loss of the minor GeO2 phase is either due to the oxide's volatility, Reference Bernstein and Cubicciotti23 glassy phase formation, Reference Jiang, Su, Yu, Guo, Tang, Xu, Zheng, Li and Xu24 or consumption by the E-BGO. Definitive elucidation of this or other pathways has not been determined but it can be noted that the presence of this small impurity does not appear to detrimentally impact the Bi4(GeO4)3 phase and is lost upon heating. These results are consistent with the temperatures noted for the weight losses in the TGA. Lattice parameter refinements of the E-BGO phase in Fig. 5, both before and after heat treatment, were identical within the error of the refinement. The resulting values were a = 10.505(3) Å (before) and a = 10.502(3) Å (after).
VT-PXRD of E-BGO powders (2θ range: 20–30).

c. Processing
The thermal data suggest that the E-BGO material is stable over the temperature range investigated. Samples of the E-BGO powder were fired at 125, 450, and 650 °C under circumjacent atmospheres and the resulting PXRD patterns demonstrated that E-BGO was maintained, confirming the above conclusion. It is of note that there are some distinct changes in the orientation of the final powder noted during the processing. In particular, the 450 °C samples showed the most prominent changes, probably due to the loss of both H2O and GeO2 and the subsequent recrystallization. The density of the 650 °C treated material was also analyzed by He pycnometry analysis and was found to be 6.978(3) g/cm3, which is equivalent to a 98.12% of the theoretical (single crystal) density of 7.112 g/cm3. The consistency of the density of the E-BGO from room temperature to high temperature processing further indicates the stability and quality of the as-synthesized E-BGO.
2. Reaction concentration effect
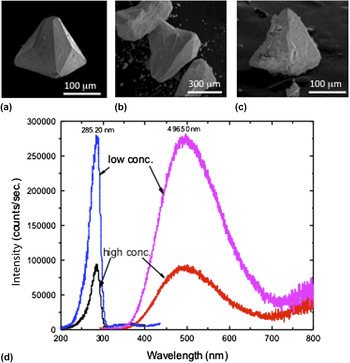
In a similar effort to determine some of the possible processing parameters, the concentration of the reaction mixture was varied. Three samples were run according to the Experimental section discussion with: (a) ‘low’ concentration (half the amount of precursors), (b) ‘medium’ or standard concentration, and (c) ‘high’ concentration (2 times the amount of precursor). The powders were analyzed by PXRD and all proved to be phase-pure E-BGO. SEM images were collected and are shown in Fig. 6, the samples all appear similar in size and shape but, as the concentration is increased, smaller fragments can be observed on the particle surface. As expected, the excitation (Ex) and emission (Em) maximum were found to be approximately the same for each sample investigated (small shifts due to selected local maxima were noted) and consistent with the literature reports of bulk E-BGO. Reference Yen, Shionoya and Yamamoto1,Reference van Eijk4,Reference Tseng13,Reference Bordun19
Concentration effect on particles size: SEM images of (a) low, (b) standard, and (c) high and the impact on the (d) PL spectrum.

A significant impact on light output of the different concentrations (‘low’, ‘medium’, ‘high’) produced powders was noted. E-BGO material prepared by low concentration possesses well-developed facet surfaces and a higher light output. The images of the ‘medium’ (i.e., standard) concentration powders were similar to that of the ‘low’ concentration material; whereas, the ‘high’ concentration suffered a decrease in performance [Fig. 6(d)]. The observation suggests that there may be a correlation between the perfection of crystallinity and the luminosity in sample preparation. Quantum yields could not be measured with the current equipment, but additional studies into this phenomenon are underway. The various morphologies noted here follow an expected rate of reaction: (i) the higher concentration preparation leads to more rapid growth rate and a rougher interface with the solution and (ii) lowering the concentration gave smoother facet surfaces. The supersaturation of the solution appears to impact the growth rate by altering the local concentration of the solute at the surfaces. Higher solute concentrations lead to more rapid precipitation, and growth of rough surfaces is typical. Examples of this phenomenon are clearly observed in the SEM data [Figs. 6(a)–6(c)].
3. Temporal studies
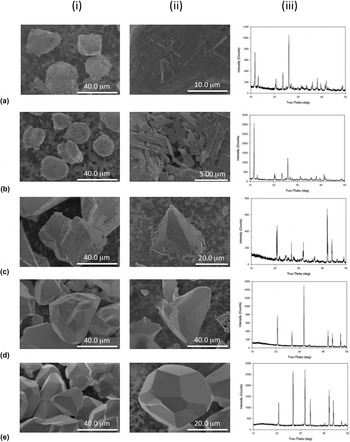
A temporal study concerning the crystallite size of the E-BGO was undertaken to determine the optimal heating time and if larger crystals could be generated. Samples were collected at 1, 2, 6, and 12 h [Figs. 7(a)–7(d), respectively] as well as at 1, 2, 4, and 8 weeks [Fig. 7(e)]. The PXRD pattern obtained [Figs. 7(a,iii)] indicated that at 1 h, the Bi2(O)2(OH)(NO3), phase Reference Henry, Evain, Deniard, Jobic, Abraham and Mentre25 had already formed. This phase was maintained through the 2 h sample [Figs. 7(b,iii)] but by 6 h, the E-BGO had clearly formed, with some minor unidentified phases present [see Figs. 7(c,iii)]. At 12 h [Figs. 7(d,iii)], all of the material had converted to the E-BGO (PDF 00-034-0416) and all additional samples (1, 2, 3, and 8 weeks) were identified as phase-pure E-BGO [Figs. 7(e,iii)]. SEM images for the 1 and 2 h samples show that the Bi2(O)2(OH)(NO3) materials consist of 10–20 μm spheres that have a surface coating of smaller rod-like crystals [see Figs. 7(a,b: i,ii)]. By 6 h [Figs. 7(c: i,ii)], the smoother E-BGO crystals had formed and were ∼40 μm in size. After 12 h [Figs. 7(d: i,ii)] and over the next 8 weeks [Figs. 7(e: i,ii)], the samples do not appear to grow significantly larger in size, but did appear smoother and more faceted. It is reasoned that the long aging times lead to smoother interfaces by an Ostwald ripening process, where asperities preferentially dissolve and precipitate in concave locations of the surface facet. While attempts to grow larger seeds were not successful, samples of pure E-BGO can be obtained in as little as 12 h.
E-BGO sample heated at 185 °C under SOLVO conditions for (a) 1 h, (b) 2 h, (c) 6 h, (d) 12 h, (e) 8 weeks: (i and ii) SEM images and (iii) PXRD patterns.

D. Reaction mechanism
In a hydrothermal process, it is well established that nucleation events control the development of the particles isolated. It is clear that the eulytite phase is the thermodynamically favored form of BGO generated under the conditions described here. Reference Pokrovski, Martin, Hazemann and Schott26–Reference Ranieri, Haines, Cambon, Levelut, Le Parc, Cambon and Hazemann28 By examining the materials developed during the first 12 h of the reaction, some insight into the growth mechanism can be elucidated.
Consistent with literature reports on the hydrothermal behavior of Bi(NO3)3·5 H2O, the initial (1 h) precipitated species was isolated as Bi2(O)2(OH)(NO3). Reference Henry, Evain, Deniard, Jobic, Abraham and Mentre25,Reference Tooth, Etschmann, Pokrovsi, Testemale, Hazemann, Grundler and Brugger27 The identity of the soluble Bi species is limited under hydrothermal conditions and most likely a neutral hydroxide complex, such as the sparingly soluble (less than 400 °C) Bi(OH)3 (aq). Reference Tooth, Etschmann, Pokrovsi, Testemale, Hazemann, Grundler and Brugger27 Therefore, under the 185 °C reaction conditions found here, the rate will be limited by the concentration of the bismuth soluble species. The Ge component of the reaction is expected to be a dissolved tetrahedral Ge(OH)4, which is reportedly stable over the pH range of 0–8 and up to temperatures of 350 °C. Reference Ranieri, Haines, Cambon, Levelut, Le Parc, Cambon and Hazemann28,Reference Pokrovski and Schott29 This compound will eventually react with the much less concentrated Bi species such that it will kinetically impact the precipitation reaction.
The next step in this process is the reaction of Bi2(O)2(OH)(NO3)/Bi(OH)3 with Ge(OH)4 to initiate the formation of E-BGO, which requires 6 h [Fig. 7(c)]. For the stable E-BGO to form, an oxolation conversion needs to occur between soluble Bi(OH)3 and Ge(OH)4 species, expected to be slow due to the sparingly soluble Bi component. However, once an E-BGO nucleus is present, the dissolution of the Bi2(O)2(OH)(NO3) precipitate will start to increase due to the presence of the newly formed HNO3 [Eq. (1)]. Consistent with this step is the PXRD data at 6 h, that reveal the loss of crystallinity for the Bi2(O)2(OH)(NO3) species. The growth rate of the particles at this time is rapid, achieving ∼40 μm particle sizes that are very uniform [Fig. 2(a)]. Between 6 and 12 h of reaction, virtually no new stable nuclei are formed. Thus in this study, the particle growth observed in this system exhibits a mechanism of dissolution-precipitation that can be characterized as a classic LaMer nucleation and growth phenomenon.
IV. SUMMARY AND CONCLUSIONS
A simple, low-temperature, hydrothermal route to phase-pure E-BGO has been developed. The submillimeter-sized particles were found to have formed in as little as 12 h of processing at 185 °C as determined by SEM and TEM analyses. To prevent substoichiometric phases during synthesis, excess GeO2 was added during the synthesis and any residual GeO2 was removed by washing with water or via thermal treatment. All samples were dried under vacuum. Thermal treatment of the pure E-BGO, as determined by TGA and VT-PXRD analyses, proved the thermal stability of the synthesized phase. The PL, CL, and RL spectra of the resulting powders were found to be in-line with single crystal emission and excitations. The CL response was unexpectedly bright and falls relatively close to pure white light. The air stability and RL response suggest that these materials may be used for medical applications. In addition, the density of the material was found to be in line with existing bulk powder synthesis. A temporal study indicated that the crystallite size did not grow substantially after the 24 h synthesis and concentration variations did not play a major role in the morphology of the obtained powders. Further work is under way on lanthanide dopants to alter the emission and excitation maxima.
Supplementary Material
To view supplementary material for this article, please visit http://dx.doi.org/jmr.2014.97.
ACKNOWLEDGMENTS
The authors thank S. Bingham and C. Mcglinchey for technical assistance and the Laboratory Directed Research and Development (LDRD) program at Sandia National Laboratories for support of this work. Sandia National Laboratories is a multi-program laboratory managed and operated by Sandia Corporation, a wholly owned subsidiary of Lockheed Martin Corporation, for the U.S. Department of Energy's National Nuclear Security Administration under contract DE-AC04-94AL85000.