Introduction
Nasal polyps are benign protrusions into the nasal cavity, characterised by chronic inflammation of the nose and paranasal sinuses. The prevalence of nasal polyps in general population is 1–4 per cent. Nasal polyps are two times more common in males than females.Reference Koc1 The aetiopathogenesis of nasal polyps is not clearly understood; however, factors considered to play a role in nasal polyps development include allergy, bronchial asthma, genetic factors, anatomical disorders, epithelial rupture, chronic local infections, mucosal contact, Bernoulli's phenomenon and connective tissue disorders.Reference Keles, Cora, Acar, Arbag, Inan and Ozturk2
The underlying pathology leading to the development of nasal polyps is nasal mucosal oedema. A variety of factors play a role in the development of oedema and inflammation, including multiple inflammatory cells, cytokines, growth factors and chemical mediators. The cells mainly responsible for inflammation in nasal polyps are eosinophils, leukocytes, mast cells and lymphocytes.Reference Settipane, Lund and Tos3
Macrophage migration inhibitory factor is a proinflammatory agent that promotes macrophage activity at inflamed sites and is crucial for the activation of inflammatory cells. It promotes tumour necrosis factor and interleukin-8 secretion.Reference Calandra, Berhagen, Metz, Spiegel, Bacher and Donnelly4 Macrophage migration inhibitory factor is mainly released by macrophages, monocytes, T and B cells, neutrophils, mast cells, and epithelial cells, and has an influence on macrophages, lymphocytes and granulocytes.Reference Calandra and Roger5 Macrophage migration inhibitory factor stimulates the release of other proinflammatory cytokines and its own release as well, through its autocrine and paracrine actions.Reference Santos and Morand6
Steroids are the strongest anti-inflammatory drugs, with proven therapeutic effects on nasal polyps. These are still the most commonly and effectively used agents in the treatment of nasal polyps.Reference Settipane, Lund and Tos3 Macrophage migration inhibitory factor regulates the immunosuppressive effects of glucocorticoids and has a role in the control of immune responses. Macrophage migration inhibitory factor acts in the opposite direction to the anti-inflammatory actions of glucocorticoids.Reference Calandra, Bernhagen, Mitchell and Bucala7, Reference Donn and Ray8
A literature search revealed a limited number of studies on the association between macrophage migration inhibitory factor levels and nasal polyps. These studies addressed macrophage migration inhibitory factor concentrations in polyp tissues, while no study investigated serum macrophage migration inhibitory factor concentrations. Furthermore, there is no published literature on the concentrations of macrophage migration inhibitory factor in the serum before and after treatment with steroids in patients with nasal polyps.
This study aimed to determine serum concentrations of macrophage migration inhibitory factor in patients with nasal polyps compared with controls, and also assess serum concentrations before and after treatment with steroids. Nasal polyp intensity of the patient group was also investigated for statistical correlation with serum macrophage migration inhibitory factor values, according to the Lund–Mackay computed tomography (CT) scoring system.Reference Hopkins, Browne, Slack, Lund and Brown9
Materials and methods
This study was conducted in the Department of Otorhinolaryngology at the Medical School of Hitit University, Turkey, between 7th July 2016 and 6th June 2017. Ethics approval for the study protocol (project no. 2017/42) was obtained from the Clinical Trials Ethics Committee of Hitit University. Written informed consent was obtained from patients and the control group individuals who participated in this study.
Twenty-four patients with nasal polyps (mean age (± standard deviation (SD)) of 37.62 ± 12.87 years; range, 18–50 years) and 25 healthy controls (mean age (± SD) of 35.74 ± 13.037 years; range, 18–50 years) were included in this study. In patients who presented with nasal obstruction, nasal polyps were diagnosed based on anterior rhinoscopy, nasal endoscopy and CT scanning of the paranasal sinuses. All of our patients complained of nasal obstruction.
Patients with atherosclerotic heart disease, malignancy, hypertension, severe systemic diseases, diabetes mellitus, any nasal pathology other than isolated nasal polyps, a history of aspirin sensitivity, those using intranasal drugs, and those who had undergone sinus surgery were excluded from the study. Exclusion criteria for the control group were: nasal polyps, chronic sinusitis, bronchial asthma, nasal allergy, malignancy, a history of previous sinonasal surgery and chronic disease. None of the patients or controls were smokers or consumed alcohol.
On the paranasal CT scan, patients were scored according to polyp density and location of involvement, using the Lund–Mackay scoring method.Reference Hopkins, Browne, Slack, Lund and Brown9 For each nasal cavity, if there was no polyp in the maxillary sinus, anterior ethmoid sinus, posterior ethmoid sinus, frontal sinus and sphenoid sinus, 0 points were assigned. If there were limited polyps in these regions, 1 point was assigned for each. Two points were assigned for polyps filling the sinus completely. The presence of polyps in the osteomeatal complex was scored as 2 points. Both nasal cavity scores were calculated separately and the total score was recorded.
Patients were started on methylprednisolone at a daily dose of 1 mg/kg for ?? days; methylprednisolone was discontinued with a taper schedule, reducing the dose by 10 mg every 3 days. Patients were informed about the potential complications of prednisolone therapy and every patient provided written informed consent, indicating that they voluntarily agreed to be treated with the study drug.
Serum samples were collected from the nasal polyps patients before steroid therapy and after one week of treatment. Serum samples were taken only once from the control group individuals, who did not receive any treatment.
A venous blood sample (10 ml) was drawn from each patient between 8:00 am and 10:00 am, into tubes with a clotting activator, after 12 hours of fasting. After the formation of the blood clot, serum was separated from the blood clot by centrifuging the sample for 10 minutes at 3000 g. The sample was then stored at −80 °C in an Eppendorf tube, until tested.
Macrophage migration inhibitory factor measurements
Concentrations of macrophage migration inhibitory factor in the serum were determined using a sandwich enzyme-linked immunosorbent assay kit (code ‘ELH-MIF’; RayBiotech, Norcross, Georgia, USA). The optical absorbance measurements were read at 450 nm on a micro enzyme-linked immunosorbent assay auto reader (Alisei model; Radim, Firenze, Italy), without any deviation from the manufacturer's recommended procedures.
Intra- and inter-assay co-efficients of variation were less than 10 per cent and less than 12 per cent, respectively. Test range was 93.75–6000 pg/ml, with a sensitivity of 93.75 pg/ml. The lower detection limit for macrophage migration inhibitory factor concentrations was 6 pg/ml. Macrophage migration inhibitory factor concentration values below the limit of detection were considered as zero. All specimens were coded, and a single-blind analysis was conducted.
Statistical analysis
The software package SPSS (version 22.0; SPSS, Chicago, Illinois, USA) was used for all statistical analyses. Normality of the distribution was assessed using the Shapiro–Wilk test. Descriptive statistics for continuous variables were summarised as mean ± SD or median (range), based on the distribution assumption, and categorical data were presented as numbers and percentages. In the analysis of continuous variables, a paired t-test was used for the comparisons between the means of two normally distributed dependent samples, while the Wilcoxon signed rank test was used for non-normally distributed dependent groups. A p-value of less than 0.05 was considered statistically significant. The correlation between Lund–Mackay score and macrophage migration inhibitory factor concentration was investigated using the Pearson correlation co-efficient.
Results
The nasal polyps group comprised 24 patients (13 males and 11 females), with a mean age (± SD) of 37.62 ± 12.87 years. The control group consisted of 25 healthy individuals (12 males and 13 females), with a mean age (± SD) of 35.74 ± 13.03 years. The mean age and sex did not significantly differ between the two groups.
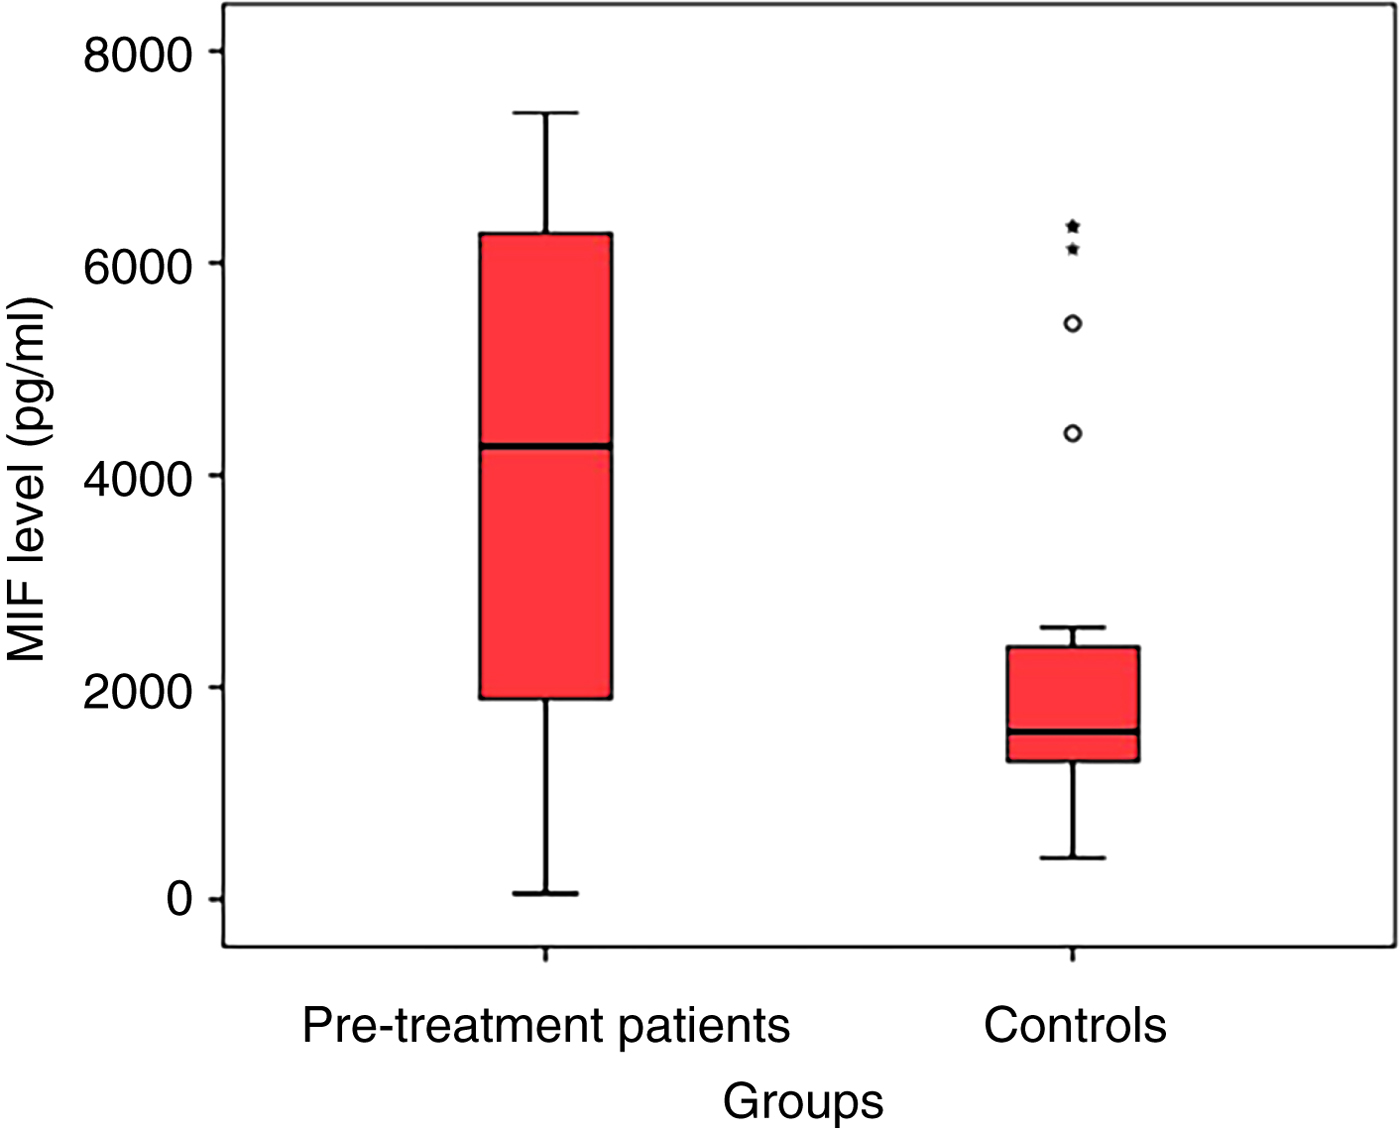
Comparisons between the groups revealed that the average macrophage migration inhibitory factor concentration before oral steroid therapy was 3889.79 pg/ml in the patient group and 2334.52 pg/ml in the control group. The macrophage migration inhibitory factor concentrations before oral steroid therapy were statistically significantly higher in the patient group than in the control group (p = 0.017) (Table 1 and Figure 1).
Patient and control group macrophage migration inhibitory factor (MIF) concentration levels (circles represents outliers).

Comparison of macrophage migration inhibitory factor concentration between patient and control groups

*Statistically significant (p < 0.05). SD = standard deviation
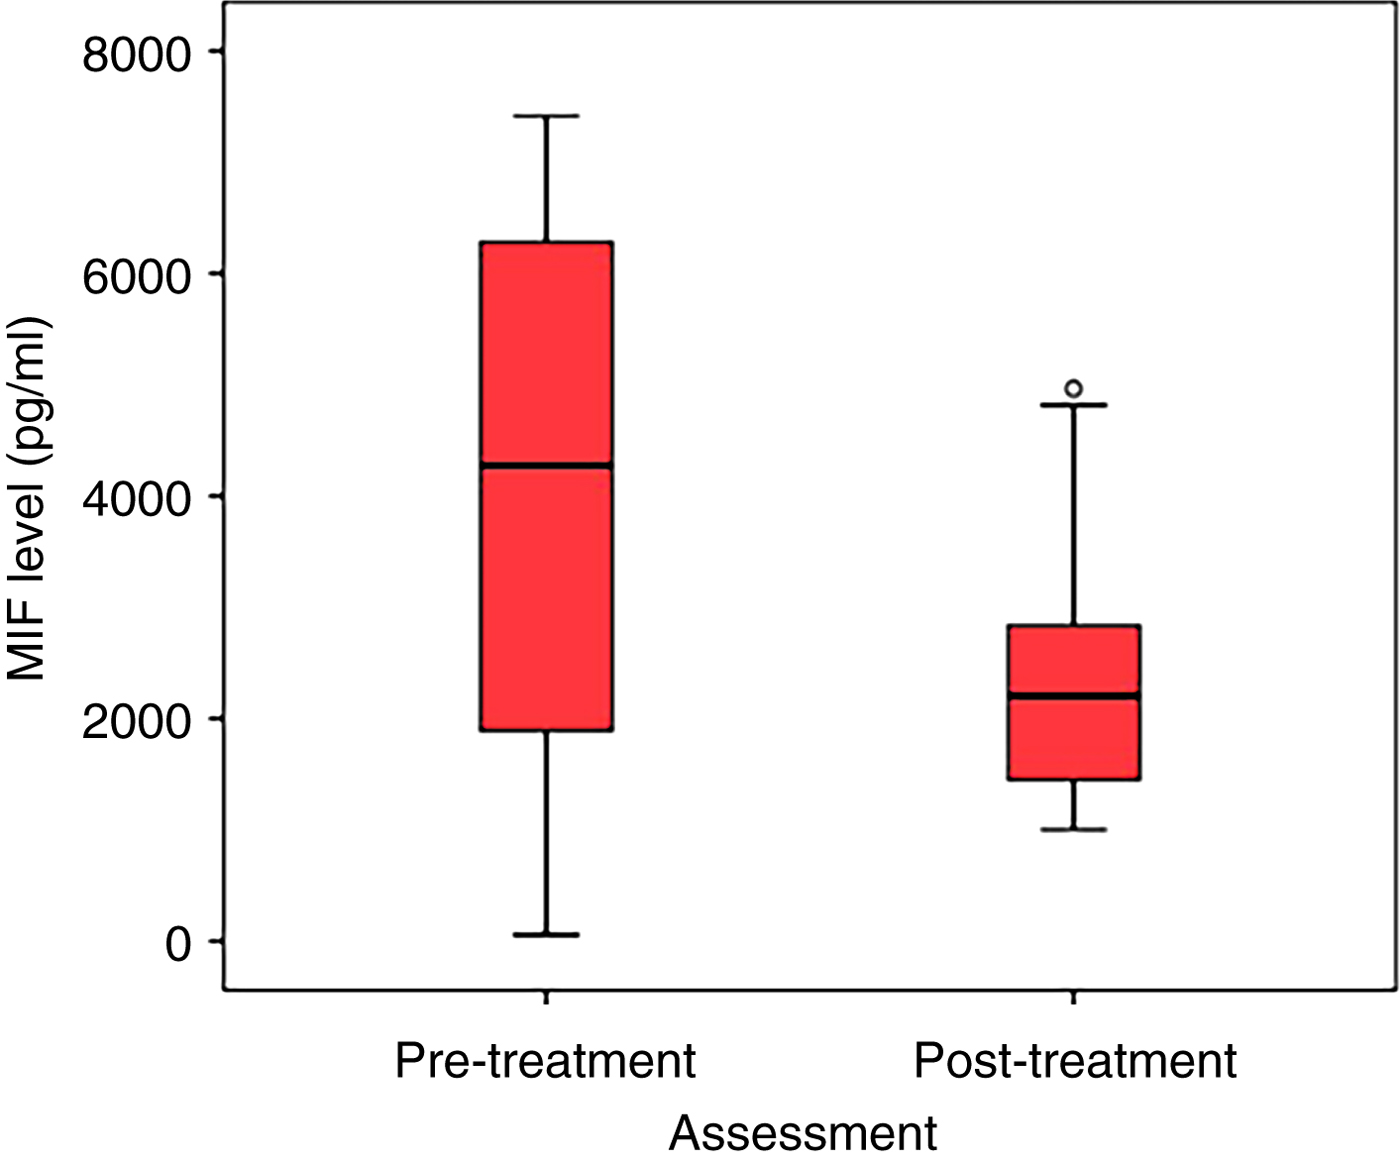
In the patient group, the average serum macrophage migration inhibitory factor concentration was 3889.79 pg/ml before oral steroid therapy and 2451.25 pg/ml after oral steroid therapy. The reduction in steroid therapy macrophage migration inhibitory factor concentrations after oral steroid therapy was statistically significant (p = 0.010) (Table 2 and Figure 2).
Macrophage migration inhibitory factor (MIF) concentration levels before and after treatment (circle represents outlier). *Indicates statistical significance.

Comparison of macrophage migration inhibitory factor concentration pre- and post-treatment

*Statistically significant (p < 0.05). SD = standard deviation
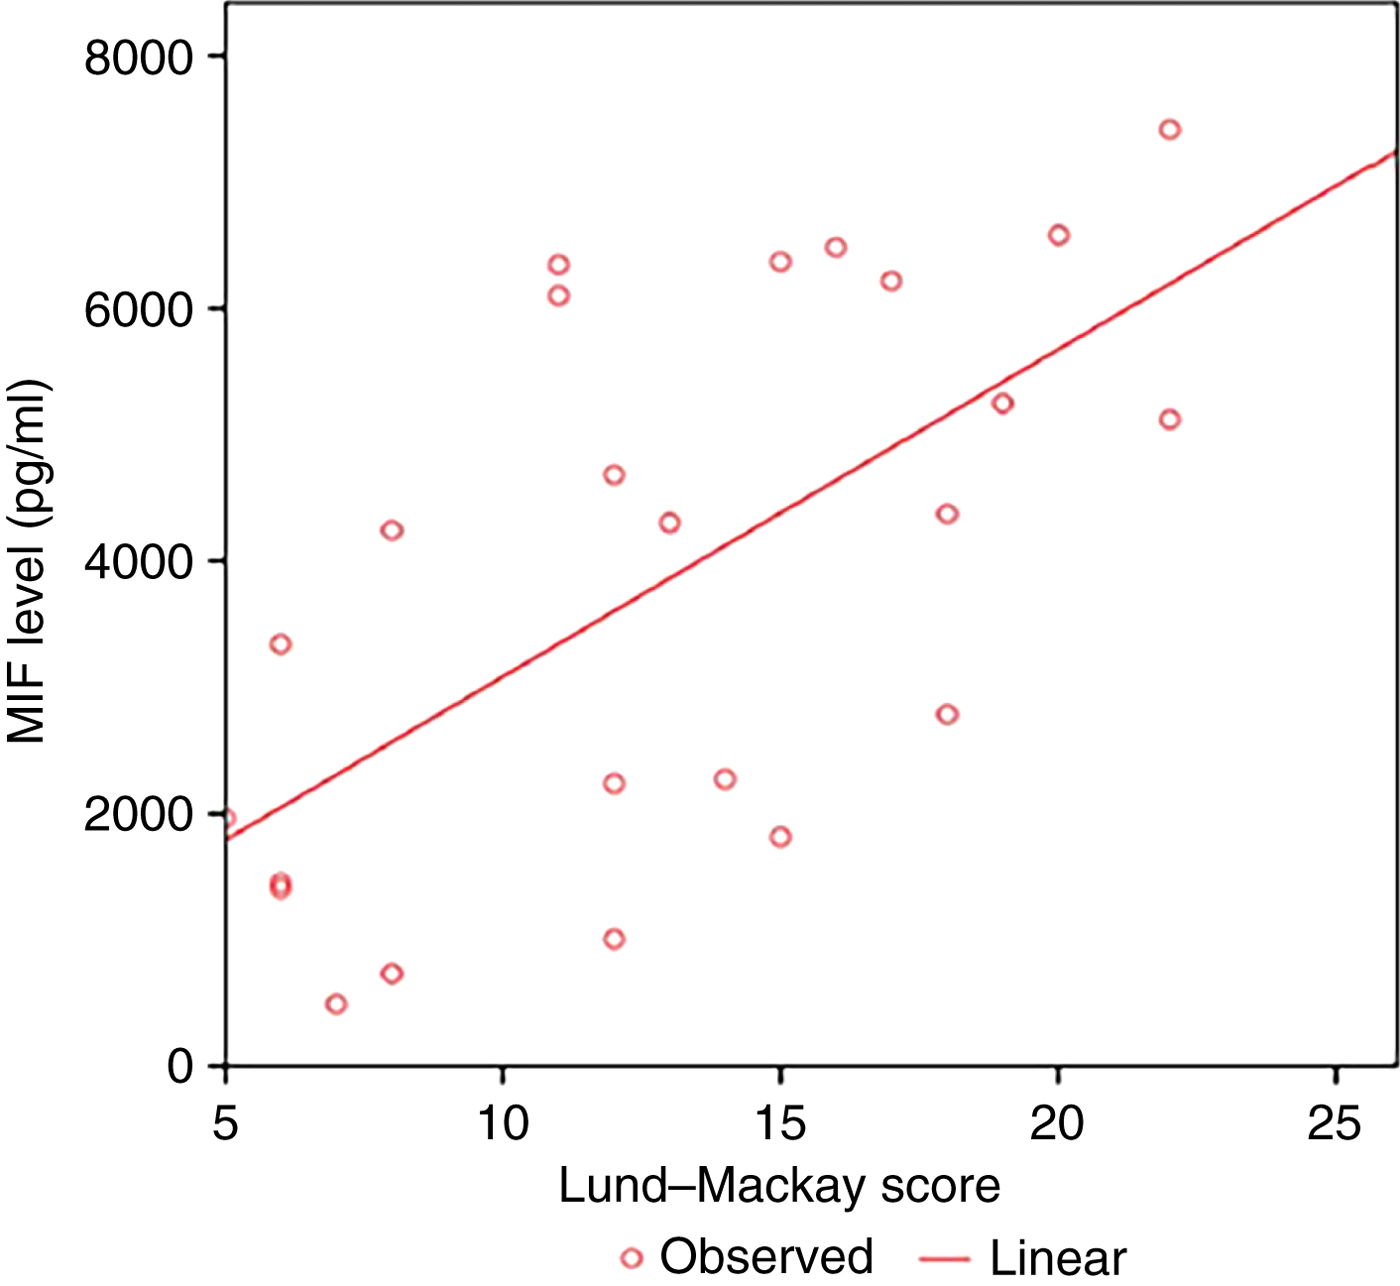
There was a statistically significant moderate positive correlation between Lund–Mackay score and macrophage migration inhibitory factor concentration (r = 0.624). A linear regression analysis between Lund–Mackay score and macrophage migration inhibitory factor concentration was performed (regression formula: macrophage migration inhibitory factor = 496.9 + 259.1 pg/ml × Lund–Mackay score; R2 = 0.389.) The linear regression analysis results are presented in Figure 3. The results indicate that the Lund–Mackay score is raised by 1 point when the macrophage migration inhibitory factor concentration value is raised by 259.1 pg/ml (range, 115.5–402.6 pg/ml).
Linear regression analysis results between Lund–Mackay score and macrophage migration inhibitory factor (MIF) concentration. (Regression formula: macrophage migration inhibitory factor = 496.9 + 259.1 pg/ml × Lund–Mackay score; R2 = 0.389).

Discussion
In this study, there was a statistically significant reduction in the serum macrophage migration inhibitory factor concentration of patients with nasal polyps after steroid treatment. Comparisons between the control and pre-oral steroid therapy patient groups demonstrated that macrophage migration inhibitory factor levels were statistically significantly higher in the pre-oral steroid therapy patient group. There was a moderately significant correlation between Lund–Mackay score and macrophage migration inhibitory factor concentration.
A literature search revealed a limited number of studies on macrophage migration inhibitory factor concentration in nasal polyps. Serum concentrations of macrophage migration inhibitory factor were not investigated before and after steroid treatment in nasal polyps patients.
The broad spectrum of regulatory abilities of macrophage migration inhibitory factor suggests its important role as a mediator in several diseases. These diseases include asthma, delayed hypersensitivity, allergic rhinitis, septic shock, atherosclerosis, rheumatoid arthritis and systemic lupus erythematosus.Reference Lue, Kleemann, Calandra, Roger and Bernhagen10 High macrophage migration inhibitory factor concentrations have been detected in many diseases, including atopic dermatitis, asthma, psoriasis, ulcerative colitis and rheumatoid arthritis. In one study, macrophage migration inhibitory factor concentrations in lacrimal fluid were found to be significantly higher in patients with atopic dermatitis compared to the control group.Reference Kitaichi, Shimizu, Honda, Abe, Ohgami and Shiratori11
Li et al. compared macrophage migration inhibitory factor concentrations in polyp tissues and inferior turbinate tissues from 48 patients with nasal polyps and 21 patients who underwent septoplasty.Reference Li, Ma and Ba12 They found significantly higher macrophage migration inhibitory factor concentrations in nasal polyp tissues than control tissues, and suggested that macrophage migration inhibitory factor may have a role in the aetiopathogenesis of nasal polyps. Consistent with these results, we found higher macrophage migration inhibitory factor concentrations in patients with nasal polyps than in controls.
In a study conducted by Delbrouck et al., 10 surgical resection specimens from nasal polyps were treated with budesonide at 3 different concentrations (10, 50 and 250 ng/ml) for 24 hours.Reference Delbrouck, Gabius, Vandenhoven, Kiss and Hassid13 In cell culture media, although low-dose budesonide (50 ng/ml) promotes macrophage migration inhibitory factor production from surface epithelium, reducing effects of budesonide on macrophage migration inhibitory factor production from glandular cells have been demonstrated. However, a completely opposite effect has been observed at a dose of 250 ng/ml. Delbrouck et al. reported that the regulatory effects of glucocorticoids on macrophage migration inhibitory factor production might differ based on the doses used in the treatment and the type of affected cells. In the current study, patients with nasal polyps had significantly reduced serum macrophage migration inhibitory factor concentrations following oral steroid therapy at a daily dose of 1 mg/kg.
Although glucocorticoids induce an increase in macrophage migration inhibitory factor release, the proinflammatory cytokine macrophage migration inhibitory factor has been defined as the sole down-regulator of glucocorticoids because of its inhibitory effects on steroids.Reference Donn and Ray8 Macrophage migration inhibitory factor expression is biphasically regulated by glucocorticoids. For example, low-dose dexamethasone increases macrophage migration inhibitory factor synthesis and release, while higher doses inhibit macrophage migration inhibitory factor synthesis.Reference Calandra, Berhagen, Metz, Spiegel, Bacher and Donnelly4, Reference Mitchell, Bacher, Bernhagen, Pushkarskaya, Seldin and Bucala14
Stathas et al. compared macrophage migration inhibitory factor and interleukin (IL)-6 concentrations in nasal polyp tissue specimens and healthy nasal mucosa specimens from patients who underwent functional endoscopic sinus surgery for nasal polyposis and those who underwent nasal septoplasty.Reference Stathas, Athanassiou, Drakouli, Giannopoulou, Mastronikolis and Naxakis15 Macrophage migration inhibitory factor and IL-6 expressions were significantly higher in polyp tissues compared to normal nasal mucosa. The authors concluded that the presence of macrophage migration inhibitory factor induced an increase in dexamethasone activity. Therefore, the use of macrophage migration inhibitory factor inhibitors in combination with glucocorticoids might be beneficial in the treatment of nasal polyps, in clinical practice.
In a study by Rossi et al., macrophage migration inhibitory factor concentrations were elevated in bronchoalveolar lavage fluid samples from patients with asthma.Reference Rossi, Haslett, Hirani, Greening, Rahman and Metz16 They reported that stimulation of eosinophils from same patients resulted in an increased production of macrophage migration inhibitory factor, under in vitro conditions. These results were purported to highlight the potential importance of macrophage migration inhibitory factor in asthma and other eosinophil-dependent disorders.
Nakamaru et al. reported that macrophage migration inhibitory factor concentrations in nasal mucosa were significantly higher in patients with allergic rhinitis than controls, and they found a positive correlation between macrophage migration inhibitory factor concentrations and clinical symptom intensity.Reference Nakamaru, Takagi, Oridate, Furuta, Nishihira and Fukuda17 Furthermore, there are reports indicating that eosinophils, glandular cells and surface epithelium produce macrophage migration inhibitory factor in inflamed areas in allergic rhinitis.
In a study by Kitaichi et al., macrophage migration inhibitory factor concentrations in lacrimal fluid were significantly higher in patients with atopic dermatitis than in the control group.Reference Kitaichi, Shimizu, Honda, Abe, Ohgami and Shiratori11 The authors concluded that macrophage migration inhibitory factor might contribute to ocular signs and symptoms of severe atopic dermatitis. In a study by Kozacı et al., post-treatment macrophage migration inhibitory factor concentrations were significantly higher than pre-treatment concentrations in nasal lavage fluids from patients with allergic rhinitis who were treated with topical steroids.Reference Kozacı, Chikanza, Eyigör, Döğer, Kavak and Evci18
Experimental studies on macrophage migration inhibitory factor antagonism have demonstrated the therapeutic effectiveness of neutralising anti-macrophage migration inhibitory factor antibodies in a number of autoimmune disorder models, including autoimmune diabetes, encephalomyelitis, myocarditis and glomerulonephritis.Reference Cvetkovic, Al-Abed, Miljkovic, Maksimovic-Ivanic, Roth and Bacher19–Reference Matsui, Okamoto, Jia, Akino, Uede and Kitabatake22 Although therapeutic benefits of macrophage migration inhibitory factor blockage have been demonstrated in animal studies, no human studies have been conducted. One study demonstrated that antibodies against macrophage migration inhibitory factor may prevent T cell activation, and could be an alternative treatment for sepsis where macrophage migration inhibitory factor might play a significant role.Reference Al-Abed, Dabideen, Aljabari, Valster, Messmer and Ochani23
• Nasal polyps are benign protrusions into the nasal cavity, characterised by nose and paranasal sinus chronic inflammation
• Macrophage migration inhibitory factor promotes macrophage activity at inflamed sites and is crucial for inflammatory cell activation
• Steroids are the strongest anti-inflammatory drugs, with proven therapeutic effects on nasal polyps
• This study investigated serum macrophage migration inhibitory factor concentration and nasal polyps, and compared before and after steroid treatment
• Concentrations were higher in nasal polyps patients than controls before oral steroid therapy, and were reduced after steroid therapy
• The findings suggest that macrophage migration inhibitory factor has a role in nasal polyps pathogenesis
This work has some limitations, including the small numbers of patients and controls. However, the comparison of macrophage migration inhibitory factor concentrations before and after treatment with endoscopy scores (Lund–Kennedy) is a valuable contribution.
Conclusion
Macrophage migration inhibitory factor concentrations before oral steroid therapy were found to be significantly higher in patients with nasal polyps than in healthy individuals. Furthermore, serum macrophage migration inhibitory factor concentrations were significantly reduced after steroid therapy. These findings suggest that macrophage migration inhibitory factor may have a role in the pathogenesis of nasal polyps. There was a significant positive correlation between Lund–Mackay score and macrophage migration inhibitory factor concentration. This suggests that high serum macrophage migration inhibitory factor concentrations indicate the extent of nasal polyps and nasal obstruction. Reductions in the size of nasal polyps and clinical improvements might be associated with reduced concentrations of macrophage migration inhibitory factor. More comprehensive studies with larger samples are needed.
Competing interests
None declared