

The United States incarcerates more of its population than any other nation in the world. Scholars across the social sciences, especially criminologists (Costelloe, Chiricos, and Gertz Reference Costelloe2009), sociologists (Johnson Reference Johnson2001; Schoenfeld Reference Schoenfeld2018), and economists (Lim Reference Lim2013; Park Reference Park2017) have investigated the precursors of the growing incarceration rates in the United States. Political scientists (Huber and Gordon Reference Huber2004; Yates and Fording Reference Yates2005; Gordon and Huber Reference Gordon2007; Moore Reference Moore2015) and other scholars outside the discipline (Johnson Reference Johnson2001; Lim Reference Lim2013; Park Reference Park2017; Schoenfeld Reference Schoenfeld2018) have devoted particular attention to the role politics play in the criminal justice system, and to the political antecedents of incarceration rates (Enns Reference Enns2014, Reference Enns2016; Schoenfeld Reference Schoenfeld2018). However, no systematic, comparative work has been done to investigate the effect of judicial elections on state-level sentencing and incarceration rates. Moreover, much of the research on the policy implications of judicial elections focuses on state appellate courts, especially state supreme courts (Brace and Hall Reference Brace1995; Hall Reference Hall2001; Hall and Bonneau Reference Hall2006; Bonneau Reference Bonneau2007; Bonneau and Hall Reference Bonneau2009; Gibson Reference Gibson2009, Reference Gibson2012; Canes-Wrone, Clark, and Kelly Reference Canes-Wrone2014; Nownes and Glennon Reference Nownes2016; Woodson Reference Woodson2017; Blake Reference Blake2018). Few studies have endeavored to study state trial courts (but see Huber and Gordon Reference Huber2004; Gordon and Huber Reference Gordon2007; Williams Reference Williams2007; Rachlinski et al. Reference Rachlinski2009; Lim Reference Lim2013; Nelson Reference Nelson2014; Rottman Reference Rottman2015; McKenzie and Rebe Reference McKenzie2017; Park Reference Park2017; Redman Reference Redman2017), leaving a gap in the literature that leads to the question, does the retention mechanism for trial judges affect a state’s sentencing and incarceration rates?
A long line of research on judicial behavior demonstrates that judges are not merely umpires calling balls and strikes, as Chief Justice John Roberts famously quipped during his confirmation hearing. Judges are motivated by myriad extralegal considerations including their ideology (Segal and Spaeth Reference Segal2002), strategic considerations (Epstein and Knight Reference Epstein1998), prestige for their institution (Hinkle and Nelson Reference Hinkle2016), lived experiences (Haire and Moyer Reference Haire2015), or how recently they have eaten (Danziger, Levav, and Avnaim-Pesso Reference Danziger2011). Similar to their legislative contemporaries (Mayhew Reference Mayhew1974), judges beholden to voters are likely, to some extent, motivated by the desire for reelection.
Previous research demonstrates the electoral considerations of judges by analyzing policy outcomes that are (1) directly tied to the behavior of judges and (2) sufficiently salient to voters to provide electoral motivation (Brace and Hall Reference Brace1995; Brace and Boyea Reference Brace2008; Caldarone, Canes-Wrone, and Clark Reference Caldarone2009; Canes-Wrone, Clark, and Park Reference Canes-Wrone2012; Lim Reference Lim2013; Canes-Wrone et al. Reference Canes-Wrone2014; Nelson Reference Nelson2014; Park Reference Park2017). Two policy outcomes that meet these criteria are sentencing and the resultant incarceration rates. Sentencing criminal defendants provides trial judges the opportunity to act in a manner to curry favor with a punitive public on a highly salient issue, such as crime (Levitt Reference Levitt1997), and research shows that incarceration rates are correlated with the punitive attitudes of the public (Enns Reference Enns2014, Reference Enns2016).
Studying trial courts is theoretically, empirically, and normatively important. First, trial judges are responsible for administering or overseeing the sentencing of convicted defendants, many of whom receive prison time. Second, state trial courts handle more than 99% of the nation’s caseload. Appellate courts, in contrast, handle only a small fraction of the caseload that state trial courts do (Federal Judicial Caseload Statistics 2015; Schauffler et al. Reference Schauffler2016). Third, trial judges who are ambitious may be motivated by reelection to their current seats as well as the opportunity to ascend to a seat on a higher court (Fox and Lawless Reference Fox2011). Indeed, previous research shows that voters reward trial bench experience in supreme court elections (Hall and Bonneau Reference Hall2006). Finally, previous research on trial judge behavior demonstrates that trial judges are responsive to public opinion in both criminal (Huber and Gordon Reference Huber2004; Lim Reference Lim2013; Nelson Reference Nelson2014) and civil (Dumas Reference Dumas2016) cases.
Based on this argument, I hypothesize that punitiveness will be higher in states with judicial elections than in states without them. To test the hypotheses, I use a time-series cross-sectional (TCSC) data set of state prison populations for a 38-year period in all 50 states—which, as far as I can determine, has not been previously used in judicial politics research—to measure punitiveness in terms of aggregate sentencing rates and state-level incarceration rates. I conduct several regression analyses that differentiate between judicial election types, using panel-corrected standard errors to contend with methodological concerns arising from the use of ordinary least squares (OLS) to analyze time-series cross-sectional data (Beck and Katz Reference Beck1995). The results support the hypothesis that judicial elections are associated generally with greater punitiveness in the states. Specifically, I show that states where judges face election to retain their seat on the bench have higher rates of incarceration than states without judicial retention elections, but that sentencing rates are apparently unaltered by electoral institutions.
The paper extends previous research on court-related policy outcomes to the level of trial courts and introduces a new data set to the field of judicial politics. In addition, this paper conducts the first investigation into the relationship between judicial elections and sentencing and incarceration rates. Leaving aside normative questions concerning mass incarceration in the United States, I argue that judicial elections provide the punitive public a democratic mechanism for holding trial judges accountable.
The remainder of the paper proceeds as follows. First, I provide a background on the debate about judicial elections, including proponents of judicial elections, who argue for accountability, and opponents (reformers), who prefer independence. Having provided the necessary background, I then build on previous research from various social sciences to develop the theory of elected punitiveness and offer three testable hypotheses and detail my empirical strategy for testing the hypotheses, including a brief description of the primary data set and the methodological approach. I present the results of my empirical tests before offering concluding remarks and discussing implications for my findings.
The Judicial Elections Controversy
Elections for state judges came to prominence in the decades preceding the American Civil War, and most state judicial elections at that time were partisan affairs. However, growing concerns about a politicized bench served as an impetus for change in the early 20th century (Shugerman Reference Shugerman2012). Judicial reformers—especially in the progressive movement and the legal community, including the American Bar Association—began to advocate for the dispatch of judicial elections or, at the very least, a change from partisan elections to nonpartisan contests. For a time, the reform movement was successful, but recent reform efforts have failed.Footnote 1
The central debate about judicial elections continues, pitting accountability claimed by election proponents against the independence preached by reformers (see Goelzhauser [Reference Goelzhauser2016, chap. 2] and Geyh [Reference Geyh2019, chap. 2] for historical recountings of the reform movement). The bulk of modern scholarship in opposition to judicial elections continues to come from the legal community (see, e.g., Carlton Reference Carlton2003; Geyh Reference Geyh2003, Reference Geyh2019; Sample, Jones, and Weiss Reference Sample2007; Pozen Reference Pozen2008; Friedman Reference Friedman2009; Kowal Reference Kowal2016; Fitzpatrick Reference Fitzpatrick2018). Legal scholars’ normative arguments against the practice of electing judges are rooted in idealized terms rather than based on empirical, scientific evidence (see Hall [Reference Hall2001] for a similar criticism). Indeed, much research from political science and other empirical disciplines rejects the claims of reformers. Reformers argue that elite appointments and nonpartisan elections grant judges a measure of independence (i.e., freedom from political pressures and the whims of voters). However, research shows that nonpartisan elections do not strip politicization from the judicial selection process (Hall Reference Hall2001; Canes-Wrone et al. Reference Canes-Wrone2014) and that elite appointments do not free judges from political pressure (Gray Reference Gray2017; Blake Reference Blake2018). Reformers contend that appointment produces judges of better temperament and more merit, but research shows that that no substantive differences exist in the qualifications of appointed versus elected judges (Canon Reference Canon1972; Glick and Emmert Reference Glick1987; Goelzhauser Reference Goelzhauser2016).
Reformers further argue that judicial elections do not even provide an accountability mechanism for the public, as advocates claim (Gambitta, May, and Foster Reference Gambitta1981; Baum Reference Baum1983; Hall Reference Hall1984; Flemming Reference Flemming1998; Mather Reference Mather1998; Oakley Reference Oakley2009). However, scholarship shows that elections do provide citizens with meaningful accountability (Hall Reference Hall2001; Hall and Bonneau Reference Hall2006; Bonneau Reference Bonneau2007). For example, Canes-Wrone et al. (Reference Canes-Wrone2014) study the effect of varying judicial selection institutions on the upholding of death penalty cases at the appellate level. In their investigation of state courts of last resort, they find that judges selected via nonpartisan elections upheld the capital sentence more frequently than judges selected under other institutional arrangements, echoing previous findings from Brace and Hall (Reference Brace1995). Park (Reference Park2017) investigates racial disparity in sentencing using the unique (and methodologically advantageous) arrangement of judicial districts in Kansas. Trial courts in Kansas are arranged in 31 judicial districts; judges in 14 of the districts are selected via partisan elections, while in the other 17 judicial districts, judges are appointed. Park’s results indicate that judges selected by the electorate tend to be more punitive toward Black defendants in time periods closer to an election than are judges in the 17 appointed districts. These results provide strong evidence that judges are considerate of electoral concerns, a hallmark of accountability, especially on criminal justice matters. This paper contributes to the debate by linking policy outcomes—sentencing and incarceration—to judicial elections and providing additional evidence of judicial accountability.
A Theory of Elected Punitiveness
Crime is a salient issue in American politics (Costelloe et al. Reference Costelloe2009), especially at the state level (Cummins Reference Cummins2009). When the economy is doing well, crime is frequently cited in public opinion polls as the most important issue facing the nation (Levitt Reference Levitt1997). Take, for example, the Views of the Electorate Research Survey (VOTERS) conducted by the Democracy Fund Voter Study Group in 2016, when the economy was vastly improved from its low point in 2009. In that survey, 92.5% of respondents listed crime as either a “very important” or “somewhat important” issue to them (Democracy Fund Voter Study Group 2017). The political importance of crime is also evidenced by the findings of Petrocik (Reference Petrocik1996) that politicians of both political parties devote nearly a quarter of their campaign messaging to matters of crime and justice, so it seems that candidates and officeholders understand the salience of crime to their constituencies (see also Petrocik et al. Reference Petrocik2003). As Peffley and Hurwitz (Reference Peffley2010, 11) put it, elected officials generally are “unusually cognizant of, and responsive to citizens’ attitudes toward crime.”
American attitudes toward handling crime fall along a spectrum. On the one end of the spectrum, people prefer the justice system to provide incarcerated citizens with rehabilitative services, such as education and workforce training, to permit successful reentry into society and reduce recidivism. Attitudes on the opposite end of the spectrum, where more punitive citizens prefer longer prison sentences and express favoritism toward the use of capital punishment, are the more common disposition of the American public (Johnson Reference Johnson2001; Enns Reference Enns2014, Reference Enns2016; Schaefer and Uggen Reference Schaefer2016).
Those punitive attitudes are often translated into public policy. For example, incarceration rates are significantly related to the punitive attitudes of the public (Enns Reference Enns2014, Reference Enns2016; Jennings et al. Reference Jennings2017). Although the executive and legislative branches are responsible for policymaking in the criminal justice arena, it seems dubious to assume those policymaking branches could be directly responsive to public opinion by incarcerating more people. A more plausible explanation is that trial courts translate the public’s opinion into rising or falling incarceration rates, as Hall and Windett (Reference Hall2015) demonstrated.
Judges in some states come to hold their seat on the bench via direct election by the people. The primary goal of elected officials is to win reelection, an assumption about trial judges supported by Gordon and Huber (Reference Gordon2007) and Park (Reference Park2017), especially as elections and filing deadlines draw near (see also Huber and Gordon Reference Huber2004). Furthermore, Brace and Hall (Reference Brace1995) and Canes-Wrone et al. (Reference Canes-Wrone2014) demonstrate that elected state supreme court justices uphold capital sentencing decisions more frequently than justices who are appointed, and those judges do so in direct response to the majority public opinion on the death penalty (see also Brace and Boyea Reference Brace2008; Nelson Reference Nelson2014; Kritzer Reference Kritzer2016). Thus, judicial candidates who must convince the public to vote for them must also demonstrate to the public that they are listening, and responding, to the preferences of the voters.
To recap, the theory of elected punitiveness contends that (1) crime is a salient issue in American politics; (2) the public, on average, prefers punitive, rather than rehabilitative, responses to crime; (3) incarceration rates are responsive to punitiveness in public opinion; and (4) judges who seek their seat on the bench via elections must be responsive to public opinion because (5) they are subject to the same electoral considerations as other politicians, namely the desire to win reelection. Thus, the theory predicts that in jurisdictions where judges are (re)elected, the levels of punitiveness should be higher than in nonelectoral jurisdictions.
I propose two hypotheses to test the theory of elected punitiveness. The first hypothesis draws explicitly from the preceding explanation of the theory.
Elections Hypothesis. States with judicial elections to retain trial court judges will be more punitive than states without judicial reelection.
However, not all judicial elections are alike. This analysis distinguishes between the three broad types of judicial elections in the states: retention, nonpartisan, and partisan elections.Footnote 2 Uncontested retention elections follow appointment of a judge by a governor or legislature. In this arrangement, an incumbent judge, after serving a probationary period of time on the bench following elite appointment, faces the voters. The voters are faced with a yes-no question about whether or not the judge should be retained, and the judge does not face a challenger on the ballot. In states with nonpartisan elections, judicial candidates are proscribed from identifying their party affiliation in campaign communications and the party affiliation is not listed on the ballot. Conversely, in partisan elections, judicial candidates are permitted to run under a party label and do so in practice. While my analyses differentiate between uncontested retention, nonpartisan, and partisan elections, the distinction between partisan and nonpartisan elections has long been one of the most contentious aspects of judicial elections and a focal point of normative debate.
Differences between partisan and nonpartisan elections not only enjoin normative issues, however, but theoretical and empirical issues as well. The theoretical foundation begins with the primacy of party identification in American politics (Bartels Reference Bartels2000). Voters at the individual level are notoriously ill-informed about politics (Campbell et al. Reference Campbell1960; Delli Carpini and Keeter Reference Delli Carpini1996; Lewis-Beck et al. Reference Lewis-Beck2008). Rather than seeking detailed information about candidates and issues in a fairly large number of elections, comparatively speaking, US voters rely heavily on the heuristic of their party identification to select candidates and evaluate issues and performance information (Bartels Reference Bartels2000). Partisan cues are especially important in general election contests in the United States. Like most heuristics, people need at least a modest amount of information to use them in the first place. And like other shortcuts, they can lead to systematic errors in perception and decision-making (Dancey and Sheagley Reference Dancey2013). But at least when partisan cues are available, such as the general election of presidents, voters are able to “vote correctly” about 75% of the time (Lau and Redlawsk Reference Lau1997; Lau, Andersen, and Redlawsk Reference Lau2008). That is, they vote consistent with their own policy preferences. When partisan cues are not available, however, correct voting declines significantly. Of course, this correct voting occurs in an electoral environment marked by both high visibility and, more importantly, the availability of party heuristics.
By definition, nonpartisan elections are void of that critical heuristic for voters. How, then, do uninformed voters make their decision at the ballot box when deprived of a valuable clue as to the candidates’ positions on the issues? Imagine in a counterfactual world a nonpartisan election for president. Surely, because of the high-profile nature of these contests, voters would be able to differentiate between the candidates and still vote “correctly” much, if not most, of the time. However, judicial elections are low-information contests that lack the visibility of high-profile campaigns for other up-ballot offices such as president, Congress, or governor (Klein and Baum Reference Klein2001; Baum Reference Baum2003; Streb Reference Streb2007; Streb and Frederick Reference Streb2009). The combination of low visibility, low information, and lack of a party heuristic creates an environment where voters face exponentially greater informational costs that they are unlikely to pay for such little benefit (Ferejohn and Fiorina Reference Ferejohn1974), resulting in the decision to simply not vote at all (Schaffner, Streb, and Wright Reference Schaffner2001) or choose not to vote on the judicial races (i.e., roll-off; Klein and Baum Reference Klein2001).
How, then, can candidates win an election? The short answer is to campaign. Voters are susceptible to elite appeals (Zaller Reference Zaller1992), including agenda-setting (Abbe et al. Reference Abbe2003), priming (Tesler Reference Tesler2015), and framing (Sides Reference Sides2006), and voters often change their own issue positions to match those of their preferred candidates (Lenz Reference Lenz2012). Specifically, campaigns are able to persuade uninformed voters, especially in the last few days of a campaign (Bartels Reference Bartels2008). And because voters evaluate the past performance of the current administration when making a vote choice (i.e., they vote retrospectively; Fiorina Reference Fiorina1981; see also Becher and Donnelly Reference Becher2013), candidates have an incentive to point to those conditions in their electioneering communications. Indeed, in conditions of nonpartisan elections, candidates have been shown to behave in ways that appear highly partisan, even more so than their nominally partisan contemporaries (Crawford Reference Crawford2018). Judicial candidates, thus, are likely to use campaign communications to appeal to voters’ preferences on important issues. And to make their appeals successful, they must perform in office in a way that is consistent with their case for reelection.
Do nonpartisan judges respond to public opinion more than partisan judges? Canes-Wrone et al. (Reference Canes-Wrone2014, 25) claim that “the literature is inconclusive about which judicial selection system creates the greatest plebiscitary pressure.” However, judicial scholars repeatedly demonstrate that judges selected via nonpartisan elections are often more responsive to electoral pressures than partisan judges. For example, Canes-Wrone et al. (Reference Canes-Wrone2014) report that state supreme court justices elected via nonpartisan elections uphold death penalty cases more frequently than do justices who are selected via other institutions, including partisan elections, independent of a host of control variables. They show that state supreme court justices elected on a nonpartisan ballot are more likely to uphold capital sentences in response to state-level majority public opinion on the death penalty.
More generally, research also finds that jurists selected in nonpartisan contests are more responsive to public opinion in other policy areas, especially when the policy area is publicly salient (Choi, Gulati, and Posner Reference Choi2010), as is true of issues related to crime.Footnote 3 For example, over a nearly 30-year period (1980–2006), state supreme court justices selected via nonpartisan ballots were more responsive to state public opinion on abortion than judges selected via other institutional arrangements (Caldarone et al. Reference Caldarone2009; see also Canes-Wrone et al. Reference Canes-Wrone2012; Crawford Reference Crawford2018). Using public opinion on abortion that was pooled within states over a decade, Caldarone et al. (Reference Caldarone2009) report that as the share of the electorate supporting abortion increased across states, so also did proabortion judicial rulings; conversely, as the electorate became more pro-life, judges issued more pro-life rulings, even controlling for the judges’ party affiliation, election proximity, and case facts. Thus, recent scholarship clearly documents a strong relationship between nonpartisan elections and judicial decision-making on salient issues like crime.
Party identification is often the most powerful decision-making heuristic for American voters in general elections (Campbell et al. Reference Campbell1960; Lewis-Beck et al. Reference Lewis-Beck2008). Thus, when the party label of the candidates is clear in partisan judicial races, it is possible for many judges to fly under the radar by being somewhat more or less punitive in practice while relying on a partisan cue to communicate to voters that they are in alignment with public opinion on crime. However, when institutional arrangements prohibit the use of that heuristic, as in the case of nonpartisan elections, judicial candidates in states with punitive electorates are likely to behave on the bench in a way that is responsive to the perceived attitudes of the public in their state. Judges’ actions on the bench provide them with an instant campaign message that gives voters a retrospective accounting of the judge’s responsiveness on the bench and a strong case for reelection. Again, this responsiveness is an average response. Thus, I offer the
Nonpartisan Elections Hypothesis. States with judges reelected in nonpartisan elections will be more punitive than states with partisan judicial reelections.
Data and Methods
I use the National Prisoner Statistics, 1978–2015 (NPS) data set to test these hypotheses. The NPS is an annual census of state prison systems conducted by the US Department of Justice. The data set is an annual census of state prison systems, including the number of inmates incarcerated in the system, numbers that are further reported by inmate race, sex, health condition, and so forth, and the number of newly admitted prisoners in a given year. The data set has been widely used in a number of academic disciplines, including criminology and public health. However, as far as I can determine, this data set has not been used in state courts research, making this study the first use of this data set in the field.
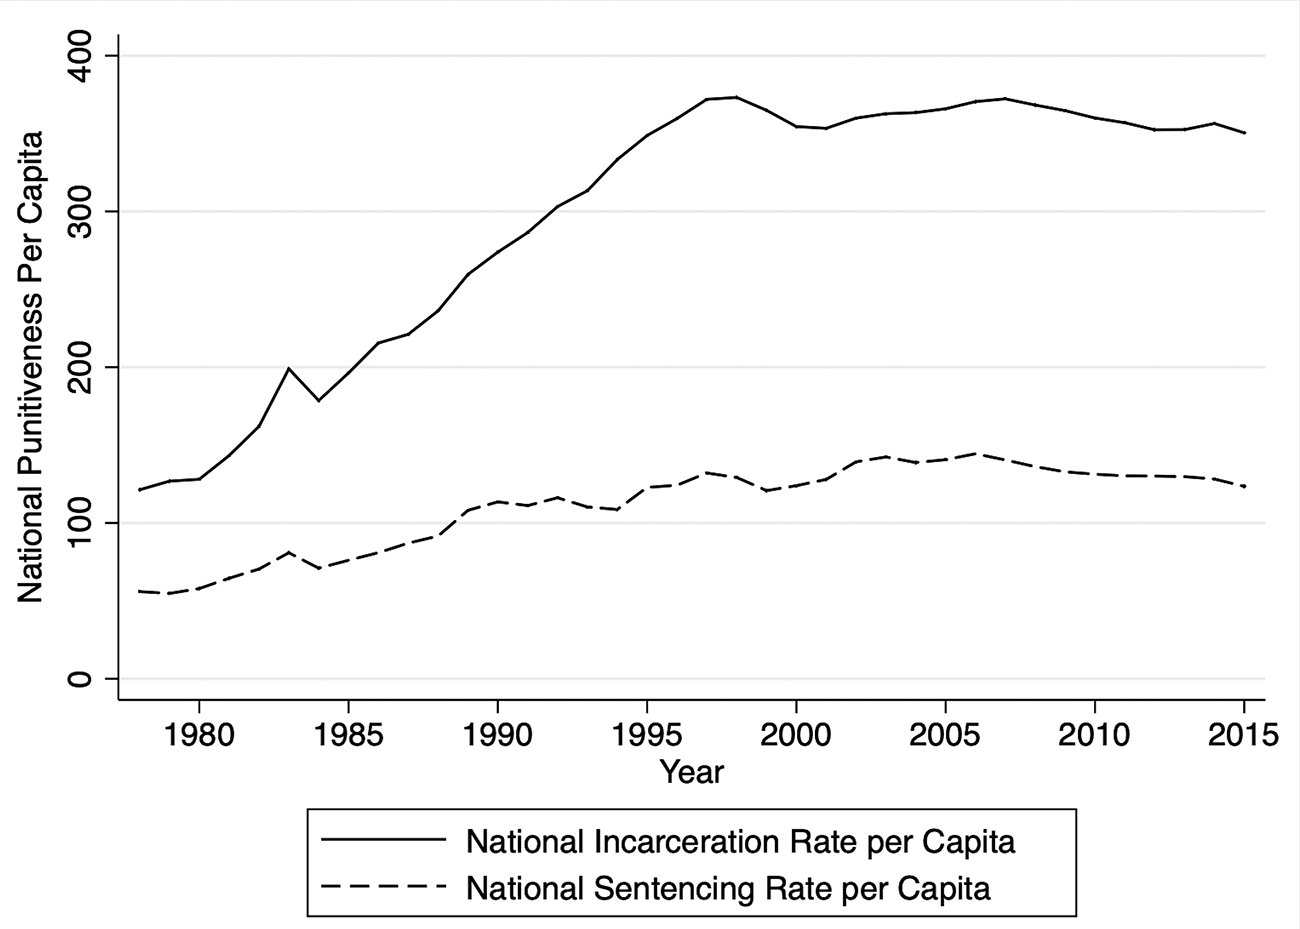
Incarceration rates are correlated to punitive attitudes of the public (Enns Reference Enns2014, Reference Enns2016; Jennings et al. Reference Jennings2017), making the use of a state’s incarceration rate an empirically important measure for understanding the judicial system’s likely responsiveness to public opinion. Incarceration, of course, results from criminal sentencing. Thus, incarceration rates are an indirect measure of judicial behavior. Sentencing rates are a more direct measure.Footnote 4 Figure 1 shows the national level of sentencing per capita and the resulting incarceration per capita by year.
Annual national trends in sentencing and incarceration rates per 100,000

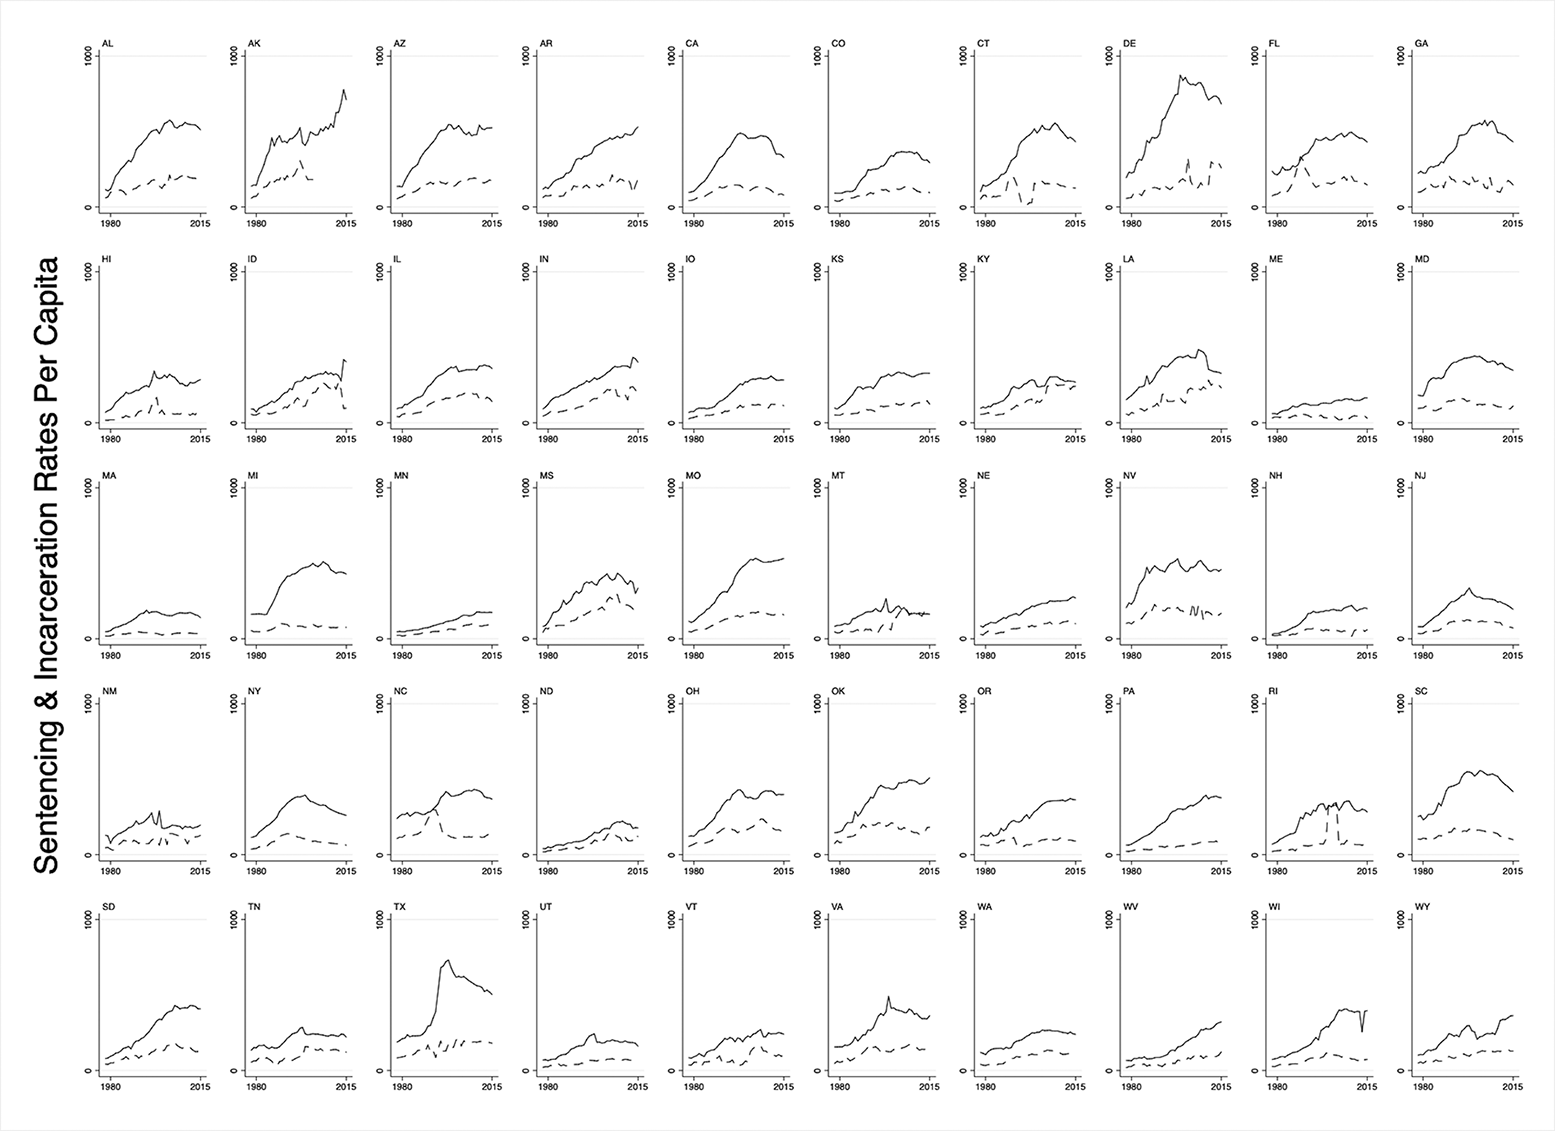
Aggregate national-level trends can obscure stark differences between states, however. States are an important unit of analysis because, as previously discussed, this is where the vast majority of criminal justice is carried out. In other words, states sentence and incarcerate criminal defendants, and the levels vary by state. Figure 2 thus displays the yearly trend in sentencing and incarceration rates for each state.
Annual trends in sentencing and incarceration rates, by state. States are displayed in alphabetical order. The horizontal axis represents the year (1978–2015), and the vertical axis is the state’s sentencing and incarceration rates per 100,000 population; all vertical axes are scaled from 1 to 1,000 for direct comparability.

Figures 1 and 2 demonstrate that although the level of incarceration nationally changes yearly, the level is nonstationary in some of the states.Footnote 5 As such, it is necessary to account for this lack of stationarity in the variable construction. Absolute levels of sentencing and incarceration that are not stationary are likely to lead to results that are spurious rather than true. In other words, they are likely to cause a type I error. To overcome this possibility, I use first-differenced levels as my dependent variables (Enns Reference Enns2016). That is, the outcome of interest in each state year, Y
it
, is the change in sentencing and incarceration rates from the previous year,
 .Footnote 6 The dependent variables are thus ΔSentencing Rate and ΔIncarceration Rate.
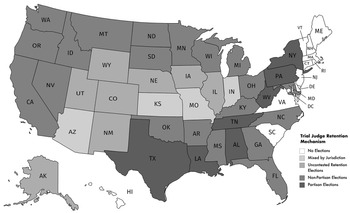
A series of indicator variables serve as the regressors of interest. Each variable is coded so that states where judges do not face election to retain their seat on the bench are the reference category (coded 0). States with Uncontested Retention Elections, Nonpartisan Elections, and Partisan Elections are coded 1 in each respective variable. Goelzhauser (Reference Goelzhauser2018) advises to distinguish between retention methods (i.e., how judges retain their seat on the bench) and selection methods (i.e., the mechanism by which judges are first seated; see also Goelzhauser Reference Goelzhauser2016; Kritzer Reference Kritzer2016). I use the retention method in my empirical analysis because my theory posits that it is the appeal to the public’s attitudes in a future election that should concern a trial judge. Thus, incumbents may alter their behavior on the bench knowing they must face the voters to remain a judge. Data for retention methods comes from the National Center for State Courts (2018). Figure 3 displays the method for each state as of 2015, the final year in the NPS data set.Footnote 7
Judicial retention mechanisms by state, trial court level, 2015. Judicial selection mechanisms indicated are for the mechanism employed by the state in 2015. Six states (Arkansas, Georgia, Mississippi, New Mexico, North Carolina, and Utah) changed the retention mechanism at various points in the time series under analysis. Four states labeled “Mixed by Jurisdiction” employ different selection mechanisms in different jurisdictions, usually at the county or judicial district, within the state. These four states are coded as missing in the data set. Data are from the National Center for State Courts, available at http://judicialselection.us/judicial_selection/methods/selection_of_judges.cfm?state=. Map created with the free tool at https://mapchart.net/usa.html.

In addition to the impact of judicial elections on state punitiveness, I am interested in the effect of public opinion. Prior studies have shown that public opinion (Enns Reference Enns2014, Reference Enns2016), especially the ideological composition of the electorate (Percival Reference Percival2010), has an impact on incarceration rates. I use the Berry et al. (Reference Berry2010) measure of citizen ideology, a continuous variable ranging from 0 to 1, with lower values indicating more conservative electorates and higher values associated with more liberal electorates. Enns (Reference Enns2016, 140) reports that a three-year lag in public opinion provides the best fit when modeling the relationship between public opinion and incarceration, although his results are not dependent on the length of the lag between one and four years. Consistent with Enns’s (Reference Enns2016) best fit, I lag the measure of public mood by three years.Footnote 8 I call this variable Citizen Liberalism t−3. Additionally, in the full models, a multiplicative term between the retention method and Citizen Liberalism t−3 is included to demonstrate the conditioning effect of public opinion on electoral institutions.
I include controls for a number of factors that either have been demonstrated to, or potentially could a priori, affect incarceration rates. A state’s legal climate at various stages should impact the punitiveness of outcomes. After a crime has been committed or alleged, police must make an arrest. Thus, the Arrest Rate at time t − 1 should impact how many defendants are sentenced and the resulting prison population, so I control for it.
Hall and Windett (Reference Hall2015) demonstrate that judicial influence over incarceration rates is higher in states that do not have an intermediate appellate court (IAC). I capture the states without an IAC with an indicator variable, No IAC, which takes a value of 1 if the state does not have an IAC and 0 otherwise.Footnote 9
Additionally, several legal instruments that constrain judicial behavior could impact sentencing and incarceration. States with determinant sentencing laws (DSL), which require inmates to serve the entirety of their sentence, are captured with an indicator variable of the same name. I measure Mandatory Minimums with a count variable for the number of offense categories for which a state has mandatory minimums. States with a Sentencing Commission are identified with a dummy variable that takes a value of 1 in states with a commission and 0 otherwise.
Criminal justice policy takes place in an inherently political environment (Brace and Hall Reference Brace1995; Yates and Fording Reference Yates2005; Gottschalk Reference Gottschalk2009; Boldt and Boyd Reference Boldt2018; Fording Reference Fording2018; but see Ewald Reference Ewald2012), and the partisan composition of government (Smith Reference Smith2004) has an effect on incarceration rates. Thus, I control for government ideology with Government Liberalism, the state government NOMINATE score developed by Berry et al. (Reference Berry2010).
Hall and Windett (Reference Hall2015) argue that judicial influence over incarceration rates is higher under conditions of divided government. I measure Divided Government with an indicator variable taking a value of 0 if the governorship and both chambers of the legislature are controlled by the same political party (i.e., unified government) and 1 otherwise.
Elected prosecutors are, for the same reasons as elected judges, likely more responsive to the same political forces as elected judges when it comes to criminal justice matters than unelected prosecutors. First, previous research has demonstrated that elected prosecutors are responsive to public opinion (Wright Reference Wright2012). For example, Nelson (Reference Nelson2014) demonstrates that, following a public referendum on the legalization of marijuana, prosecutors in Colorado were more lenient on marijuana possession defendants in localities with higher levels of support for the referendum. Second, prosecutors alter their behavior with respect to plea bargaining when electoral considerations are relevant. For example, Bandyopadhyay and McCannon (Reference Bandyopadhyay2014) demonstrate that elected prosecutors in North Carolina were more likely to take a case to trial (and, relatedly, less likely to plea-bargain with defendants) in an election year, an effect that was greater if the prosecutor was facing a challenger (McCannon Reference McCannon2013; Bandyopadhyay and McCannon Reference Bandyopadhyay2015). However, not all states elect their chief prosecutors (Coppolo Reference Coppolo2003). To capture this variation and the consequences it likely produces, I include an indicator variable, Elected Prosecutor, that takes a value of 1 if the state elects its chief prosecutor and 0 otherwise.
Beside the presence or absence of judicial elections, other political features of state judiciaries might also account for the variation in judicial behavior that produces greater punitive policy outcomes. The amount of time remaining in a judge’s term has been shown to influence their behavior (Huber and Gordon Reference Huber2004), with judges handing down longer sentences in election years than in nonelection years. However, the many judges facing reelection in the states are often elected at different times. While the length of time before the election would capture this important variation at the judge level, it is unfortunately unavailable at the state level. However, a suitable proxy measure exists. Regardless of when a judge is selected, there is a set number of years until their next election, and that interval is the same for all trial judges across the state. To account for the temporal nature of judicial terms, I control for Judicial Term Length, expecting that as the term length increases, thus providing more independence from the public, punitive outcomes should decrease.
On the other hand, judges might be responsive in the middle of their terms if the public can recall them. Similar to opposition to judicial elections, judicial recall was a reform promoted by progressives, and similar to reforms such as nonpartisan elections and merit plans, it was a reform that was slow to catch on (Shugerman Reference Shugerman2012). Some states permit voters to recall judges via popular referenda, while others do not. To account for this alternative political threat, I use a dummy variable, Recall, that takes the value of 1 if the state permits judicial recall by voters and 0 otherwise.
Because of the South’s special history of punitiveness, southern states are identified by the indicator variable, South (Valentino and Sears Reference Valentino2005). Black Population measures the percentage of the population in the state that is Black, and because I expect a curvilinear effect, I include Black Population2. Bachelors Degrees measures the percent of a state’s population with a bachelors degree or higher. Finally, I control for State
 to account for the economic conditions that shape punitiveness (Rosenfeld and Fornango Reference Rosenfeld2007; Rosenfeld Reference Rosenfeld2009; National Research Council 2014).
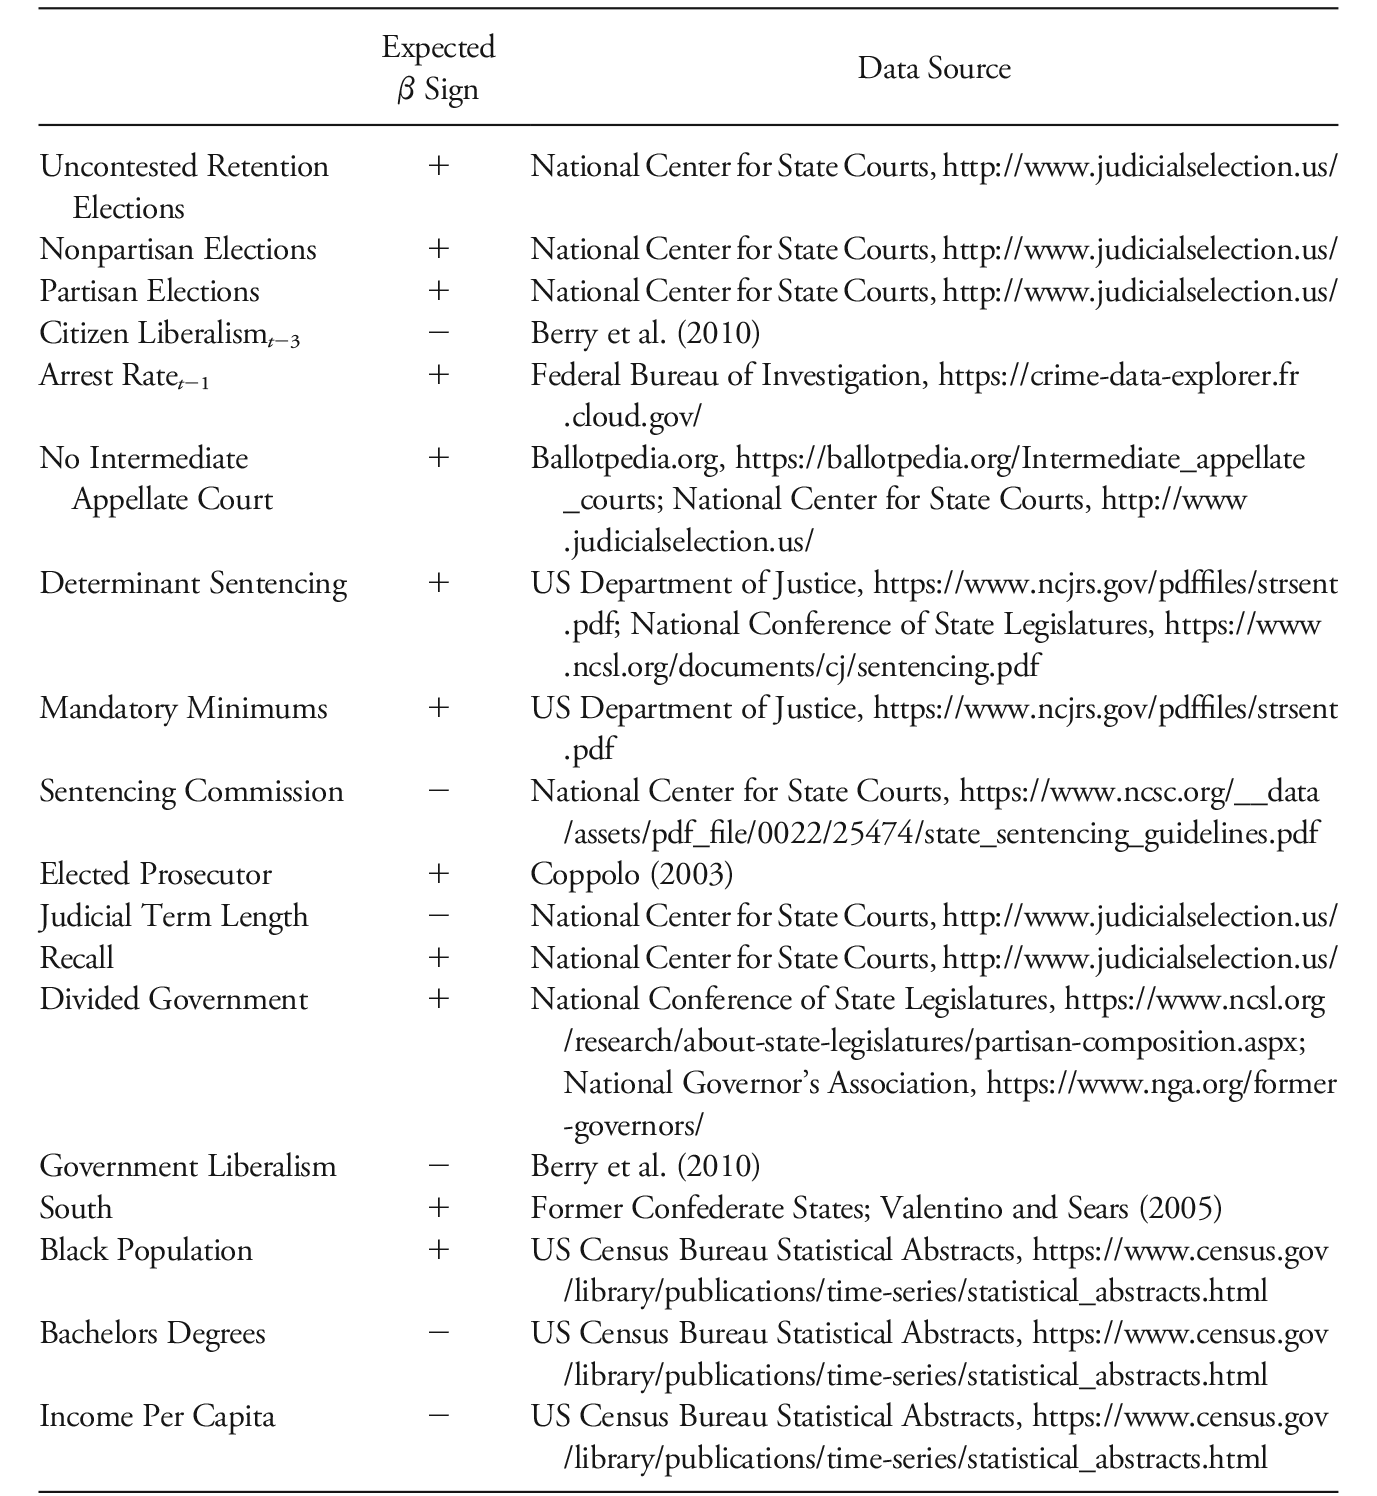
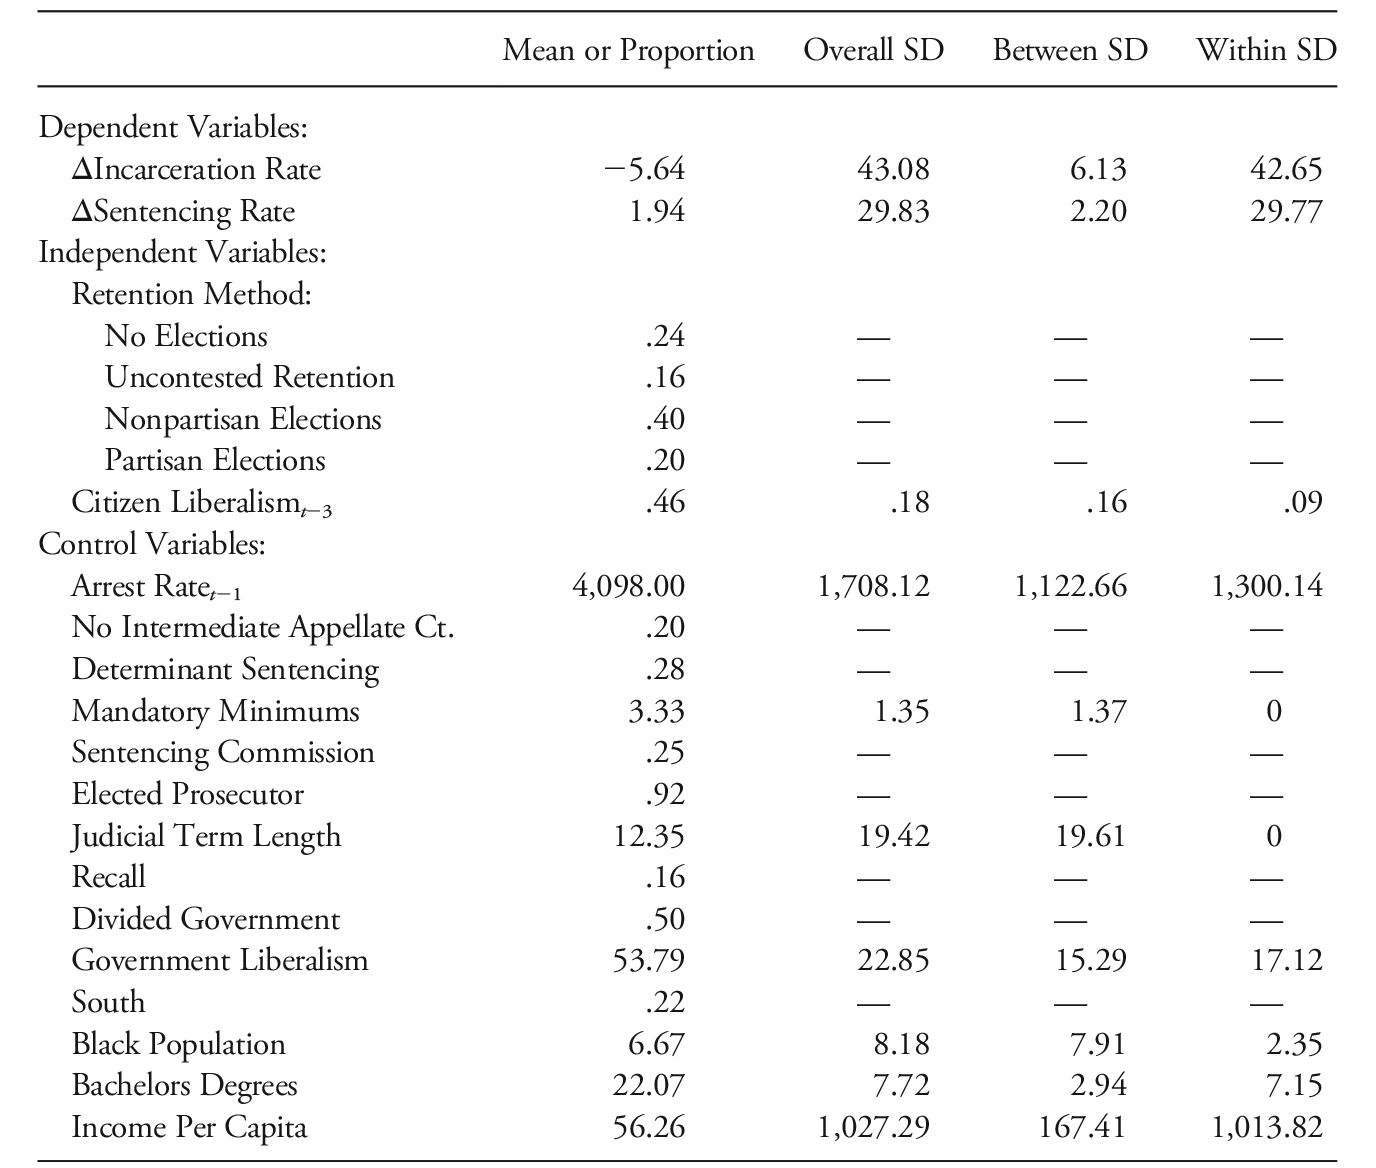
Table 1 lists these regressors along with my expectation for the coefficient on each variable and the source of the data, while table 2 provides descriptive statistics for each variable.Footnote 10 I estimate the relationship between the retention methods and the two dependent variables using linear regression models: ΔIncarceration Rate and ΔSentencing Rate are normally distributed and continuous, making linear regression appropriate. However, OLS is not appropriate for TCSC data due to concerns about autocorrelation and heteroskedasticity. To correct for these problems arising from the use of TCSC data, I employ panel-corrected standard errors (PCSE; Beck and Katz Reference Beck1995) and panel-specific autocorrelation corrections AR(1), pairwise selection sigma computation, and a lagged dependent variable. The results reported below are robust to most alternative modeling decisions.Footnote 11 The unit of analysis in each model is the state-year.
Independent and Control Variable Expectations and Data Sources

Descriptive Statistics

Results
Incarceration Rates
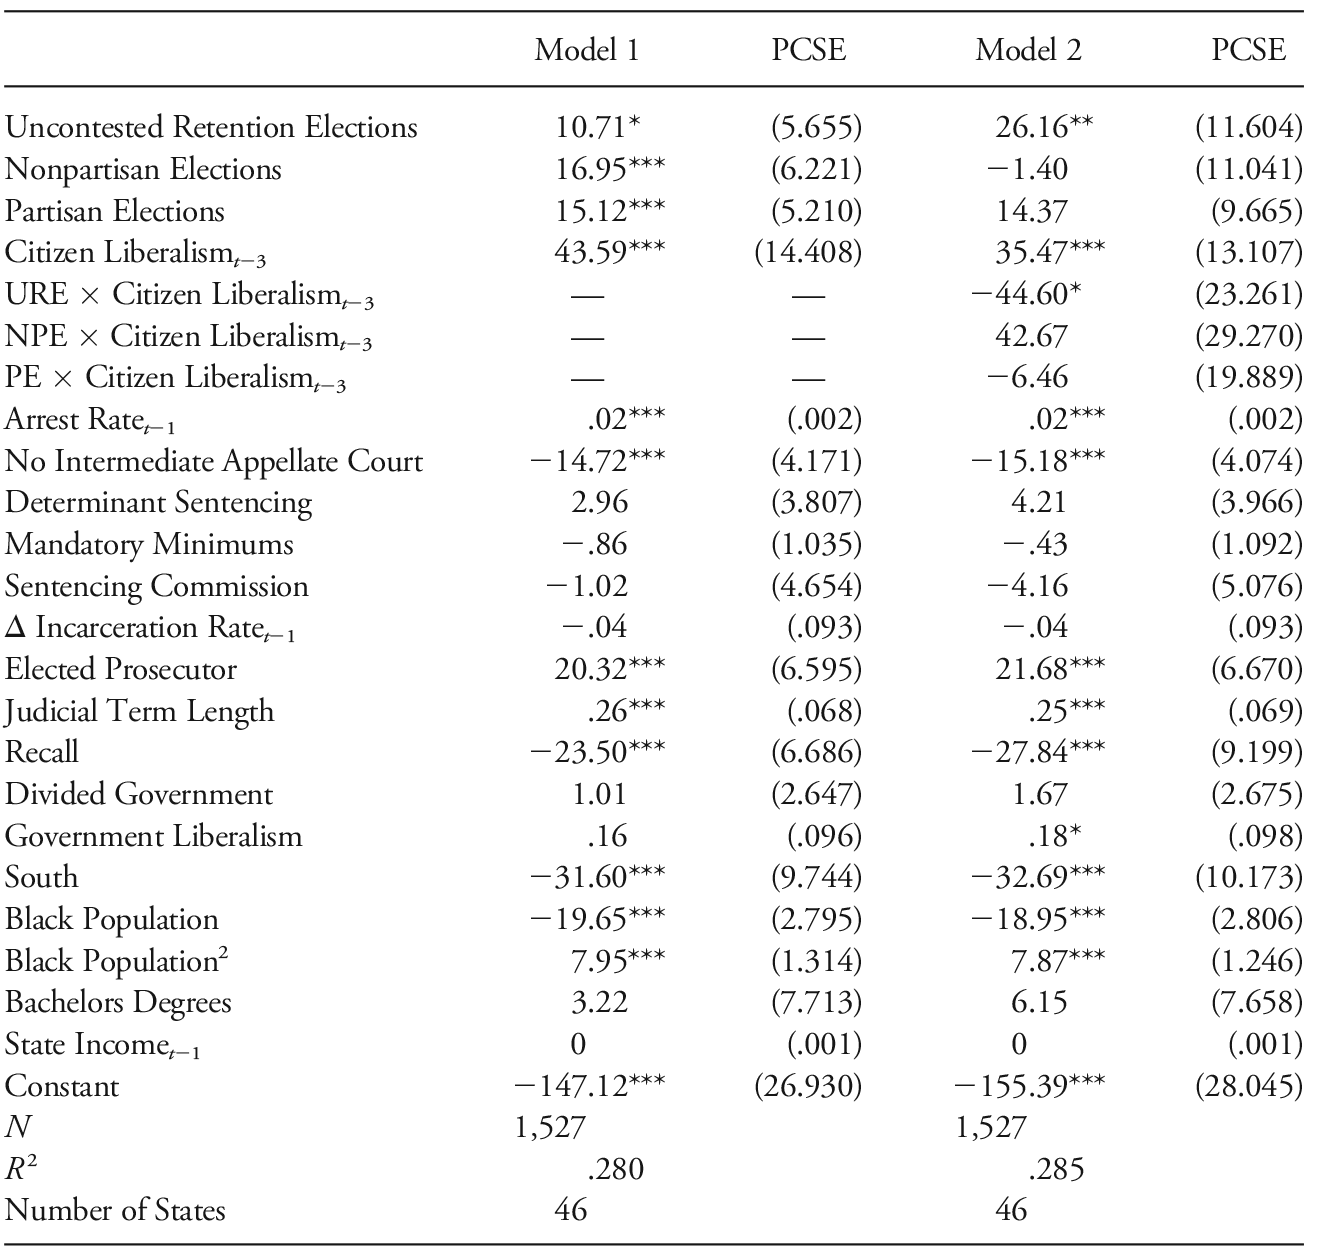
Focusing first on the incarceration rate, table 3 reports the results of the regression analyses. The Elections Hypothesis predicted that states with elections to retain trial judges would be more punitive than states without elections. Results of the empirical analysis in model 1, reported in table 3, have positively signed and statistically significant coefficients for each retention method, indicating that elections increase the state’s level of incarceration. However, contrary to expectations, as liberalism among the citizenry increases, so does the incarceration rate.
Antecedents of State Incarceration Rate

Note.—All models estimated using Stata 15.0’s xtpcse command. Data from National Prisoner Statistics, 1978–2015, US Department of Justice, ICPSR Study 36657. Dependent variable is a state’s incarceration rate per 100,000 population, first-differenced. Panel-corrected standard errors in parentheses. Autocorrelation corrected using panel-specific AR(1). Unit of analysis is the state-year. URE = Uncontested Retention Elections. NPE = Nonpartisan Elections. PE = Partisan Elections. Two-tailed significance tests.
* p < .1.
** p < .05.
*** p < .01.
Turning to the control variables, as expected, the arrest rate in the previous year increases the rate of incarceration. Curiously, the absence of an intermediate appellate court decreases the incarceration rate. This result conflicts with previous research and is worth further exploration in future research. Beyond that, the legal climate and legal constraints on judicial decision-making are unassociated with incarceration rates. DSL, mandatory minimums, and sentencing guidelines have no statistically significant relationship with a state’s incarceration rate.
Consistent with previous research on the political antecedents of state criminal justice policy, I find that political structure matters, but not always in the expected way. States where prosecutors are elected have significantly higher incarceration rates than where prosecutors are appointed. Longer judicial terms do not seem to shield judges from the whims of the public. As the length of a judge’s term lengthens, incarceration rates rise. Likewise, recall elections do not perform as expected; where judicial recall is permitted, incarceration rates are significantly lower. Clearly, institutions designed to protect judges from public opinion (longer term length) or to make them more accountable to it (recall elections) are not living up to their promises.
Southern states have significantly lower levels of incarceration, a curious finding that warrants further exploration in future research. As expected, a curvilinear relationship is present between Black population and incarceration rates. As the Black population increases, incarceration rates initially decline before increasing again. Education and income are unassociated with incarceration rates.
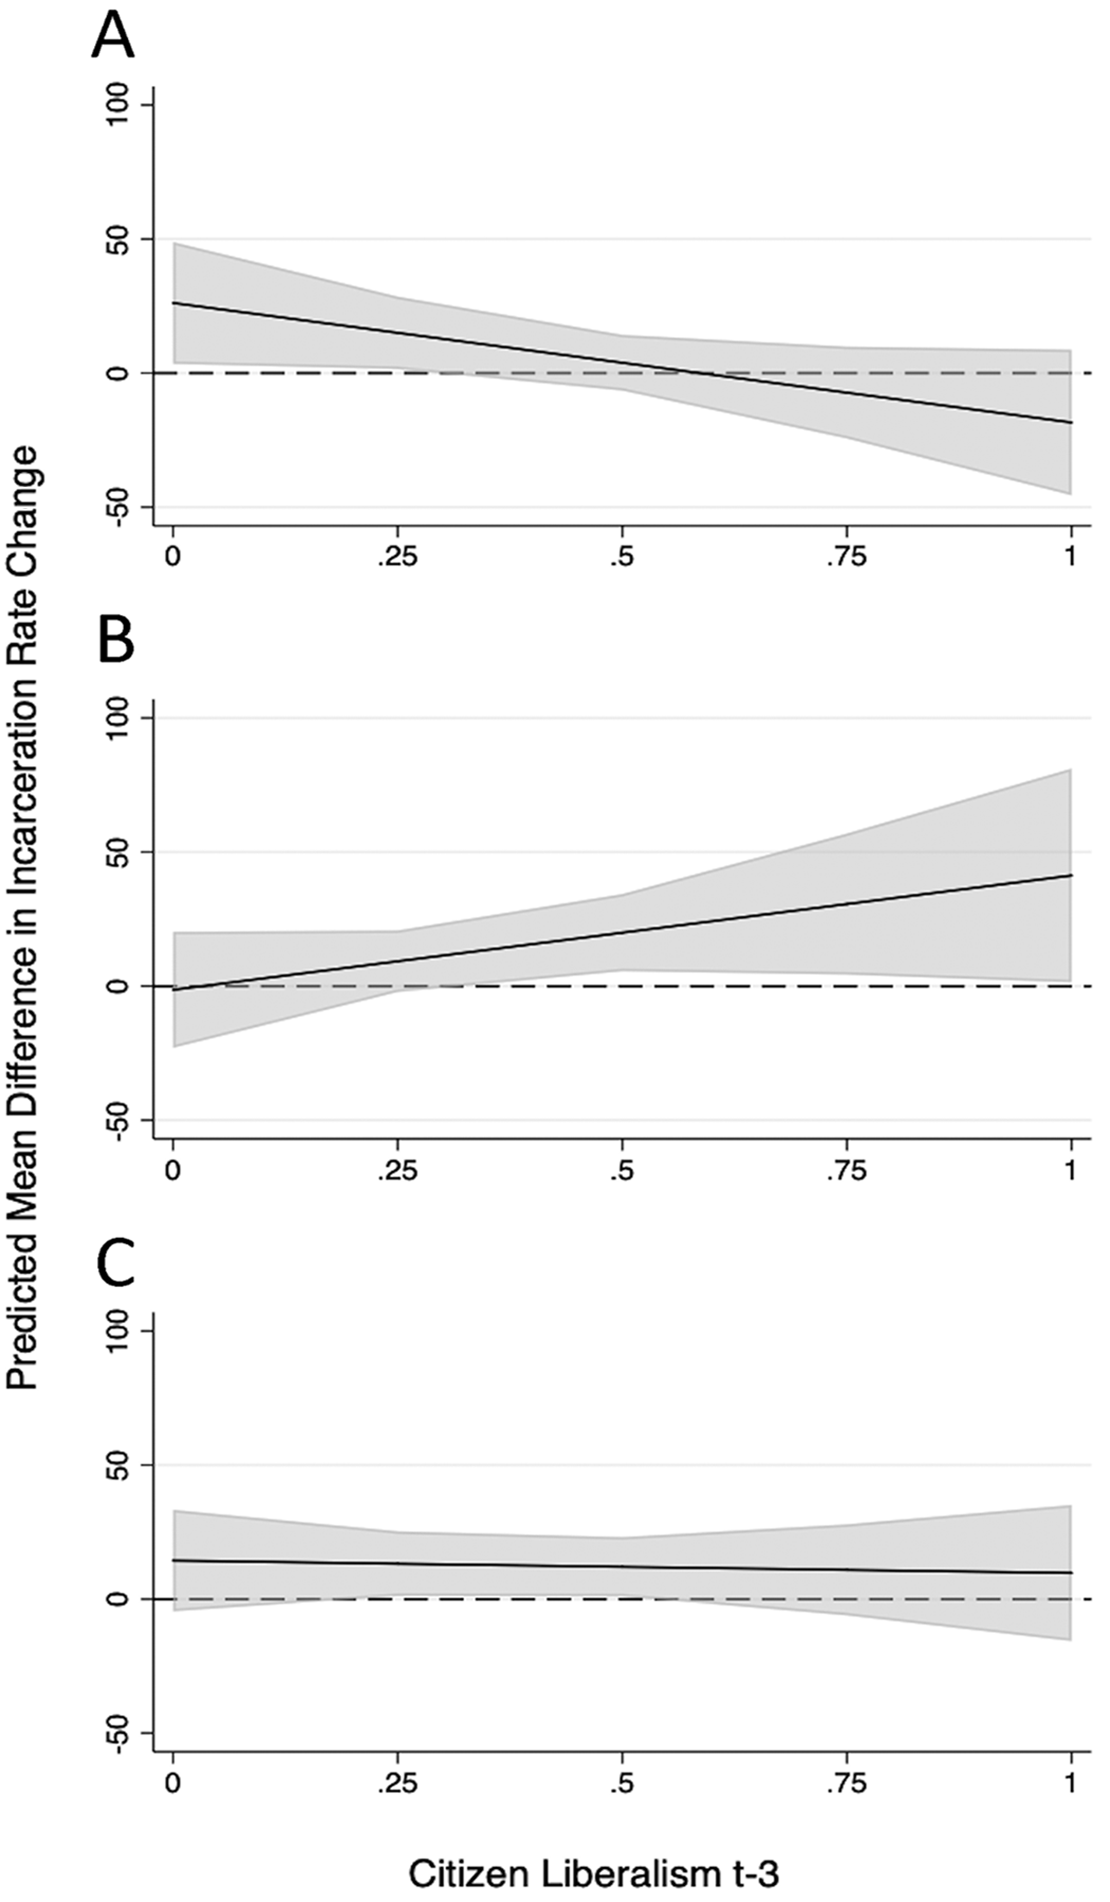
In model 2, which tests the interaction between retention method and public opinion, some of the variables of interest are statistically significant, indicating there is some difference between electoral states and that public opinion conditions the effect of the institutional arrangement. However, because the model includes the interactive effects to investigate the conditioning effect of ideology, the effects are difficult to interpret from coefficients (Brambor, Clark, and Golder Reference Brambor2006). Figure 4, therefore, reports the marginal contrasts of retention mechanisms across the ideology range by displaying the conditioning effects of ideology on the retention mechanism.
Contrasts of retention mechanisms, incarceration rates. Horizontal lines at
 indicate the baseline effect held constant, while the sloped lines indicate the effect of the retention mechanism contrasted with the baseline at a given level of ideology with 95% confidence intervals. In each panel’s title, the contrasted mechanism is listed first and the baseline category is listed second: A, uncontested retention elections versus no elections; B, nonpartisan elections versus no elections; C, partisan elections versus no elections. Contrast statistics and levels of significance are based on model 2. Statistics are listed in the appendix.

In more conservative states (i.e., at the left end of the horizontal axis), uncontested retention elections (fig. 4A
) are associated with significantly greater incarceration than equally conservative states without elections, indicating a degree of policy responsiveness of elected jurists. Furthermore, consistent with a level of policy responsiveness, as Citizen Liberalism increases, incarceration rates decline in states with uncontested retention elections. When Citizen
 , the difference between electoral types is no longer significant. Thus, in the most conservative states at least, uncontested retention elections are associated with greater incarceration and more responsiveness to public opinion. In more liberal states, there is no significant effect of elections on incarceration.
Nonpartisan elections (fig. 4B ), on the other hand, are associated with greater incarceration in more liberal states, and as liberalism increases, incarceration rates also rise. Although some might interpret this result as a countermajoritarian feature of the courts, it also provides evidence in support of my hypotheses that elected judges are contributing to mass incarceration and that nonpartisan elections are creating an environment where judges must be more punitive than their partisan counterparts to overcome the lack of the partisan heuristic on the ballot.
Partisan elections (fig. 4C ) are also associated with higher incarceration, consistent with the Elections Hypothesis, but the difference is only significant for a small range of Citizen Liberalism, from 0.20 to 0.55. Moreover, along that range of ideology, as a state becomes more liberal, incarceration declines, indicating policy responsiveness by elected judges that is not present for nonelected judges.
The consistent lesson from figure 4 is that states with elections to retain trial judges are associated, in some instances, with greater incarceration rates than states without elections. Regardless of the electoral mechanism in place, elections are associated with higher incarceration rates. This finding is consistent with the Elections Hypothesis. However, the effect of elections in producing higher incarceration rates and policy responsiveness is inconsistent. Uncontested retention elections and partisan elections produce greater policy responsiveness—as liberalism rises, incarceration rates decline. Nonpartisan elections, as my theory would predict, have an inverse relationship with policy preferences—as liberalism rises, incarceration rates rise. The absence of a partisan heuristic clearly encourages greater punitiveness among judges, even when the public may not prefer such a response to crime.
One final note to make from figure 4 is the difference between retention mechanisms. I will momentarily explore in greater detail the differences between partisan and nonpartisan elections, but the difference between uncontested retention elections and partisan elections is worth a quick note. In more conservative states, the point estimate for uncontested retention elections is much higher than the estimate for partisan elections. When Citizen
 , a point where the contrast statistic for both mechanisms is significant, the estimated difference for uncontested retention elections is 17.69, while the contrast for partisan elections is 13.49. Clearly uncontested retention elections are associated with higher (31% higher) incarceration rates than partisan elections.
Recall that the Nonpartisan Elections Hypothesis predicts that—because voters are deprived of the party heuristic in campaigning and on the ballot, judges must be more punitive to send a signal on which voters can vote retrospectively—states with nonpartisan elections will be more punitive than states with partisan elections. The coefficients in model 1 indicate that this is the case. The coefficient for Nonpartisan Elections is 16.95, while the coefficient for Partisan Elections is lower at 15.12, indicating that states with nonpartisan elections incarcerate nearly two (1.83) more inmates per year on average than states with partisan elections. This finding is consistent with the Nonpartisan Elections Hypothesis.
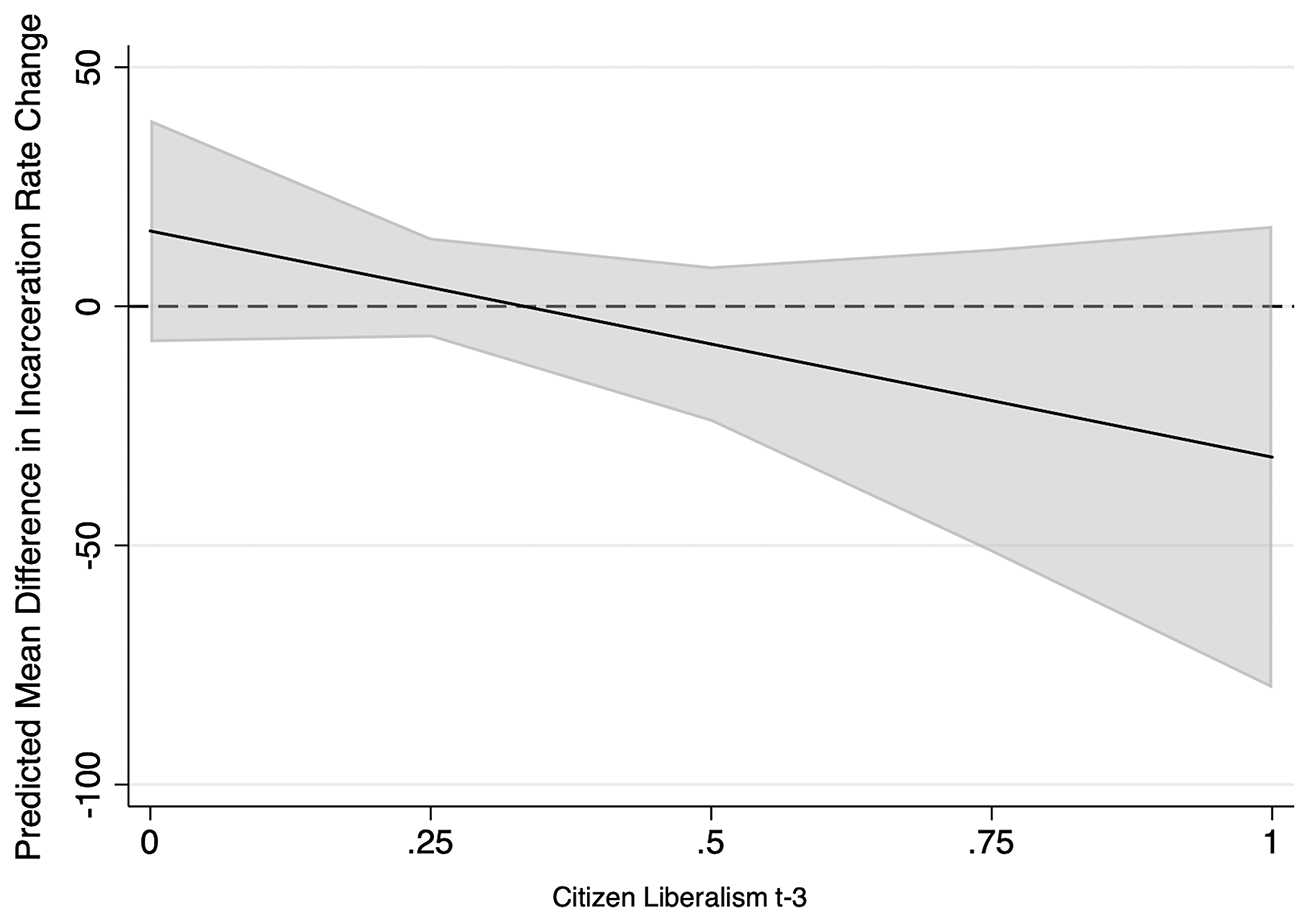
However, the question is whether this finding is conditional on public liberalism, and figure 5 seems to indicate that it is not. Along the range of ideology on the X-axis in figure 5, nonpartisan elections and partisan elections are statistically indistinguishable. While there is a statistical difference between nonpartisan and partisan election states in terms of their incarceration rates, that difference is irrespective of the level of citizen liberalism.Footnote 12 Thus, determining differences in policy responsiveness between the two mechanisms is not possible.
Contrasts of retention mechanisms, incarceration rates. Horizontal line at
indicates the baseline effect of nonpartisan elections held constant, while the sloped line indicates the effect of partisan elections contrasted with the baseline at a given level of ideology with 95% confidence intervals. Contrast statistics and levels of significance are based on model 2. Statistics are listed in the appendix.

Sentencing Rates
In the previous section of results, I established that elections play a role in criminal justice policy. Conditional on public ideology, elections are associated with higher levels of incarceration. And nonpartisan elections are associated with higher incarceration than partisan elections, irrespective of the level of public liberalism. I turn in this section to exploring the effects of elections and public liberalism on sentencing rates, a measure of punitiveness that is more directly related to the activity of trial judges.
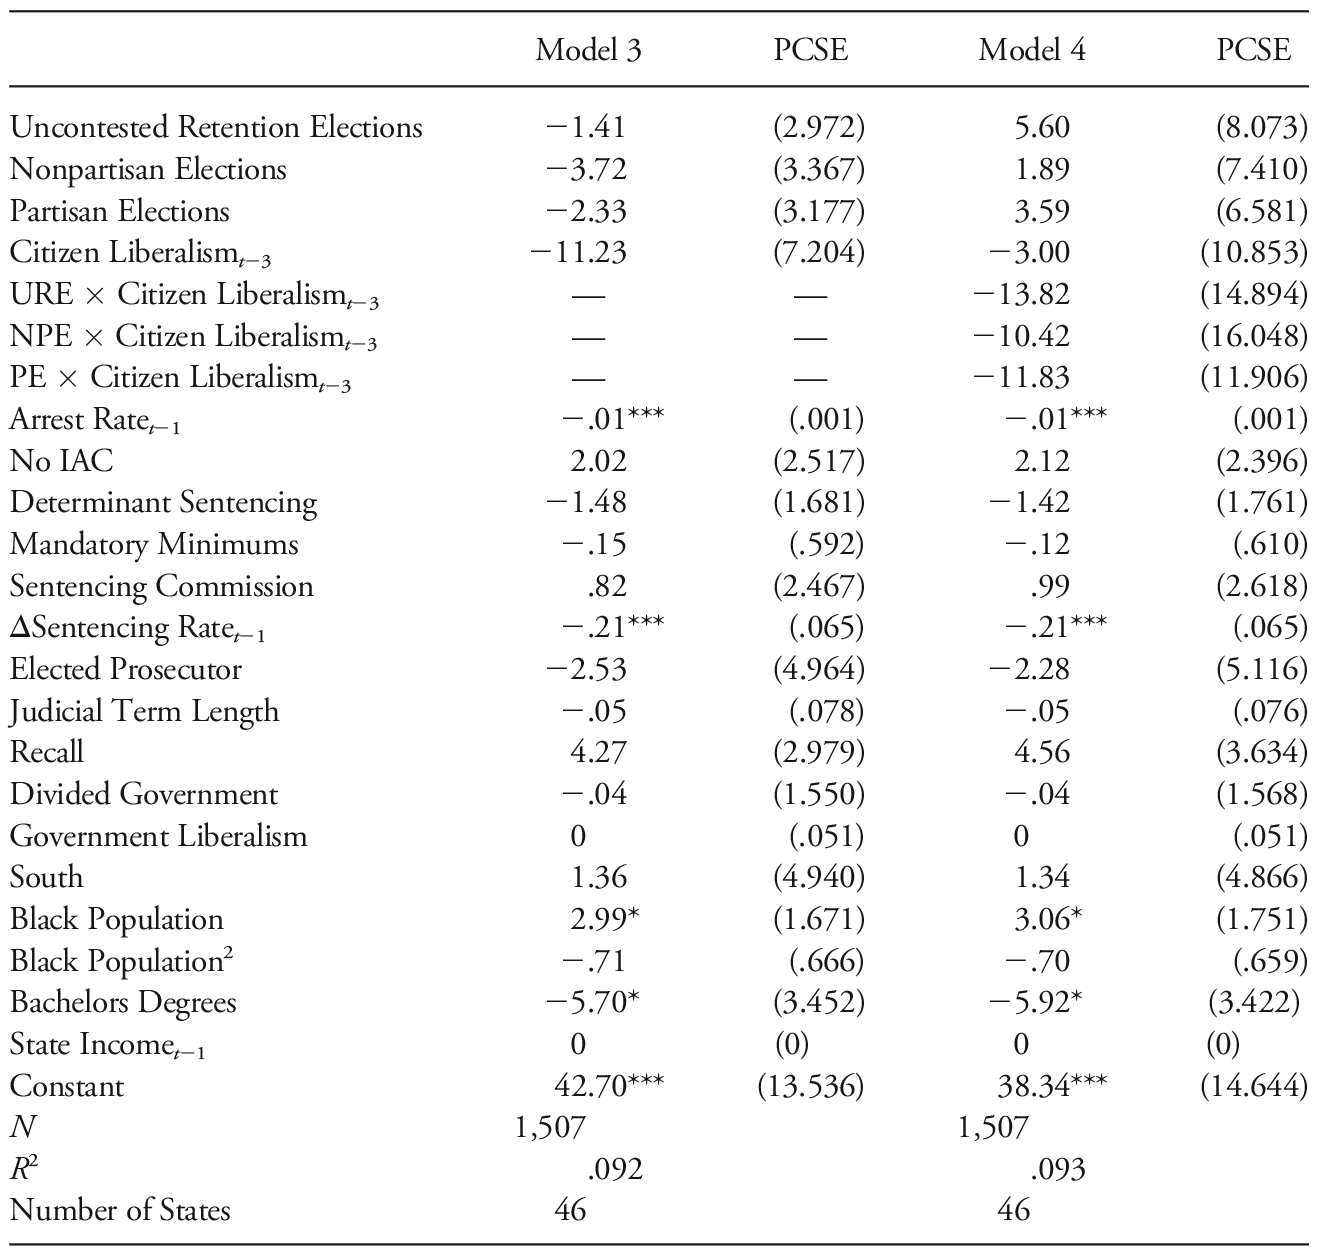
Model 3 in table 4 indicates that neither elections nor mass ideology has any impact on sentencing rates in the states. Indeed, only a handful of control variables have a significant relationship with sentencing. The Arrest Rate in the previous year predicts a small but significant decrease in the change in sentencing rates, and the negative and significant coefficient on the lagged dependent variable indicates an integrated and correcting serial relationship. An increase in Black Population is associated with a significantly higher sentencing rate: approximately three additional defendants, on average, are sentenced to prison for every 1% increase in Black Population. Unlike with the incarceration rate, no curvilinear relationship exists between Black Population and the rate of sentencing. As predicted, an increase of 1% in the proportion of the population holding a bachelors degree predicts a significant decline of nearly six inmates, on average. While the model is jointly significant (
 ,
 ), it holds little explanatory power, explaining less than 10% of the variation of the sentencing rate, and very few of the independent or control variables are significant.
Antecedents of State Sentencing Rate

Note.—All models estimated using Stata 15.0’s xtpcse command. Data from National Prisoner Statistics, 1978–2015, US Department of Justice, ICPSR Study 36657. Dependent variable is a state’s sentencing rate per 100,000 population, first-differenced. Panel-corrected standard errors in parentheses. Autocorrelation corrected using panel-specific AR(1). Unit of analysis is the state-year. URE = Uncontested Retention Elections. NPE = Nonpartisan Elections. PE = Partisan Elections. Two-tailed significance tests.
* p < .1.
** p < .05.
*** p < .01.
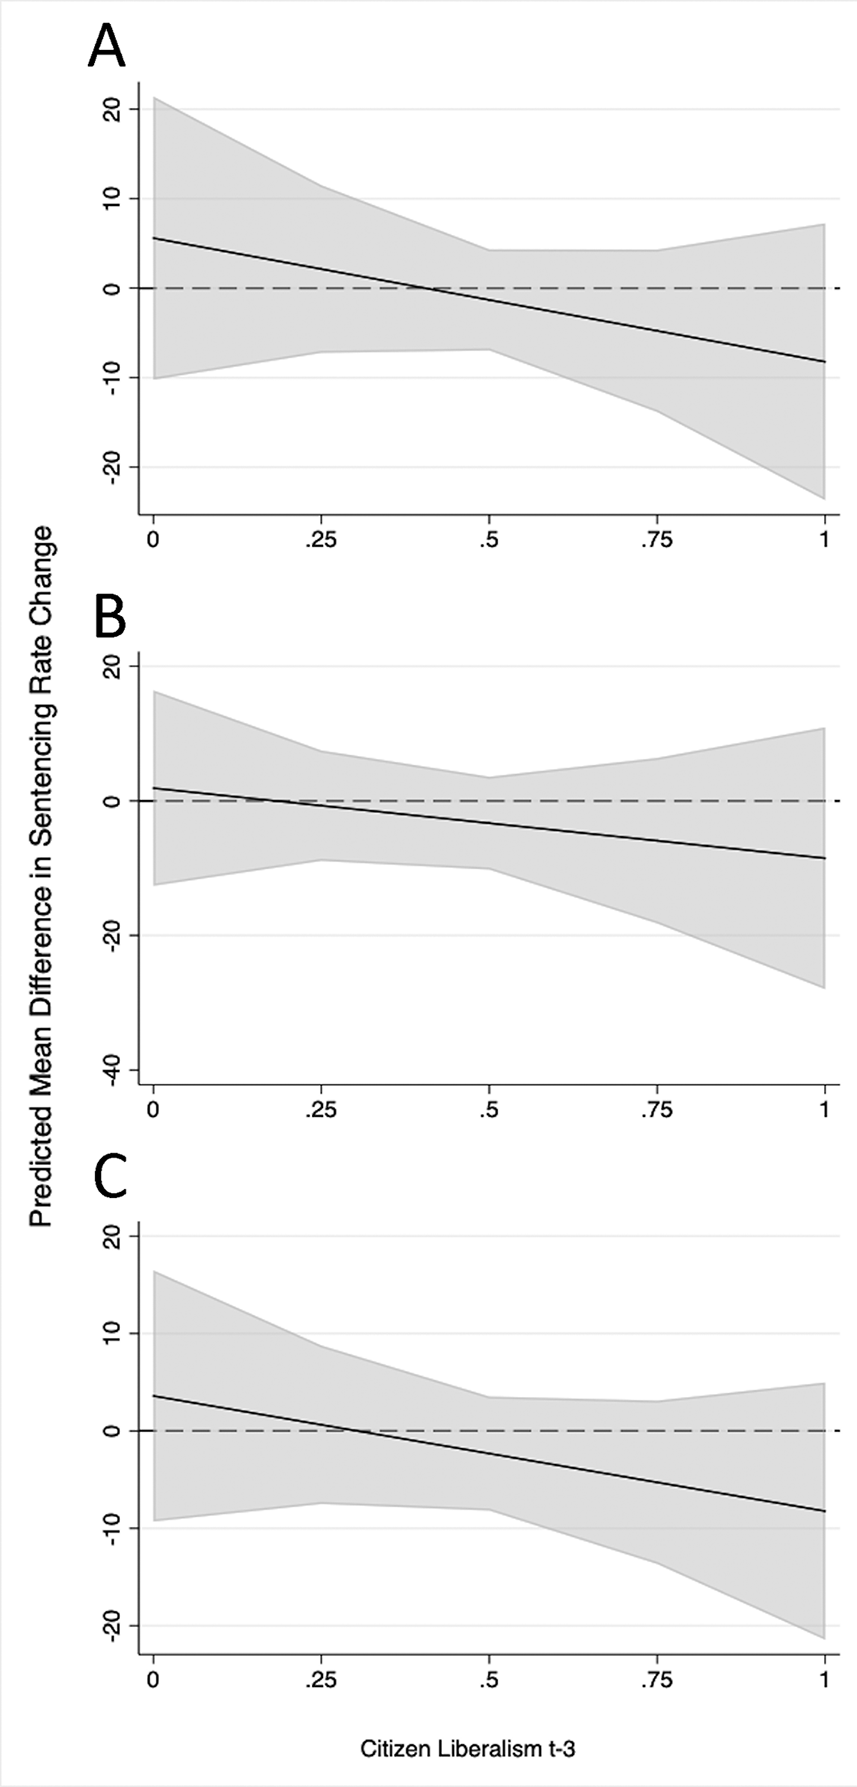
Interacting the retention mechanism with Citizen Liberalism adds little to the story. Model 4, which includes this multiplicative term, is nearly identical to model 3. Again, none of the regressors of interest is statistically significant, indicating that neither the retention method, public ideology, nor the interaction between the two has a significant relationship with sentencing rates. Figure 6 shows the margins plots for the interactive relationship, confirming the absence of a relationship.Footnote 13 The control variables that are significant in model 3 are also significant in model 4 with the same direction and approximately equal magnitudes.
Contrasts of retention mechanisms, sentencing rates. Horizontal lines at
indicate the baseline effect held constant, while the sloped lines indicate the effect of the retention mechanism contrasted with the baseline at a given level of ideology with 95% confidence intervals. In each panel’s title, the contrasted mechanism is listed first and the baseline category is listed second: A, uncontested retention elections versus no elections; B, nonpartisan elections versus no elections; C, partisan elections versus no elections. Contrast statistics and levels of significance are based on model 4. Statistics are listed in the appendix.

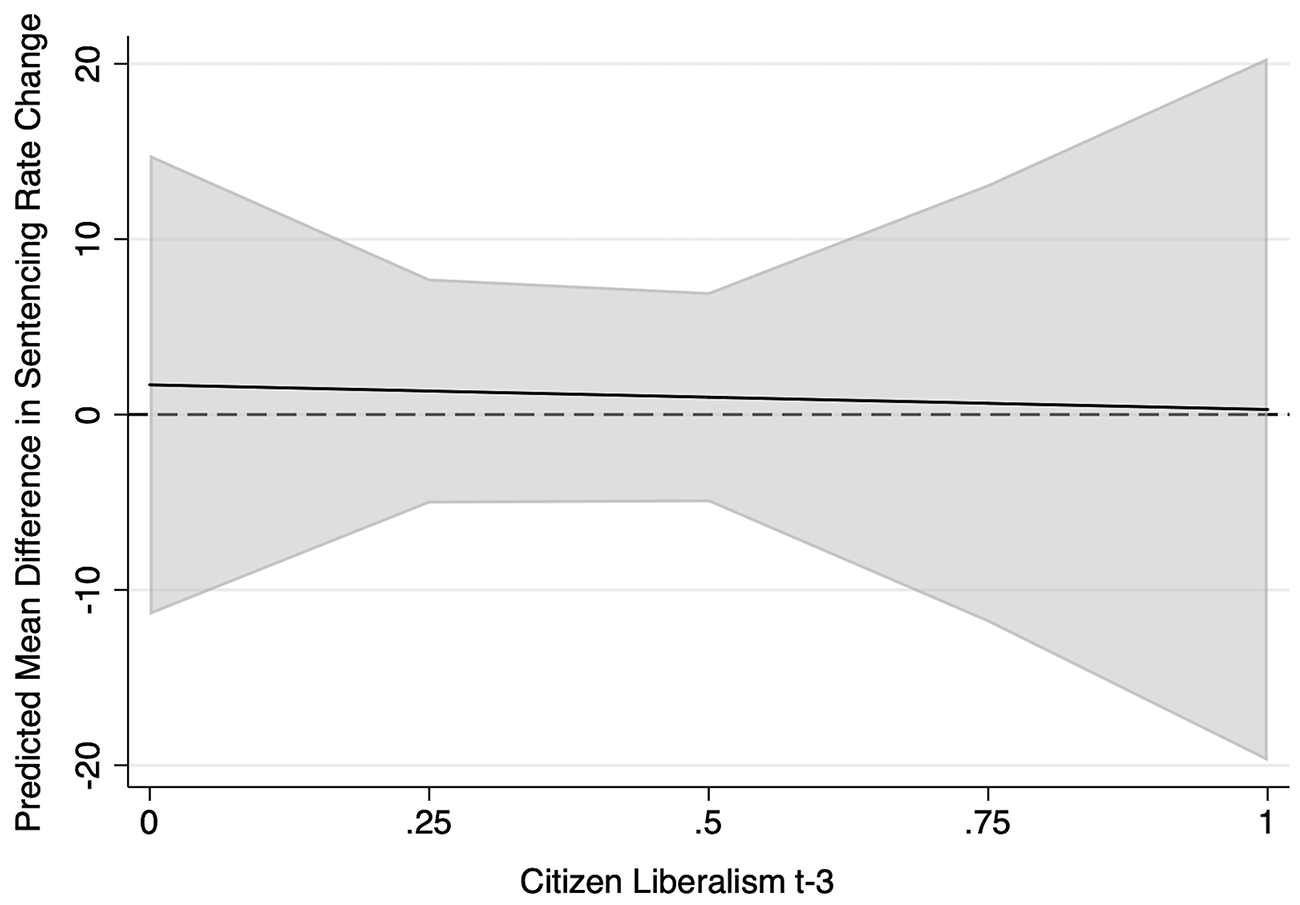
Figure 7 shows the margins plot for the predicted mean difference in sentencing rates between states with partisan elections and states with nonpartisan elections. Clearly, the pattern reported above holds. No difference in sentencing rates is present between nonpartisan and partisan states, regardless of the level of ideological liberalism among the public.
Contrasts of retention mechanisms, sentencing rates. Horizontal line at
indicates the baseline effect of nonpartisan elections held constant, while the sloped line indicates the effect of partisan elections contrasted with the baseline at a given level of ideology with 95% confidence intervals. Contrast statistics and levels of significance are based on model 4. Statistics are listed in the appendix.

Conclusion and Discussion
America has become the most carceral state in the world. Governments in the United States incarcerate more citizens per capita than any other country in the world. The United States leads the world in incarceration for several reasons: a higher level of criminal conduct (National Research Council 2014), the more punitive attitudes of the American public (Enns Reference Enns2014, Reference Enns2016), the large (and growing) number of offenses governments treat as criminal (National Research Council 2014), and the individualism so prominent in our culture (Olson Reference Olson2004).
Herein, I offer another explanation. The United States is only one of a few nations in the world that elects judges, and the only one that does so on such a wide basis. And I have demonstrated that in some contexts, jurisdictions with elected judges have higher rates of incarceration than do jurisdictions without judges who must face the public to retain their seat on the bench. The important context appears to be the level at which the mass public identifies as liberal.
While elections are apparently contributing to mass incarceration, it is not apparently because elected judges are sentencing more defendants to time in prison. The data and analyses presented above simply do not support the contention that judges are sentencing more defendants to prison time than are unelected judges.
This disconnect raises another question. If elected judges are not sentencing more defendants to prison than their unelected counterparts, then why are prison populations in states with elected judges higher than in nonelectoral states? One possible answer to that enigma is that rather than sentencing more defendants to prison, thus increasing prison populations, elected judges are sentencing fewer defendant to more time in prison; that is, they are handing down longer sentences, leading to a greater number of incarcerated individuals at one time. Previous research lends support to this notion (e.g., Huber and Gordon Reference Huber2004), but that research is limited to just a single state. Future cross-state analysis should seek to confirm this prospect.
Despite a strong theoretical expectation that nonpartisan judges should be more responsive to public opinion than partisan judges, and departing from previous studies finding that to be the case (e.g., Canes-Wrone et al. Reference Canes-Wrone2014), I found no difference between the two systems of judicial retention. At least two possible explanations for this difference exist. First, the previous research was conducted on appellate court judges. It is possible that, given the lower salience of trial court elections, the electoral threat is diminished for trial judges and thus the responsiveness to public opinion is mitigated. In other words, despite a history of evidence in support of my theoretical expectations, it is possible the theory is not generalizable to lower court judges.
Second, my theory is one of individual-level (i.e., judge-level) behavior, but my analyses are conducted at the state level. This raises questions about ecological fallacies, of course, but might also explain the null results. Future research at the level of the decision by an individual judge might yield more support for the theory and for the hypothesized differences between partisan and nonpartisan judges.
In this paper, I have developed a basic theory that posits that state trial judges who must face voters to retain their seat on the bench should be more punitive than their peers in states that do not face the same electoral considerations. An analysis of data from state prison populations has demonstrated mixed empirical support for the theory of elected punitiveness. States in which trial judges are retained by a vote of the people have generally higher rates of incarceration than states with no direct democratic check on the state’s judiciary, but there is generally no difference in terms of sentencing rates.
This study advances the literature on judicial elections and accountability in a number of ways. Its first contribution is theoretical. Previous scholarship in judicial politics, especially in studying policy outcomes, has largely focused on appellate courts. I move beyond the study of appeals courts to study policy outcomes by focusing on trial courts and study the policy of interest in a comparative, cross-state way, by taking advantage of varying mechanisms for selecting trial judges in the states. The study of trial courts is theoretically important because trial courts have the largest caseload of any court in the United States, and because trial judges are rewarded with an increased vote share when seeking higher office. This paper takes seriously the study of trial courts.
Additionally, this paper contributes to the judicial literature in two methodological ways. I introduce a data set, the NPS data set, to the judicial politics literature. The NPS has been previously unused in the subfield, and given the field’s increasing interest in the political nature of the criminal justice system, the NPS has the potential to serve as an important source of incarceration-related data for judicial scholars. Moreover, I introduce the use of a new variable to measure punitiveness. Previous scholarship has taken an interest in incarceration rates, but no study, to my knowledge, has used new prison admission rates to measure a state’s punitiveness.
Still yet, this paper is limited in at least two ways that present opportunities for future research. First, I have conducted an analysis at the aggregate level. I have demonstrated that states with elected judges are more punitive than states without elected judges. However, the theory should also be tested at the individual (i.e., judge) level to determine whether judges who are elected are more punitive than their unelected peers. Future research should test the theory at the individual level. Second, I have proposed that the mechanism for increasing punitiveness in the states with elected judges is the threat of electoral defeat. Previous research uses temporal proximity to an election to make the argument that elected judges are cognizant of, and responsive to, electoral considerations, but the studies have been limited usually to a single state. Future research should investigate this possibility in a comparative study to confirm the electoral consideration mechanism.