


Introduction
In glacierized catchments the quantity and geographic distribution of snow cover is highly variable and largely determined by the interaction of local weather patterns with the topography (Reference Lehning, Doorschot and BarteltLehning and others, 2000). The precipitation and temperature regimes determine the position of the snowline in a catchment. From this the equilibrium-line altitude (ELA) can be identified, as it coincides with the position of the transient snowline on the glacier surface at the end of the ablation season (Reference Benn and EvansBenn and Evans, 1998). Therefore, the position of the transient snowline is indicative of accumulation and ablation processes and the overall mass balance of the glacier.
Though there is great variability in the extent and volume of snow cover between years, the annual mean snow cover in the Northern Hemisphere experienced a stepwise decrease of 5% in the late 1980s (Reference LemkeLemke and others, 2007). This trend is projected to continue and accelerate throughout the 21st century (Reference Haeberli, Cihlar and BarryHaeberli and others, 2000) and will have pronounced effects upon permafrost, seasonal snow-melt and runoff, as well as alpine glacier extent (Reference LemkeLemke and others, 2007).
In the past, Swedish glaciers have fluctuated in response to cooling and warming of the Earth’s ambient temperatures (Reference HolmlundHolmlund, 1987; Reference Brugger, Refsnider and WhitehillBrugger and others, 2005). They typically have long response times (Reference Holmlund and JanssonHolmlund and Reference JanssonJansson, 1999) as a result of relatively low accumulation and ablation rates (Reference Holmlund, Karlén and GruddHolmlund and others, 1996). Though the larger, more continental glaciers may still be experiencing retreat, the widely studied Storglaciären in the Kebnekaise massif, Lapland, is thought to be currently in quasi-equilibrium with existing climate (Reference Brugger, Refsnider and WhitehillBrugger and others, 2005). It reached this state around 1980 (Reference BruggerBrugger, 1997), with slight volume increases until the mid-1990s as a result of increased winter precipitation and the shift to a more maritime climatic regime in the region (Reference DowdeswellDowdeswell and others, 1997).
The purpose of this paper is to use a conceptual snow-wedge model to simulate the net seasonal snow input to Storglaciären and compare the resulting winter balances with the measured winter and net mass balances from the Tarfala Research Station. A snow-wedge model is chosen as it has the advantages of small data and computational requirements. Classified remotely sensed imagery provides snowlines for particular days which are compared with model results. Variability in snowpack volume over 16 years is described so as to ascertain its influence on the winter balance and therefore the net mass balance of Storglaciären.
Study Site
Storglaciären is a small valley glacier situated on the eastern side of the Kebnekaise massif in northern Sweden (67˚55' N, 18˚35' E). It is a polythermal glacier, where ~85% of the ice is temperate. Storglaciären is 3.2 km long from its snout (~1120ma.s.l.) to its head at ~1730ma.s.l. and covers a total surface area of ~3.1km2. Steep-sided slopes and back walls border the ice and rise up to ~500m above the upper firn regions (Reference Hock and HolmgrenHock and Holmgren, 1996). The glacier flows eastward, fed by two cirque-type basins. The climatic regime of the glacier is closely related to frequent eastward-trending cyclonic activity and the related prevailing westerly winds (Reference Hock and HolmgrenHock and Holmgren, 1996). High numbers of these airflows have been related to regionally high winter accumulation values and have resulted in high net mass balances (Reference Pohjola and RogersPohjola and Rogers, 1997). Mass-balance studies have been conducted annually at Storglaciären since 1945/46 (Reference Holmlund and JanssonHolmlund and Reference JanssonJansson, 1999; Jansson, 1999), so much of the research on the glacier has been concerned with its mass balance (Reference HolmlundHolmlund, 1987; Reference Holmlund, Karlén and GruddHolmlund and others, 1996; Reference HockHock and Jensen, 1999; Reference P., Jansson and PetterssonHolmlund and others, 2005; Reference Jansson and PetterssonJansson and Pettersson, 2007) as well as snow and ice melt with relation to discharge (Reference Hock and NoetzliHock and Noetzli, 1997; Reference HockHock, 1999; Reference Hock and HolmgrenHock and Holmgren, 2005). However, few studies have investigated accumulation within the glacial system (Reference Schneider and JanssonSchneider and Jansson, 2004; Reference Hock and H.Hock and others, 2007; Reference Jansson, Linderholm, Pettersson, Karlin and MörthJansson and others, 2007).
Methods
Modelling snow accumulation and ablation
Using a snow-wedge model similar to that of Reference Fitzharris and GarrFitzharris and Garr (1995), the snow accumulation and ablation over Storglaciären is modelled daily from 1 January 1990 to 23 July 2006. Daily precipitation and average daily air temperatures are required for model input. Precipitation values from Kråkmo, Norway, are used, as no suitable continuous data are available from within the valley itself. Kråkmo is ~110km west of Tarfala across the Scandinavian Mountains (at 76 ma.s.l.). Reference Jansson and PetterssonJansson and others (2007) also use representative coastal Norwegian meteorological data when investigating snow deposition over the Kebnekaise massif. The temperature values are obtained from the Tarfala valley climate station, which is ~1 km northeast of the glacier at 1130 ma.s.l. (Reference HockHock, 1999). A linear 10% increase per 100 m is applied to the precipitation values (Reference Hock, Radiá and De WoulHock and Noetzli, 1997), and a lapse rate of 0.65˚C (100m)–1 (Reference Barry and ChorleyBarry and Chorley, 1987) to the temperature values.
Using Equation (1), snow deposition (p) and snow ablation (a) are used to calculate the daily specific mass balance at each 100m elevation band (b (z,d)), with d referring to day and z referring to the elevation band, which ranges from 1100–1199 to 1700–1799ma.s.l.:

The volume of snow deposited daily (p (z,d)) depends on a threshold temperature (T h) that is set at 1.5˚C to distinguish between solid and liquid precipitation (Reference HockHock, 1999):

Daily snow ablation at each elevation band (a (z,d)) is calculated using a degree-day model (Reference BraithwaiteEquation (3)). Reference HockHock (1999) used a degree-day approach to simulate the dischar ge of Storglaciären for the 1993 and 1994 summer seasons. The maximum agreement between simulated and observed discharge was given by the highest R 2 value, which in turn was correlated to the optimal degree-day factor. Though considerable diurnal and spatial variation was evident in the degree-day factors (f), it was found that the optimal ones for snow and ice were 5.5 and 6.5 mm˚C–1 d–1 respectively for normal flow conditions (Reference HockHock, 1999). During low-flow conditions these changed to 4.5 and 7.5 mm˚C–1 d–1. However, a time-averaged f of 3.2 mm˚C–1 d–1 for snow was obtained from air-temperature and ablation measurements on the glacier surface for the same study period (Reference HockHock, 1999).
Within this current investigation, an initial degree-day factor of 5.5 mm˚C–1 d–1 is used, as this is the higher optimal f for snow found in Hock’s (1999) study. This is then lowered to the 3.2 mm˚C–1 d–1 time-averaged degree-day factor in order to obtain a better fit between model results and snowlines delineated from remotely sensed imagery and measured winter balances. Only snow ablation is simulated. Thus b (z,d) is set at zero once the entire snowpack in a particular elevation band is completely melted, unless a fresh snowfall occurs.

Net specific snow accumulation (n (z,d)) in mm water equivalent (mmw.e.) for each elevation band is calculated daily by cumulatively summing the daily specific mass balances. This is multiplied by the respective band area to give the daily net snow balance (B z) in m3w.e. The daily net seasonal snow input to the glacier (B G) in m3w.e. is calculated by adding Bz for all elevation bands. Annual snow accumulation (S A) in m3 is calculated as the difference between maximum B G at the end of winter and minimum B G the previous autumn. By averaging annual snow accumulation over the glacier area, the winter balance (B W) is calculated in mw.e. The amount of annual snowmelt (S M) in m3 is also calculated, with the difference between S A and S M being the snow available for transformation to firn, termed here as net seasonal snow (S N) in m3.
Mapping snow cover from remotely sensed imagery
Two aerial photographs (2 September 1990 and 9 September 1999), one Landsat 7 Enhanced Thematic Mapper Plus (ETM+) image (31 July 2002) and two Advanced Spaceborne Thermal Emission and Reflection Radiometer (ASTER) images (15 April 2004 and 8 May 2004) are used. These are geometrically calibrated and the satellite imagery corrected for atmospheric interference. All are georeferenced to the Universal Transverse Mercator (UTM) World Geodetic System 1984 (WGS84) zone 34N projection within the programme ENVI version 4.2. A digital elevation model (DEM) of the catchment is also georeferenced to the common UTM zone. The DEM is then divided into seven 100m elevation bands ranging from 1100–1199 to 1700–1799ma.s.l.
The remotely sensed images are classified within the programme eCognition Professional (version 5.0). User-defined rules enable the distinction between areas of snow, ice and non-snow/ice, based on the spectral signatures of these regions as well as on aspect, slope and elevation information obtained from the DEM. All the classified images are then overlain onto the DEM. A transect is inserted from the névé to the snout of the glacier. The snowline altitude is obtained for each image as the point where the snowline intersects the transect. No account is taken of spatial variability across the glacier.
Validation of model results
The snowline elevations obtained from the image classifications are compared to the snowline elevations produced by the model. The model results are also compared with winter-balance (B W) and net mass-balance (B N) values measured annually at Storglaciären. Where discrepancies are identified between model results and observed data, the degree-day factor is lowered and the model run again.
Results
Meteorological data
The total annual precipitation varies throughout the 16 year study period, from a maximum of 1877mm in 1992 to a minimum of 1223mm in 2000, with an average of 1429 mm. There is a slightly negative trend overall, though it is not statistically significant (p > 0.05).
There is considerable variability in the annual mean air temperature, fluctuating between a minimum of –3.90˚C in 1998 and a maximum of –1.71˚C in 2003. Over the study period there is an increase in temperature of 0.55˚C (10 a)–1. This is considerably higher than the globally averaged warming (0.13˚C (10 a)–1) for the period 1970–2005, though Arctic temperatures have increased almost twice as much as the global average in the past 100 years (Reference TrenberthTrenberth and others, 2007). This increasing trend is mainly due to a prominent increase in the maximum temperatures experienced during summer (Reference Linderholm and JanssonLinderholm and Reference Jansson, Linderholm, Pettersson, Karlin and MörthJansson, 2007). However, due to the variability in mean annual temperature the overall increase is not statistically significant (p > 0.05).
Snowline elevations
The model run with a degree-day factor (f) of 3.2mm ˚C–1 d–1 simulates snowline elevations better than the model run with the degree-day factor of 5.5 mm˚C–1 d–1, when compared to those the remotely sensed imagery identified (Table 1). This is because the lower degree-day factor reduces snow ablation, thus enabling the snow to persist for longer periods at lower elevations. As a result of this, the snowlines delineated from the images taken during and at the end of the ablation season (i.e. the 1990 and 1999 aerial photographs and the 2002 Landsat 7 ETM+ image) are more accurately simulated by the model run with the lower degree-day factor.
Snowline elevations (m a.s.l.) derived from remotely sensed imagery classifications and snow-wedge model results

Seasonal snow volumes
Decreasing the degree-day factor from 5.5 to 3.2 mm ˚C–1 d–1 results in a marked increase in net seasonal snow input to the glacier (B G), as shown in Figure 1. This is because the method used does not take into account the loss of snow from the snowpack as it transforms into firn and so produces a cumulative build-up of snow. The peaks and troughs of the plot in Figure 1 show the annual snow accumulation (S A) and melt (S M) respectively. The volume of snow available for transformation to firn is the base area under the troughs. Decreasing f increases the volume of snow available for transformation because snowmelt is reduced, thus leaving more snow on the glacier surface at the end of the ablation season.
Net seasonal snow input to glacier (B G) (103m3) for each year.

Figure 1 also shows the interannual variability in the amount of snow that falls, melts and is carried over to the next year in the form of net seasonal snow (S N). The difference between the two model predictions of annual snow accumulation ranges from 6.4×10³m3 to 403.6×10³m3. The largest difference between the two model outputs occurs for estimations of the snow volume for 2006. This is a result of the model run with a higher f simulating a larger amount of snowmelt during the summer of 2005.
There is considerable variability in the amount of snow that falls each winter throughout the study period. The model results (using f = 3.2 mm8C–1 d–1) indicate that the early 1990s are characterized by large volumes of snow remaining on the glacier surface after the summer ablation season, which resulted in positive net seasonal snow volumes (Fig. 2). Following this, from the mid-1990s until 2000 there is a dramatic decrease in the net seasonal snow volumes. From 2001 to 2003, negative S N values occurred, suggesting greater snow ablation than accumulation. This would have resulted in melting of old snow (firn/snow reservoir) as well as the seasonal snow. These results again indicate a decrease in the snow volume remaining on the glacier surface. However, 2004 and 2005 had positive net seasonal snow values. The model run with f = 5.5 mm˚C–1 d–1 shows a similar pattern but with reduced net seasonal snow volumes, and the mid-1990s are characterized by negative seasonal snow values due to the higher ablation rates.
Net seasonal snow (S N) modelled using the different degree-
The net snow balance (Bz ,d) for each elevation band is a function of the area of the band and its position in relation to the ELA. Therefore, the highest net snow balance occurs in the elevation band 1600–1699ma.s.l. for both model simulations, as this is the band with the largest area above the ELA (1485ma.s.l. according to Hock and Holmgren, 1996). Decreasing f produces markedly larger net snow-balance volumes in the elevation bands 1500–1599 and 1600–1699ma.s.l., meaning that more snow is present in the accumulation area of the glacier. This suggests that snow at the elevations closest to the ELA is most sensitive to changes in f and thus ablation processes.
Winter balance (b w)
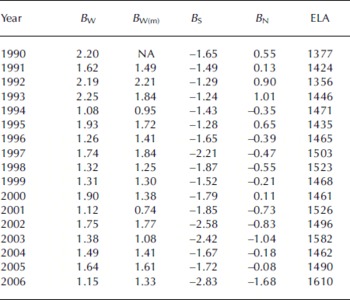
The winter balance results for the model run with f = 3.2 mm˚C–1 d–1 are shown in Figures 3 and 5 and Table 2. Only the results from this model are further analyzed, as they show the closest fit with snowline elevations from the image classifications and measured winter balance values. The calculation of B W was not possible for the year 1990, so this has been omitted. Figure 3 shows the interannual variability in winter balance over the study period.
Modelled and measured winter balance (mw.e.). day factors.
The greatest error between modelled and measured B W is for the year 2000 and the smallest error is for 1999. A Mann– Whitney non-parametric t test was performed to see if there was a statistical difference between the measured and modelled winter balances. At the 95% confidence interval there is no significant difference between the two datasets (P = 0.24).
A regression equation was calculated in order to determine the nature of the relationship between measured and modelled winter balance. The resulting equation (Y = 0.34 + 0.845X) with an R 2 value of 0.72 indicates that there is a moderate correlation between measured and modelled B W. Outliers weaken the relationship, as the model does not accurately simulate the B W for 1993, 2000 and 2001. Figure 4 indicates moderate precision of the model in predicting winter balance, as the slope of 0.85 for the data points is close to a slope of 1.0 (a perfect relationship).
Scatter plot of measured vs modelled winter balance (B W), showing a 1 : 1 line.
Both plots in Figure 5 show that there is a negative trend in B W over the study period, with the model simulating a slightly less negative trend than the measured trend. This decrease is winter balance occurs alongside an increase in the negativity of the summer balance, resulting in the occurrence of negative net mass balances, as shown in Table 2.
Measured B W (a) and modelled B W (b) both with regression line and equation overlain.
The winter-balance (mw.e.) results from the model (B W(m)) run using f = 3.2 mm˚C–1 d–1 as well as the observed winter (B W), summer (B S) and net mass balance (B N) and the ELA from Tarfala Research Station
Discussion
The snow-wedge model simulates considerable variability throughout the study period in the cumulative build-up of snow, termed here as the net seasonal snow input to the glacier (B G). This volume greatly increases when the degree-day factor (f) is reduced from 5.5 to 3.2 mm˚C–1 d–1. This is because there is less snowmelt occurring and therefore increased volumes of snow remain on the glacier surface at the end of the summer ablation period (this is the net seasonal snow, S N). The annual variation in B G is more visible in the results of the model run with the higher f. However, both models simulate the occurrence of years when B G is decreasing (e.g. 2003), as shown in Figure 1. This suggests that snowmelt (S M) is greater than the previous snow accumulation (S A) and therefore melt of the firn reservoir is occurring. The firn area of Storglaciären is ~49% of the total glacier area (Reference Schneider and JanssonSchneider and Jansson, 2004), so these trends will have important implications for the calculation of the net mass balance of the glacier, as refreezing of the meltwater within the firn reservoir will lead to internal accumulation. This internal accumulation corresponds to 3–5% of the annual accumulation of the entire glacier in an average year (Reference Schneider and JanssonSchneider and Jansson, 2004), so changes to this volume will result in changes in the net mass balance.
The model run with f = 3.2 mm˚C–1 d–1 indicates that the early 1990s were characterized by high values of net seasonal snow (S N) followed by a reduction in the mid-1990s, with 2001–03 experiencing negative net seasonal snow values (Fig. 2). This again suggests the occurrence of melt within the firn reservoir. However, 2004 and 2005 showed positive net seasonal snow values and so highlight the variable nature of net seasonal snow. The variability in the winter balance (B W) throughout the study period is better simulated by the model run with f = 3.2 mm˚C–1 d–1, which suggests a slightly negative trend overall (Fig. 5). Considering the simplicity of the model, there is fair agreement between measured and modelled B W, with the highest error associated with B W for 1993, 2000 and 2001. These outliers reduce the statistical strength of the relationship (Fig. 4).
The above results suggest that the early 1990s were characterized by high winter balances and high net seasonal snow volumes. These corresponded with positive glacier net mass balances and lower ELAs. These findings are in agreement with observed volume increases until the mid-1990s as a result of increased winter precipitation due to a shift to a more maritime climatic regime of the region (Reference DowdeswellDowdeswell and others, 1997). However, the model indicates that from the mid-1990s until 2006 there has been a general decrease in B W, a decrease in the net seasonal snow and an increase in the frequency of years where snow ablation is greater than accumulation. This is occurring in conjunction with an increase in more negative summer balances, and thus leading to the occurrence of negative glacier net mass balances and rising ELAs. This trend can be associated with increasing mean air temperatures over the study period. This rise in temperature acts to increase the proportion of precipitation falling as liquid and to increase the rate of snowmelt. The dependence of Storglaciären net mass balance on variations in summer temperatures was also found by Reference Linderholm and JanssonLinderholm and Reference Jansson and PetterssonJansson (2007).
The advantages of the model used are that it has small data and computational requirements, and yet generally speaking there is good agreement between measured and modelled winter balances. However, it does include a lot of assumptions, it requires measurements to tune the model and it is very sensitive to errors of the input precipitation and temperature values. It also does not include spatial or temporal variation in several of the parameters used. Error may result from the assumptions regarding the precipitation gradient and temperature lapse rate with elevation, as the assumption that these will remain constant is not fulfilled in glacial environments (Reference Hock, Radiá and De WoulHock and Noetzli, 1997). Also, the assumption of a constant degree-day factor throughout the ablation season will have influenced the modelled melt rates and therefore the net seasonal snow input to the glacier (B G). This is because degree-day factors vary considerably in space and time and are subject to distinct daily cycles (Reference HockHock, 1999) as they vary with altitude, surface albedo and the energy balance at the surface (Reference BraithwaiteBraithwaite, 1995; Reference HockHock, 2003). Time-averaged degree-day factors for snow have been found to vary between 3.2 and 4.5 mm˚C–1 d–1 for snow ablation on Scandinavian glaciers (Reference BraithwaiteBraithwaite, 1995; Reference HockHock, 2003), though they can vary between 2 and 7mm ˚C–1 d–1 (Reference HockHock, 1999).
The model is also very dependent on the areas used for the elevation bands and the overall glacier area when calculating the net snow balance (Bz ,d), net seasonal snow input to the glacier (B G) and the winter balance (B W). The model also neglects wind redistribution of snow when falling or after deposition, which will be significant (Reference Jansson, Linderholm, Pettersson, Karlin and MörthJansson and others, 2007), as well as snow accumulated as a result of avalanching from the east-facing headwalls (Reference Jansson, Linderholm, Pettersson, Karlin and MörthJansson and others, 2007). The snow distribution over Storglaciären is highly variable and may result from deposition from both the northwest and southwest depending on the regional and local climate (Reference Jansson, Linderholm, Pettersson, Karlin and MörthJansson and Pettersson, 2007).
Conclusions
The aim of this study was to investigate variability in snow-pack volume so as to ascertain its influences on the winter balance and the net mass balance of Storglaciären. Despite the simplicity and limitations of the snow-wedge model used, the results suggest that some interesting trends are occurring within the accumulation zone of Storglaciären. In the early 1990s, high winter balances and positive net seasonal snow volumes resulted in positive glacier net mass balances. This trend, however, changed over the 16 year study period to lower winter balances and decreasing or even negative net seasonal snow volumes, which in conjunction with more negative summer balances are now producing negative net mass balances and rising ELAs. This result has important implications for the future mass balance of the glacier if this trend continues. Therefore, further investigation of snow accumulation and ablation processes at Storglaciären is required in order to increase the accuracy of models that predict glacier mass balance with changes of temperature and precipitation.
Acknowledgements
E. Evans thanks her university supervisors R. Essery and R. Lucas. We also thank N. Rosqvist, P. Jansson and H. Törn-berg from Stockholm University and the Tarfala Research Station crew. For the provision of imagery, meteorological data and mass-balance data we thank I. Brown, the Norwegian Meteorological Institute and Tarfala Research Station, respectively. Comments by R. Dadic and an anonymous reviewer improved the manuscript, and help from B. Fitzharris and N. Cullen is gratefully acknowledged.



