

INTRODUCTION
The concept of governmental representation, Robert Dahl (1989, p. 29) argues, has “transformed democracy from a doctrine suitable only for small and rapidly vanishing city-states to one applicable to the large nation-states of the modern age.” Perhaps because of its importance, ensuring equal representation in the United States has been a slow, contentious, and uneven process, particularly with regard to racial equality (See Cain et al., 2005 for a review). Today, in both theory and practice, states must comply with the Supreme Court ruling that each citizen has the right to have her voice heard equally and that each citizen represents one vote in this process (Baker v. Carr 1962). That rule effectively institutionalized the understanding that modern democratic governance should be synonymous with equal representation. While the Supreme Court recently nullified the pre-clearance section of the Voting Rights Act, it reaffirmed that drawing political boundaries in racially discriminatory ways (racial gerrymandering) violates equal representation (Shelby County v. Holder 2013).
At the same time, incarceration has become a defining feature of American society. Since 2002, the United States has had the highest incarceration rate in the world and approximately one in one hundred adults is currently behind bars (PEW 2008; Walmsley Reference Walmsley2010). Loïc Wacquant (Reference Wacquant2010) terms this “hyperincarceration” because the unprecedented expansion of the American penal system is concentrated along three lines: class, race, and place. Indeed, Black males without a high school degree who came of age during the prison boom have a cumulative risk of incarceration of 58.9%, compared to 11.2% for similarly situated White males (Pettit and Western, Reference Pettit and Western2004). The spatial inequality of incarceration is also well documented; for example, in Chicago, West Garfield Park’s incarceration rate is over forty times higher than that of the highest-ranked White community (Sampson Reference Sampson2012). Thus hyperincarceration has created a problem of “missing men” from low income communities of color (Pettit Reference Pettit2012; Sampson Reference Sampson2012; Wolfers et al., Reference Wolfers, Leonhardt and Quealy2015). While a growing body of work has shown that the absence of these men from their neighborhoods skews neighborhood demographics and biases statistics on racial disparities (Pettit Reference Pettit2012; Western and Beckett, Reference Western and Beckett1999), past studies have not fully considered that these missing men are actually counted elsewhere, which may have political consequences. Correctional populations are the only Americans forcibly relocated by the state, often across legislative boundaries.
If every member of the population were eligible to vote, achieving equal representation would be simple. However, the existence of populations that are legally ineligible to vote (children, non-citizens, the mentally incapacitated, and incarcerated) means that although districts have comparable total populations—often referred to as one person, one vote or representational equality—they do not necessarily have comparable populations of eligible voters, known as vote [in]equality (Cowan Reference Cowan2015). For example, were the United States to prioritize vote equality over representational equality, at least thirteen congressional districts would move from states with large non-voting immigrant populations such as Texas and California to states with relatively low immigrant populations like Kentucky and Montana (Cowan Reference Cowan2015).
We argue here that hyperincarceration presents a unique challenge to equal representation by either definition (representational or vote). Prisoners are denied the right to vote in every state except Vermont and Maine and yet are counted as residents of the communities where they are incarcerated except in Maryland, New York, and Delaware. As wards of the state confined within prison walls, the incarcerated are not members of these communities in any meaningful way. Moreover, because prisoners are disproportionately people of color from urban areas while most prisons are located outside of urban areas, representation, particularly non-White representation, may be distorted by incarceration. Thus the presence of a prison may allow districts to artificially appear to achieve representational equality and simultaneously fuel vote inequality as voters in such districts may have more influence. Hyperincarceration may subtly, but perniciously, violate the constitutional right to equal representation for all persons (Baker v. Carr 1962; Reynolds v. Sims 1964; Shelby County v. Holder 2013).
The basic assertion—that moving prisoners from urban, disproportionately non-White areas into majority White, suburban and rural areas will artificially boost rural and suburban White representation at the expense of urban, non-White voters—is intuitively simple. Unfortunately, assessing the extent to which hyperincarceration imbalances political representation is no easy task. Raw counts of how many persons are incarcerated are inconclusive because both where they are incarcerated and where they live when not incarcerated matter (Hamsher Reference Hamsher2005). While some research has examined the impact of removing prisoners from districts with correctional facilities (Lotke and Wagner, Reference Lotke and Wagner2004; Wagner Reference Wagner2002), this is only half the story. It is equally important to ascertain how representation is affected in districts that lose constituents to correctional facilities. Furthermore, given the disproportionate incarceration of people of color and their concentration in urban areas, it is also critical to know how this policy affects representation in non-White communities, especially given historical and contemporary struggles for ensuring racially equal representation. Reports from the Prison Policy Initiative (n.d) about prison gerrymandering have increased public awareness of the issue, yet no full empirical assessment on the topic exists. Perhaps more importantly, while the basic idea is intuitive, counting prisoners as members of communities where they are incarcerated may have little impact on representation; because prisons typically hold a few thousand individuals and legislative districts are quite large in comparison, removing and returning prisoners to their home communities may not affect representation. In the present study we develop a more complete test to examine whether and how incarceration affects representation, with a particular focus on urban, predominantly non-White communities.
In our analyses, we advance a counterfactual approach to examine Pennsylvania state legislature representation that not only removes ineligible voters from districts, but also returns the missing persons to their previous neighborhoods. More specifically, we estimate the number of residents legislative districts would gain or lose if prisoners were counted as residents of their home communities, not correctional facilities. This allows us to ascertain whether any districts would be in violation of the Supreme Court’s one person, one vote rule. For the majority of Pennsylvania’s districts, the population removed and/or gained is small enough to have no impact on district size. However, there is a great deal of variation; sixteen districts gained one standard deviation above the mean in new residents (SD = 838 residents) and one district gained two standard deviations. Meanwhile seven districts lost one standard deviation of residents and an additional ten more districts lost two standard deviations of residents. Of these districts, four were too small under the current district apportionment and four districts grew too large using a conservative counterfactual that may underestimate the localized impact of hyperincarceration on communities of color.
In addition to assessing representational equality, we also examine shifts in geographic power and non-White representation to assess vote equality as well. As hypothesized, we find that prisoners are moved out of urban non-White districts to primarily White suburban and rural districts. We then use our counterfactual to estimate how the average Pennsylvania voter’s district changes by race. We find that on average, Whites lose residents while Blacks and Latinos experience an influx of residents. Overall, these findings illustrate that hyperincarceration affects both representational and vote equality as hypothesized.
To construct our counterfactual, we marshal data from three different sources. We use data from the Census to remove prisoners from districts with correctional facilities, data from the Pennsylvania Department of Corrections to ascertain prisoner demographics and pre-prison residences, and information from the Pennsylvania Redistricting Commission to determine the boundaries of legislative districts. Combining these data sources allows us to assess the impact of incarceration on equal representation.
We begin by developing the historical background of our topic, situating our empirical analyses in the literatures on American representation, race, and the consequences of hyperimprisonment. We then draw on residential, political and economic factors to explain why incarceration may impact representation. Third, we describe our data sources and the logic of our investigation before presenting our results. We conclude by discussing some implications of our results for representation and inequality.
Historical and Theoretical Background
Representation, Race, and American Democracy
While equal representation is the foundation of modern democratic governments, Dahl notes that “the change in democracy resulting from its union with representation created its own problems” (Dahl Reference Dahl1989 p. 29-30). Indeed, defining and ensuring equal representation has been a struggle in the United States since the nation’s founding, especially concerning how and where marginalized racial populations are counted. Scholars often cite the Three-Fifths Compromise, which counted slaves as three-fifths of a person for representation apportionment, as a defining event in race relations (Drake Reference Drake2011; Robinson Reference Robinson1971). Slaves, who could not vote, were an important source of political power for elite southern Whites. Even after the 14th Amendment abolished the Compromise nearly a century later, states continued to apportion districts unequally, with population sizes varying markedly across districts (Cain et al., Reference Cain, Mac Donald, McDonald, Mann and Cain2005). Moreover, although Blacks were technically enfranchised, many were prevented from voting during the Jim Crowe era, which continued to inflate White political power (Perman Reference Perman2001; Redding Reference Redding2003). These issues persisted until the Civil Rights Movement illuminated Black voting obstacles and inadequate racial representation. In response, the Voting Rights Act addressed the former while the judiciary tackled racial inequity and district apportionment more generally, ruling that redistricting efforts must not violate the 14th and 15th amendments.
In Baker v. Carr (1962) the Supreme Court specified that each person represents one vote and that each person has the right to have her vote counted equally. This ruling, reified by the Court in Reynolds v. Sims (1964), prioritized representational equality over preserving city, county, or community of interest boundaries, which had previously enabled variation in district size. At the time, some state legislative districts in Tennessee were as small as 2,340 residents while Shelby County, which included Memphis, with over 300,000 residents was split into only eight districts (Baker v. Carr 1962). As a result of these rulings, large scale redistricting occurred around the country to achieve population equality (Cain et al., Reference Cain, Mac Donald, McDonald, Mann and Cain2005). Part of this redistricting specifically had to do with ensuring representation for non-White communities. First specified by the Voting Rights Act (1965) and later elaborated on in Thornberg v. Gingles (1986), if a racial population is “sufficiently numerous and compact to form a majority” then states are required to district accordingly. Complying with these representational equality rulings seemed relatively clear cut and straightforward, but difficulties remained regarding racial representation.
Thus more recent representation debates focus on whether gerrymandering, the process of drawing political boundaries in unfair ways, prevents minorities from receiving fair representation (Lublin Reference Lublin1999; Shotts Reference Shotts2001). Specifically, scholars and policy makers are concerned with striking the appropriate balance with majority-minority districts. On the one hand, there is concern that people of color are overly divided up across districts, resulting in fewer majority-minority districts. On the other, too much consolidation of racial minorities within a few majority-minority districts also limits influence. For example, David Lublin (Reference Lublin1999) finds that when a district is 40% minority, people of color can have considerable impact on political issues. Yet many majority-minority districts have much larger people of color populations, essentially reducing influence (see Alabama Legislative Black Caucus v. Alabama 2015). Regardless of the specific representation issue under study, be it representational equality or racial gerrymandering, American representation is based on one critical piece of information: accurate population counts.
The Census counts prisoners at the correctional facilities where they are incarcerated under its usual residence rule, which counts people at “the place where they live and sleep most of the time” (U.S. Census 2010). This rule has been applied to prisoners since at least 1850 (National Research Council 2006). Additionally, the Census categorizes prisoners as residents of “group quarters,” which includes mental health facilities and nursing homes or long term care facilities. Thus while most American household heads complete a Census form today, administrators of group quarters, most likely prison wardens in the present case, submit facility population counts to the Census (Lotke and Wagner, Reference Lotke and Wagner2004). Importantly, prisoners cannot vote in forty-eight states, yet are recorded in the Census as residents of the communities where they are incarcerated. Until the 1980s there were so few prisoners that this policy likely had little impact. Coupled with the massive growth of the prison population, this policy may enable what some call prison gerrymandering, or the use of prisons to inflate the number of residents in a district (Ho Reference Ho2011; Wagner Reference Wagner2002; Wood Reference Wood2015).
Although the Census’ prisoner enumeration policy remains the same, changes have been implemented regarding other mobile populations (see National Research Council 2006). For instance, college students now choose whether to report their campus or permanent address on Census forms. This change was made, in part, because college students, unlike prisoners, can be active members of either community (or both). The Census has also revised how military personnel stationed abroad are counted, a population which shares many residency issues with incarcerated persons. In Franklin v. Massachusetts (1992), the Supreme Court ruled that federal employees overseas (mainly military personnel), could be counted at their “home of record” for legislative apportionment purposes. Noting a variety of historical cases, including that George Washington was counted as a resident of Virginia when his primary residence was the White House, the Court wrote that individuals need not be physically present at the time of the count and that those with an “allegiance or enduring tie” to a place should be included (see Ho Reference Ho2011).
Drawing on Franklin v. Massachusetts (1992), Dale Ho (Reference Ho2011) argues that incarcerated populations also have an enduring tie to their home communities for several reasons. Both military personnel overseas and correctional populations reside in “total institutions,” which heavily restrict their physical surroundings and social interactions (Goffman Reference Goffman1961). Like service members abroad, incarcerated persons have little to no contact with the community in which they are incarcerated. Instead, both groups retain social ties to their home communities. Moreover, physical barriers, such as tall walls or fencing and a series of locks separate prisoners and service members from the surrounding area. With these barricades in place, prisoners and military personnel use few community resources such as roads, schools, or parks. Also, incarcerated persons do not use the local courts, rather they are processed by the committing county’s court system (i.e., urban ones). In contrast, military personnel are often processed through local courts, thus prisoners may have more of an enduring tie to their home communities than military personnel. In fact, perhaps because of the sequestering characteristics of total institutions, legislators do not view incarcerated persons in their districts as constituents. When polled, legislators view prisoners from their home districts who are incarcerated elsewhere as their constituency more so than prisoners incarcerated in their districts who otherwise have no ties there (Stinebrickner-Kauffman Reference Stinebrickner-Kauffman2004). Taken together, these features suggest that incarcerated persons have an enduring tie to their home communities.
Yet despite such commonalities, Franklin v. Massachusetts (1992) has not been extended to correctional populations. Additionally, parole residency requirements ensure that ex-prisoner allegiances to their original home communities will continue post-release, perhaps more so than military personnel. Furthermore, because military personnel retain the right to vote, the counting of military personnel elsewhere would only influence representational equality, not vote equality.
Indeed, a recent court decision argues that prison gerrymandering is a unique threat to both electoral and representation equality at once. In Calvin v. Jefferson County (2016), a federal district judge ordered a Florida county, in which nearly ten percent of its population is incarcerated in a federal prison, to exclude federal prisoners from county-level district apportionment, stating that a “blind reliance on census data can lead to unconstitutional results.” Referencing prior representation cases, Judge Walker wrote:
What none of these cases held was that a state or local government could draw districts in a way that violates both electoral and representational equality. Such a districting scheme would deny all denizens of some districts—voters and nonvoters alike— equal protection of the laws. It would of course dilute the voting strength of voters, but it would also dilute the representational strength of those voters and of their nonvoting neighbors. A scheme that violates both of these principles is unconstitutional under any interpretation of one person, one vote.
Importantly, Calvin v. Jefferson (2016) considers county apportionment in a sparsely populated county with a federal prison. In the present study, we test Walker’s argument examining state legislative apportionment in which districts are four times more populous than Jefferson County as a whole and by including the impact of apportionment schemes on the districts where prisoners lived before their incarceration as well as the districts to which prisoners are sent.
Today, correctional populations are the only non-voter group to be denied their right to equal representation. In contrast, non-citizens and children are counted in the districts they reside, because, regardless of their non-voting status, under the current interpretation of one person, one vote, all persons have the right to equal representation. Additionally, non-voters can make use of constituent services offered by legislatures. For instance, they can engage with their representatives in events such as town hall meetings or visit district offices for services such as help with filing official forms. Nonetheless, as noted above, legislators with prisons in their districts often don’t view prisoners as constituents nor can incarcerated individuals engage with or use the resources of their representative in the same manner as other non-voting populations (Stinebrickner-Kauffman Reference Stinebrickner-Kauffman2004). In sum, they are a unique non-voting population in terms of representation in that they are moved without their consent, sequestered from outside interaction, and disconnected from the local community and official representatives.
Given this uniqueness and recent public interest, some states have reconsidered how prisoners are counted for legislative apportionment. Indeed, opting to exclude prisoners from population counts for redistricting purposes was only recently made feasible; prior to 2010, the Census released the group quarters information too late to be used in the redistricting process. In part due to public demand though, the Census released the 2010 group quarters information earlier than usual. Thus New York and Maryland were able to implement new laws requiring incarcerated persons to be counted at their home addresses for the 2010 redistricting process (McDonald Reference McDonald2011). California and Delaware since passed similar legislation which will be put into effect for the 2020 redistricting. Meanwhile Colorado, Michigan, and Virginia passed laws banning or discouraging local governments from prison gerrymandering (Wagner Reference Wagner2015). Moreover, a number of local municipalities across the country have elected to either exclude prisoners from apportionment or count them elsewhere (see Prison Policy Initiative for a complete list). Still, the vast majority of state and local governments continue to count prisoners as residents of correctional facilities and in the era of hyperincarceration, disadvantaged communities of color may be underrepresented because of this.
Hyperincarceration and Political Outcomes
The United States restricts current and former felons from voting to a greater extent than any other modern democracy (Uggen and Manza, Reference Uggen and Manza2002). Perhaps not surprisingly, a well-established line of research shows that incarceration has influenced political outcomes (Burch Reference Burch2012; Manza and Uggen, Reference Manza and Uggen2006). For instance, Christopher Uggen and Jeff Manza (2002) estimate that felon disenfranchisement has altered the outcomes of several U.S. presidential and congressional elections. Additionally, due to racial disparities in imprisonment, Whites enjoy inflated political power due to felon disenfranchisement laws (Behrens et al., Reference Behrens, Uggen and Manza2003). The racial motives behind these laws were unconcealed: proponents argued for the need to address the “menace of negro domination” and “preserve the purity of the ballot box” (Alabama 1901; Washington v. State 1884). Beyond silencing ex-felons, other work finds significant spillover effects; families of incarcerated persons are less likely to vote and residents of communities with high levels of incarceration are approximately half as likely to vote (Burch Reference Burch2014; Lee et al., Reference Lee, Porter and Comfort2014).
In all, there is ample evidence that disenfranchisement suppresses the political voices of people of color and benefits the White majority. To date, research has largely focused on the impact of mass incarceration on voting opportunities and election outcomes; we do not know whether or to what degree incarceration affects equal representation, a form of inequality that emerges during districting, well before ballots are cast. Yet disenfranchisement and representation differ beyond when inequality is produced, specifically in terms of who bears the consequences.
Disenfranchisement is, in part, an individual’s punishment for breaking the law. Importantly, disenfranchised felons are counted as residents for the sake of apportionment. In contrast, by counting prisoners elsewhere from their home communities, it is not the prisoner whose vote or representation is weakened or disenfranchised, but rather the prisoner’s home community that receives less representation in light of that individual’s incarceration. This is, in fact, another form of spillover effect of incarceration on top of those already identified in the literature. Finally, prisoners’ representation is not randomly distributed among districts or shifted to districts similar to their home districts; the representation that prisoners are constitutionally guaranteed instead goes to mostly White districts outside of urban areas from which prisoners disproportionately arrive.
Hyperincarceration and Representation
Political, economic, and residential patterns of racial inequality explain how mass incarceration may affect political representation. As the concept of one person, one vote and voting rights was defined in the 1960s, the United States was entering its most residentially segregated era (Massey and Denton, Reference Massey and Denton1993). Today, the average Black person lives in a neighborhood that is 45% Black and only 35% White, while the average White person lives in a neighborhood that is 75% White and only 8% Black (Logan and Stults, Reference Logan and Stults2011). Meanwhile, a racialized criminal justice system expanded dramatically (Alexander Reference Alexander2010; Beckett Reference Beckett1997; Garland Reference Garland2001; Jacobs and Jackson Reference Jacobs and Jackson2010; Wacquant Reference Wacquant2000, Reference Wacquant2001) and as a result, prison beds were in demand. With the decline of urban areas as economic and political power bases and rural communities also in economic turmoil, politicians outside of urban areas began competing for prison contracts in their districts (Beale Reference Beale1996; Schlosser Reference Schlosser1998; Wilson Reference Wilson1987). Within a short period of time, prison construction in suburban and rural areas was booming; for example, in the height of the prison boom, twenty-eight of twenty-nine new correctional facilities in New York were built upstate (Schlosser Reference Schlosser1998).
Thus, the prison boom shifted economic and political interests to non-urban, primarily White areas while disadvantaging urban areas.1 This resulted in the diffusion of non-White populations from urban areas into suburban and rural White areas, often several hundred miles away from their homes (Mumola 2000). The combination of non-urban prison locations, residential segregation, and racial inequality in incarceration may impact equal representation, but prior research has not yet explored the magnitude of any impact or whether this is the case. By underestimating non-White population counts in urban areas, incarceration may also weaken both the ability to qualify as majority-minority districts and the ability to litigate Voting Rights Act suits claiming racial discrimination in district apportionment. Now known as the prison industrial complex, the codependence of politics, economics, and incarceration has become a powerful force in modern society (Schlosser Reference Schlosser1998; Wacquant Reference Wacquant2009) and helps illuminate how incarceration may distort representation.
In sum, we draw on diverse literatures to understand how incarceration might influence equal representation. Historical background on representation reminds us that threats to representation have persisted throughout American history and racial inequality remains at the forefront both historically and presently. Adding to this picture, changes in the economy and politics produced a racialized criminal justice system that moves urban non-White residents to more rural White communities where they are counted as residents yet are not participatory members.
The Current Study
In this study, we assess whether, and the extent to which, incarceration distorts representation in the Pennsylvania legislature. Given the unprecedented recent growth of incarceration, we examine the degree to which counting prisoners in this manner shifts political power geographically by inflating voices outside of urban areas while stifling urban ones and its impact on non-White representation. More generally, we investigate the degree to which counting prisoners this way may influence both representational and vote equality. This study departs from existing work on representation to focus on a process that occurs before district lines are drawn. Moreover, we build on research on the missing men phenomenon by assessing how counting missing men elsewhere further damages non-White communities (Pettit Reference Pettit2012; Wolfers, et al., Reference Wolfers, Leonhardt and Quealy2015). We also move beyond this body of research by asking whether and how incarceration influences representation for communities not plagued by hyperincarceration (Wagner Reference Wagner2002). Unlike previous research, we simultaneously assess the impact of incarceration on representation for the communities that may benefit from hyperincarceration as well as those harmed by it.
Although we focus on Pennsylvania, it is noteworthy that Pennsylvania is similar to the country overall on key characteristics. For instance, the state’s Black population is close to the national average (11.5% in Pennsylvania; 13.2% nationally in 2010), and is largely urbanized. In terms of imprisonment, Pennsylvania incarcerates 850 adults per 100,000 compared to 910 nationally (Kaeble and Glaze, Reference Kaeble and Glaze2016).
The Pennsylvania state house legislature is comprised of 203 districts which are drawn by an independent commission every ten years, following the release of each decennial census. Representational equality in the form of one person, one vote, requires that legislative districts be of roughly equal population sizes. To ensure equal representation, Pennsylvania determines legislative district size requirements by dividing the total state Census population by 203 and requiring that all districts be within five percent in either direction of this number (PA Constitution Article II, Sections 16-17). Thus any district whose population is either above or below five percentage points of a given year’s population size is in violation. In 2010, the lower and upper bounds are 59,455 and 65,702 residents, respectively. Although the number of districts in Pennsylvania’s state house is second only to New Hampshire, because of Pennsylvania’s high population, the average constituents per district is the nineteenth largest in the country and near the national average of 55,973 (National Conference of State Legislatures n.d.).
Data
We leverage three sources of data to construct a dataset of Pennsylvania’s 203 state house legislative districts: the Census, the Pennsylvania Department of Corrections, and the Pennsylvania Reapportionment Commission. The Pennsylvania Reapportionment Commission’s website2 provides the 2013 shapefiles of each district, imported in ArcGIS 10.1.3 We then match demographic data from the Census STF1 2010 file to our 203 districts. All Census data were downloaded from the Social Explorer website. Every Census block is assigned to its corresponding house district in 2010 using a spatial join in ArcGIS 10.1. Together, the Census and redistricting data provide us with the demographic characteristics of all 203 Pennsylvania districts.
As with the United States overall, the vast majority of individuals incarcerated in PA are state prisoners. State prisoners include individuals convicted of a felony offense, typically sentenced to a year or more behind bars. To remove state prison populations from district population counts, we rely on data from the Pennsylvania Department of Corrections. We use the publicly available 2010 PA Department of Corrections Annual Statistical Report to obtain information on the location of state prisons and their respective population counts. The Annual Report also provides us with prisoner racial demographic information and counties of origin, which we use to return prisoners to their pre-prison districts.
County jail populations, in contrast to state prisoners, comprise approximately one third of the total correctional population (Kaeble and Glaze, Reference Kaeble and Glaze2016). Jails individuals awaiting trial and often individuals serving sentences of less than a year. To remove and return jail populations, we use the Census’ group quarters information to obtain county jail population counts. We also remove federal prisoners using group quarters information. Pennsylvania is home to four federal correctional facilities but because the bulk of federal prisoners are from out of state, we do not return them to their home districts in our counterfactual analysis. Thus our analysis examines the effects of local, state, and federal incarceration on representation in Pennsylvania.
To assess the geographic type of districts, we define urban districts as those located primarily in the central city of a metropolitan statistical area in a non-rural county (MSA). Suburban districts are districts that are primarily part of a MSA but not a central city, and rural districts are those identified by Pennsylvania’s legislature as low population density (Center for Rural Pennsylvania). Under these definitions, approximately 77% of Pennsylvania’s population lives in suburban or urban districts.
Analytic strategy
We use a counterfactual approach to assess the impact of incarceration on representational and vote inequality in Pennsylvania as well as racial and geographic representation. Our counterfactual condition is state legislative representation when prisoners are counted in their home districts instead of districts where they are incarcerated. To construct this counterfactual, we first remove local, state, and federal prisoners from district population counts. To return state prisoners, we begin our allocation strategy by using their county of origin from the Pennsylvania Department of Corrections reports, the smallest geography for which that data is available. As most Pennsylvania prisoners are released on parole, they are legally required to return to their county of origin (PA DOC 2015). For local prisoners, we use their county of incarceration because the overwhelming majority of jail inmates are incarcerated in their home county (Zajac and Kowalski, Reference Zajac and Kowalski2012).
Next, we allocate every state and local prisoner back to census blocks in their original county using racial, ethnic, and class demographics of neighborhoods and prisoners. More specifically, using 2010 SF1 census block data and 2008-2012 ACS 5-year census tract data, we first calculate an estimate of each census block's portion of the county’s population by race, ethnicity, and educational attainment (tracts are the smallest geography with educational attainment data available). We then use national prisoner educational attainment data by race and ethnicity from the 2004 Survey of Inmates in State and Federal Correctional Facilities to return prisoners accordingly based on the portion of the county's population of a given race, ethnicity, and educational attainment in a given block (U.S. Department of Justice 2007).
Consider a hypothetical county comprised of two census blocks that has eighteen prisoners to return; one is White and has a college degree, two are Black and have college degrees, six are White and have high school diplomas, and nine are Black and have high school diplomas. Both census blocks have identical total non-incarcerated populations. In terms of race, Block A is 80% White and 20% Black, Block B is 80% Black and 20% White. Block A is split evenly between high school and college degree recipients for Blacks and Whites, whereas Block B is primarily populated with residents who did not graduate college, except for 10% that are Black college graduates. Thus, we return the White college degree recipient to block A, as well as four White high school graduates, one Black college graduate, and one Black high school graduate for a total of seven returning prisoners. Block B would also receive one Black college graduate, but also eight Black and two White high school graduates, for a total of eleven returning prisoners.
Once our counterfactual is complete, we can then examine our three research objectives. First, we assess how much districts grow or shrink and produce representational inequality as a result of hyperincarceration and whether any are in violation of the Supreme Court’s one person, one vote rule. Second, we examine the extent to which incarceration shifts political power geographically, from urban to non-urban districts—a form of vote inequality. Third, we estimate how racial representation is affected to determine whether incarceration creates another form of vote inequality in Pennsylvania. We achieve this by calculating the average change in a resident’s district for Blacks, Latinos, and Whites.
Results
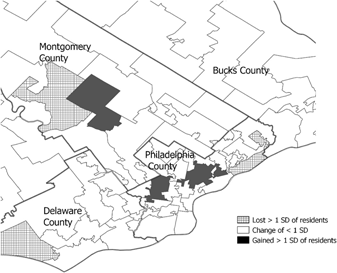
The average district population change in our counterfactual, when persons are removed from districts where they are incarcerated and returned to their pre-prison districts, is nearly zero. However, the average masks substantial variation in residents gained and lost; the standard deviation is 837 residents. The change for all 203 districts appears in the Appendix, but we focus on the thirty-four districts which gained or lost more than 837 residents. First, we analyze the spatial pattern of these districts. The Pennsylvania district map in Figure 1 denotes districts that lost one standard deviation or more of residents as well as districts that gained more than one standard deviation in residents. Figure 1 illustrates that districts which lose the most residents are concentrated in central and western Pennsylvania, the more rural portions of the state. In contrast, the districts that gain the most are located in southwestern (Pittsburgh), eastern (former industrial cities such as Allentown and Reading), and southeastern Pennsylvania (Philadelphia).
Estimated PA Legislative District Population Change, 2010

As nearly one third of Pennsylvania’s population lives in Philadelphia, Figure 2 provides a closer look at this area. This map shows that three of the districts (two of which are contiguous) that gain more than one standard deviation are located in the heart of Philadelphia’s African American neighborhoods. District 70, northwest of Philadelphia, which also gains more than 837 new residents, contains Norristown, a predominantly Black and Latino municipality. Turning to the three districts which lost more than 837 residents in Figure 2, two of the three are located outside of Philadelphia’s urban core, whereas district 173, located in northeastern Philadelphia, contains Philadelphia’s main jail facilities.
Estimated Southeastern PA Legislative District Population Change, 2010

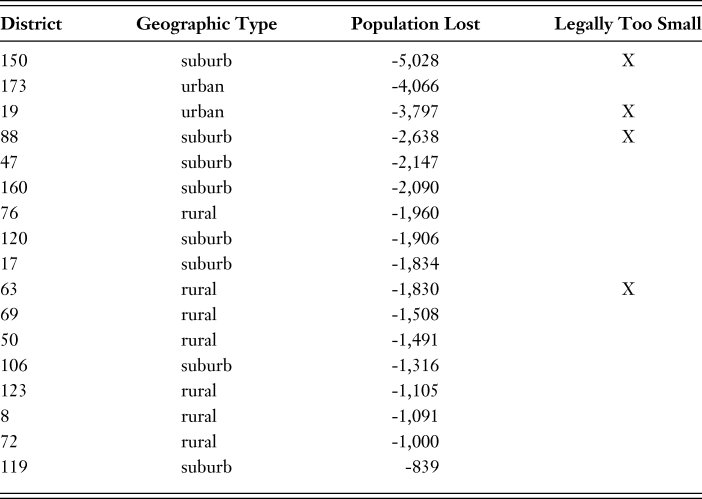
To further examine the seventeen districts with more than one standard deviation in population loss, Table 1 shows the geographic type as well as the constitutionality of each district.4 The results indicate that after prisoners are removed and returned, four districts are legally too small to qualify as a district with prisoners returned to their pre-prison districts. In other words, representational equality, which contemporary American democracy hinges on, is not achieved in four districts. For example, district 150, located in Montgomery County, lost the most residents (n = -5,028), because it includes Graterford State Correctional Institution and Montgomery County’s jail. Overall, these districts account for 5.6% of the Black and Latino population of Pennsylvania—including prisoners—and 9.1% of Pennsylvania’s White population. This shows that the location of prisons and jails shifts representation toward White populations and away from Black and Latino communities.
Estimated PA Legislative Districts with Highest Constituent Loss, 2010

Table 1 also shows that prison location fuels misrepresentation with regard to the urban/rural divide. Indeed, approximately 88% of these districts are non-urban. The two urban districts in Table 1 (19 and 173) lose a high number of residents because they contain Pittsburgh and Philadelphia’s main county jails, so for both districts, the residents lost come from that same urban county but live in neighboring districts. Thus among districts with the most “phantom constituents,” the majority are located outside the urban areas from which the majority of prisoners are drawn (Wagner Reference Wagner2002). While working as an advisor to Bob Casey’s 1986 gubernatorial campaign, James Carville famously described Pennsylvania’s state politics as Philadelphia and Pittsburgh with Alabama in between. In American politics in general, there is a significant urban/rural divide in voter preferences, one that is often used in gerrymandering (Gaskins and Iyers, 2012). However, our results suggest that incarceration, like the urban/rural divide in voter preference, buttresses Republican advantages even without partisan gerrymandering (Chen and Rodden, Reference Chen and Rodden2013; Goedert Reference Goedert2014). The results from Table 1 indicate that incarceration leads to an overrepresentation of non-urban voters in democratic processes via rural vote inflation due to prison location. Suburban and rural vote inflation, importantly, is only one half of the potential effects of prison gerrymandering, as prison location may also lead to underrepresentation of urban voters via vote dilution in their home communities.
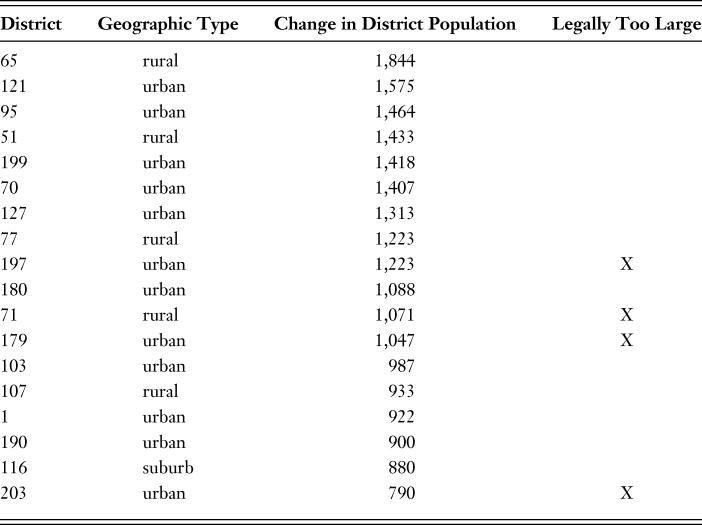
Table 2 shifts attention to the districts that gained the most constituents. Table 2 shows that after prisoners are returned to their pre-prison districts, four districts are too big to be a district. In other words, approximately 263,502 PA residents are constitutionally underrepresented. We include district 203 in Table 2 because it is legally too large, even though it adds less than one standard deviation in residents and has the 19th largest gain of the 203 districts. Regarding geography, all four districts in violation are urban or include a central city in a rural county; 197, 179, and 203 are located in Philadelphia and 71 contains the central core of the Johnstown MSA in an otherwise rural county. Moreover, of the districts in Table 2 that expanded by more than one standard deviation, 65% are urban. Overall, the districts that gained more than one standard deviation of population represent 21% of the Black and Latino population, but only 6.5% of the White population before our counterfactual. Furthermore, the magnitude of the effects in Table 2 is much larger than those in Table 1; only one district gained more two standard deviations in residents (Table 1) whereas ten districts lost more than two standard deviations in population (Table 2). This indicates that prior work that looked only at where prisons are and not where prisoners come from underreported the impact of prison gerrymandering on political representation.
Estimated PA Legislative Districts with Highest Constituent Gains, 2010

Note: Out of all 203 districts, district 203 has the 19th largest gain but is legally too large.
The above results suggest that districts not only rely on prison populations to achieve representational equality, but the presence of prisoners in districts also produces vote inequality. In other words, voters have more influence outside of urban, disproportionately White portions of the state because of prisoners.
To specifically examine whether incarceration affects representation for White and non-White residents differently, we consider how much district change would grow in our counterfactual. If the average White, Black or Latino person’s district grows in our counterfactual, then prisoners are more often counted elsewhere, thus weakening the power of the average White, Black or Latino vote because the non-voting prisoners in their communities have been moved to other districts with fewer people of the same race. On the other hand, if the average White, Black or Latino person’s district shrinks, it means that they live in districts where prisoners currently inflate the power of their vote in state elections because there are more non-voters in the district than there would be were prisoners to be counted in their home communities.
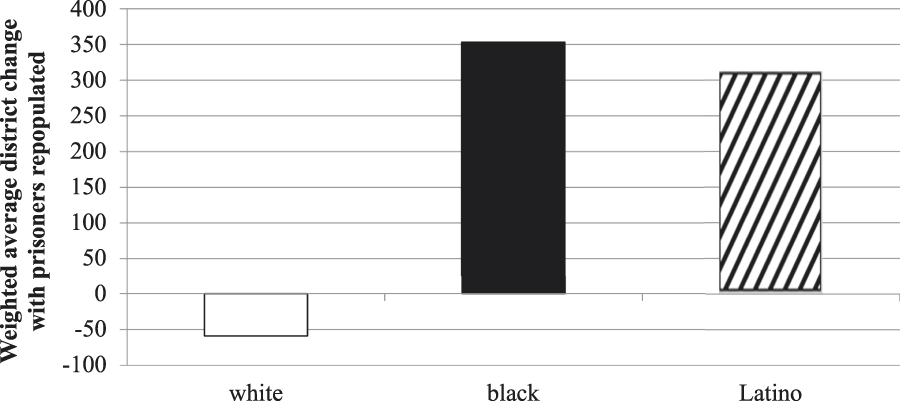
Figure 3 shows that prison location benefits the typical White voter and weakens the average Black and Latino voter’s representation, indicating that incarceration leads to both representational and vote inequality. Our calculations show that the average White person’s district would lose roughly fifty-nine individuals in our counterfactual, with prisoners counted in their pre-prison districts. In other words, prisoners are artificially inflating the average White person’s voting power and representation in their district because prisoners make White districts’ total populations grow but do not affect the voter population in that district. Implicit in that calculation is the fact that Black and Latino voters live in districts that have lost more population to incarceration than they gain. Thus when we return prisoners to their pre-prison residences, the average Black and Latino voter’s district gains approximately 353 and 313 voters respectively. In short, Black and Latino voters are being diluted in comparison to White voters because Blacks and Latinos are less likely to live in districts in which prisoners inflate the number of non-voting residents compared to Whites.
District Size Change by Race/Ethnicity

In general, differences of a few hundred residents are relatively small compared to the average size of a district (roughly 60,000). However, some districts have as few as 41,000 voting age adults and fewer than 20,000 votes were cast in approximately 78% of the competitive races in 2014 (more than half of the House ran opposed in the general election and contested primaries had even lower turnout). Additionally, our counterfactual presents conservative estimates of the impact of incarceration. Nonetheless, Figure 3 illustrates the unequal representation of Black and Latino adults as prisoners and also the impact of prison location on average representation by race and ethnicity. Scholars of hyperincarceration have shown the devastating, localized effects of incarceration on specific neighborhoods (Burch Reference Burch2014; Clear Reference Clear2007). This analysis confirms that similar inequalities extend to political districts as well.
In all, were incarcerated persons counted in their communities, over 100,000 Black residents of Philadelphia (roughly 20% of Philadelphia’s Black population) would live in districts deemed too large for Pennsylvania’s districting to meet the Supreme Court’s equal representation standard. Additionally, three of the four districts that grow too large are majority-minority districts; if prisoners are counted as living in their residence of origin, there is a substantial likelihood that an additional majority-minority district in Philadelphia would be necessary to satisfy the Voting Rights Act requirements.
In sum, our results indicate that hyperincarceration affects political representation in several ways. First, four districts violate representational equality via district size requirements, most of which are rural or suburban districts. The results also indicate that non-White political representation is diluted considerably because Black and Latino residents are disproportionately spread across geographic regions via incarceration. Finally, urban political voices are substantially underrepresented because of incarceration; three of the four districts that are too large according to district size requirements are urban.
Discussion and Conclusion
Equal political representation is a bedrock principle of modern representative democracy. However, representative American democracy is also defined partly by its racial ideology, from the Three-Fifths Compromise, to more recent efforts to deny voter access via voter identification laws, to the effort to overturn the one person, one vote principle in response to Latino immigration (Evenwel v. Abbott Brief by Cato Institute 2015; Lipton and Urbina, Reference Lipton and Urbina2007). Using Pennsylvania state legislative districts, we show how incarceration and American concepts of equal representation combine to create “phantom constituents” and racially unequal political representation. The incarcerated are not only missing from their communities, they are also benefitting other communities.
In this study, we suggest that traditional debates over gerrymandering, analyzed as the process of drawing of boundaries around stable, residential populations (Chen and Rodden, Reference Chen and Rodden2013; Goedert Reference Goedert2014), may be missing a critical issue. An additional form of racial gerrymandering occurs before political boundaries are drawn by the impact of prisons on the geographic spread of racial minorities. As such, we show that the average White vote’s impact is stronger than normally considered because prisons artificially inflate majority White districts’ populations while shrinking the average Black and Latino vote. The same is true about suburban and rural vs. urban districts. By and large, hyperincarceration not only drains potential voters out of urban, Black and Latino districts, it also artificially inflates the population in White, suburban and rural districts without adding a single voter to those districts. In other words, we find substantial evidence of vote inequality.
This form of vote inequality recently drew national attention after the release of Florida’s redrawn congressional districts, as previous redistricting lines were ruled illegal. New districts lines packed eighteen prisons and jails into one district, Florida’s 5th. With thousands of “captive constituents,” Florida’s 5th congressional seat could be won by a Republican candidate. As one Florida state legislator described it, “You draw [a district] in such a fashion so perhaps, a majority, or maybe not a majority, but a number of [Black residents] will live in the prisons, thereby not being able to vote” (Dixon Reference Dixon2015).
While such examples are powerful, we demonstrate the impact of prison location on legislative representation by looking at all Pennsylvania districts. Indeed, four districts in Pennsylvania are too small according to the Supreme Court’s one person equals one vote requirement once we return prisoners to their counties of origin, the majority of which are outside of the urban counties from most prisoners originate. On the other hand, at least four districts grow too large according to the same Supreme Court ruling once prisoners are returned, three of which are in Philadelphia.
Although four districts represent a small percentage of the state legislature, it means that over 100,000 Black residents of Philadelphia do not experience representational equality as defined by the Supreme Court. While much research finds that incarceration has far reaching consequences on social and political life (see Wakefield and Uggen, Reference Wakefield and Uggen2010 for a review), we find that unequal political representation is a perhaps more insidious consequence of hyperincarceration that shifts political power away from urban people of color and toward rural, predominantly White communities. Over half a century ago, the one person, one vote rule was created in response to racial underrepresentation. Today, racial underrepresentation has reemerged via a racialized system of punishment.
That same logic may also promote racial inequality through other, seemingly race-neutral means. For example, any funding formula that relies on Census population counts may misappropriate funds due to how correctional populations are counted in their formulas (for an analysis of federal programs using populations based funding formulas, see Reamer Reference Reamer2010). As our counterfactual demonstrates, this potential inequality not only benefits rural areas but also may starve urban centers of much needed support. On the other hand, prison facilities rely on some local resources like water, thus changing population counts for resource allocation may penalize districts with prisons. In light of this, we suggest that prisoners be counted in their home districts specifically to achieve equal representation. Resource allocation is a separate issue, which states can decide whether and how to address.
This study also contributes to a growing literature on the consequences of mass incarceration for residents of Black and Latino communities. For instance, studies show that the contemporary criminal justice system (re)shapes residents’ daily life as well as long-term Black and Latino outcomes (Rios Reference Rios2011). Yet beyond these more overt implications, and similar to research on race and the growth of law and order politics (e.g. Mendelberg Reference Mendelberg2001), this study shows that the carceral state also has indirect effects both inside and outside of non-White communities by skewing political representation toward rural and suburban White communities and away from urban Black and Latino communities. This study highlights one of the many deleterious effects of incarceration on racial equality via the combination of American concepts of equal representation, racial segregation, and transformations in national politics and the economy that led to hyperincarceration and the construction of rural prisons.
Since our study is the first to our knowledge to use a counterfactual approach to assess the impact of incarceration on representation, we view our work as the first step in understanding this topic. Consequently, limitations are worth considering. For example, Philadelphia—where roughly 40% of Pennsylvania’s non-White population lives—is split into twenty-six districts. This may make Pennsylvania a unique case in which the impacts we identify are greater than in other states with fewer districts that may then be more likely to include both the home community and prison in the same district. On the other hand, Pennsylvania’s many districts may have spread the returning prisoners across multiple urban districts, thus minimizing the impact on any single district. Additionally, as discussed earlier, our methods represent a conservative estimate of the impact of prison location on redistricting, and more precise information about the origins of prisoners may identify more districts, including majority-minority districts, at risk of being representationally unequal. Future work should explore whether our findings in Pennsylvania are consistent with other states as well as finer grained approaches to return prisoners to specific neighborhoods in counterfactual simulations.
Although more research is needed, a discussion of the policy implications is warranted, especially considering the Supreme Court’s decision to hear a case challenging the one person, one vote rule and its subsequent ruling. In Evenwel v. Abbott (2016), the Court left open the possibility for states to privilege voting equality over representational equality in future redistrictings. Moreover, perhaps unlike other drivers of racial inequality, such as incarceration and health (Schnittker et al., Reference Schnittker, Massoglia and Uggen2011), political representation is a form of racial inequality that can be easily remedied. States should explicitly consider how to count prisoners in future redistricting efforts. Otherwise, hyperincarceration will continue to produce unequal representation. But recent developments are positive.
In the past few years, public policy experts working to spread public awareness have achieved some success (e.g. Prison Policy Initiative n.d.). Partly in response to such efforts, there have been increased calls to exclude prisoners from redistricting processes (Wood 2014). However, our results indicate that this remedies only a portion of the problem. Without counting prisoners in their pre-prison districts, urban districts and non-White voters remain underrepresented. In 2005, Congress asked the Census Bureau to report on the feasibility of counting prisoners at their permanent addresses. The Bureau argued that such an undertaking would be cost prohibitive and involve a number of impediments (U.S. Census Bureau 2006). When the Census recently announced that it would not count prisoners at their homes in 2020 and invited public comments on the decision, nearly 100,000 Americans, including a group of senators responded, requesting a policy change (Kajstura Reference Kajstura2016; Wagner Reference Wagner2016). As of this writing, no changes have been made.
Yet Delaware, Maryland, and New York recently demonstrated that it is possible. With multi-agency collaboration and adequate resources and planning, these states counted prisoners at their pre-prison addresses and redistricted accordingly (see Wood 2014; McDonald Reference McDonald2011). States have prisoner addresses on hand to do so. As our counterfactual suggests, this state endeavor is critical to a representative democracy.
Estimated PA Legislative District Population, 2010