

Introduction
Mental disorders are the leading cause of disability worldwide (Kessler & Üstün, Reference Kessler and Üstün2008) and, among all disorders, depression is the leading cause, according to the World Health Organization (World Health Organization, 2017; Friedrich, Reference Friedrich2017). Mental health is influenced by social and economic conditions, including economic recessions such as that experienced by Ireland between 2008 and 2013 (Evans-Lacko et al. Reference Evans-Lacko, Knapp, McCrone, Thornicroft and Mojtabai2013). This study focusses on community mental health in Ireland since the end of the recession and examines the links between mental health, personal and demographic characteristics, and use of community health assets, such as hospitals and general practitioners (GPs; family doctors in primary care).
In 2007, the National Survey of Lifestyle, Attitudes and Nutrition in Ireland (SLÁN) found relatively low levels of psychological distress in Irish communities: most Irish adults had a reasonably high level of positive mental health, with better mental health associated with male gender, younger age, higher education and being in paid employment, among other factors (Barry et al. Reference Barry, Van Lente, Molcho, Morgan, McGee, Conroy, Watson, Shelley and Perry2009). In the 4 weeks before the 2007 survey, 7% of respondents had ‘probable mental health problems’, and these were associated with female gender, low educational attainment and loneliness, among other factors.
There is a paucity of information about community mental health in Ireland since the 2007 SLÁN survey. This is regrettable because Ireland experienced a sharp economic recession from 2008 until 2013, followed by an equally sharp recovery since 2014. Our group previously analysed European Social Survey data about happiness in Ireland during this period, using a scale that requests participants to rate their happiness on a scale from 0 (extremely unhappy) to 10 (extremely happy) (Jowell & Central Coordinating Team, Reference Jowell2007; Doherty & Kelly, Reference Doherty and Kelly2010). Mean happiness in Ireland was 7.9 in 2005 but by 2007 had decreased to 7.7, and continued to fall thereafter, reaching 7.5 in 2009 and 6.8 in 2012, as the effects of recession were most widely felt (Kelly & Doherty, Reference Kelly and Doherty2013).
By 2014, mean happiness in Ireland had recovered significantly to 7.2 out of 10, in line with the improving economy (Kelly, Reference Kelly2016). In 2016, Ireland was ranked 19th happiest country in the world out of 157 countries assessed in the World Happiness Report from the Sustainable Development Solutions Network (Helliwell et al. Reference Helliwell, Layard and Sachs2016). Suicide figures were also improving, with 554 suicides reported in 2011, 541 in 2012, 487 in 2013, 486 in 2014, 451 in 2015 (provisional figure) and 399 in 2016 (provisional figure) (National Office for Suicide Prevention, 2017). This reflects a 28% decrease (provisionally) in suicide over 6 years despite likely population growth. In 2016, the rate of non-fatal deliberate self-harm was the same as that in 2002, having fallen since 2010. Rates of psychiatric admission also fell during the recession and afterwards, from 489.5 psychiatric admissions per 100 000 population in 2008 to 396.1 in 2012, to 376.8 in 2016 (Daly & Craig, Reference Daly and Craig2016; Reference Daly and Craig2017).
These statistics indicating improving population mental health contrast significantly with public discussion about the psychological effects of Ireland’s recession. In 2013, 90% of respondents to one survey believed that depression, anxiety and mental health issues had increased in Ireland since the start of the recession (Cullen, Reference Cullen2013). This disparity between certain objective indices suggesting improvement (declining suicide, falling admissions) and negative public perceptions (90% reporting that mental health has deteriorated) might be explained by the fact that former set of statistics reflect mental health service provision and the latter may better reflect need. This is an important distinction because it is essential that mental health services are rooted firmly in evidence of need, so that resources are deployed appropriately. It is possible that, to date, services have failed to reflect or respond to true mental health need, especially during the recession.
To compound matters, there is preliminary evidence that the Irish recession did not affect everyone’s wellbeing equally. Among older adults, there was a post-recession reduction in wellbeing that was especially marked in women, those with poor health and those living in urban areas (Duffy et al. Reference Duffy, Mullin, O’Dwyer, Wrigley and Kelly2016). As well as identifying overall mental health need, then, it is also important to identify any people at particular risk of poor mental health as a result of recession, so as to target appropriate interventions and supports, especially as the economy strengthens. The mental health of migrants in Ireland merits particular attention in this regard (Wilson et al. Reference Wilson, Hennessy, Dooley, Kelly and Ryan2013).
The primary purpose of the present study was to assess mental health need in the community-dwelling population of Tallaght, a socio-economically deprived suburb of Dublin city, in post-recession Ireland, using methodologies similar to those used in previous studies of physical health need in this area (Long et al. Reference Long, O’Loughlin, O’Keefe and O’Dowd2002; Darker et al. Reference Darker, Whiston, Long, Donnelly-Swift and Barry2014; Reference Darker, Donnelly-Swift, Whiston, Moore and Barry2016), augmented with methodologies adapted from the 2007 SLÁN study of mental wellbeing, focussing particularly on mental health (Barry et al. Reference Barry, Van Lente, Molcho, Morgan, McGee, Conroy, Watson, Shelley and Perry2009).
In 2001, some of our research group studied lifestyle and family issues, chronic illness, disability and health care utilisation in this study area (Long et al. Reference Long, O’Loughlin, O’Keefe and O’Dowd2002). That study showed that the population of Tallaght had generally poor health care arrangements (35% of households had neither private health insurance nor entitlement to free, government-provided care) and 22% reported chronic illness in at least one householder.
A second study in 2014 showed the immediate effects of Ireland’s recession, with 13% fewer people in full- or part-time employment compared to 2001, and 67% reporting stress over the past year (an increase of 8% since 2001) (Darker et al. Reference Darker, Whiston, Long, Donnelly-Swift and Barry2014; Reference Darker, Donnelly-Swift, Whiston, Moore and Barry2016). One in five household members had a chronic illness (22%, unchanged since 2001) and 18% of households included one or more persons with a disability (an increase of 7%). These findings strongly indicated a requirement for more detailed analysis of mental wellbeing in this population and led directly to the present study.
The need for this work was further underpinned by the Healthy Ireland Survey 2017 which indicated that respondents living in deprived areas (such as Tallaght, our study area) were over three times more likely than those in more prosperous areas to report emotional, nervous and psychiatric problems (10% and 3% respectively), and that the 12-month prevalence of these conditions was 6% in the general population (Healthy Ireland, 2017). Again, however, the issue of community mental health was not addressed in any greater depth and as a result the 2007 SLÁN survey, conducted before Ireland’s economic recession, remains the most recent detailed academic study of community mental health in Ireland. Against this background, we identified a pressing need to study community mental health in post-recession Ireland, and we again selected the Tallaght area owing to its high level of deprivation and in order to optimise comparability with our previous work.
Methods
Aim
This study aimed to examine mental health in suburban Dublin in 2018 through a development and expansion of the methodology used in the 2001 and 2014 Tallaght Health Assets and Needs Assessment Studies (Long et al. Reference Long, O’Loughlin, O’Keefe and O’Dowd2002; Darker et al. Reference Darker, Whiston, Long, Donnelly-Swift and Barry2014; Reference Darker, Donnelly-Swift, Whiston, Moore and Barry2016) and the 2007 SLÁN study of mental wellbeing, focussing particularly on mental health (Barry et al. Reference Barry, Van Lente, Molcho, Morgan, McGee, Conroy, Watson, Shelley and Perry2009).
Design
A cross-sectional, face-to-face, community-based survey was performed in a random selection of households in Tallaght, a suburb of Dublin, Ireland (Kelly et al. Reference Kelly, Sorin, Barry, Whiston, Donnelly-Swift and Darker2018).
Setting and sampling
This study was based in 13 geographically defined ‘electoral divisions’ of Tallaght, a socio-economically deprived west Dublin suburb: Belgard, Glenview, Kilnamanagh, Kingswood, Millbrook, Oldbawn, Springfield, Avonbeg, Fettercairn, Jobstown, Killinarden, Kiltipper and Tymon. The methodology largely replicated that used in the 2001 and 2014 Tallaght Health Assets and Needs Assessment Studies, in order to optimise comparability and build on the established methodological strengths of the research group (Long et al. Reference Long, O’Loughlin, O’Keefe and O’Dowd2002; Darker et al. Reference Darker, Whiston, Long, Donnelly-Swift and Barry2014; Darker et al. Reference Darker, Donnelly-Swift, Whiston, Moore and Barry2016).
As is emphasised in A Vision for Change, Ireland’s national mental health policy, deprivation is strongly linked with mental health (Expert Group on Mental Health Policy, 2006) and therefore it was important to take account of deprivation when selecting the study sample. Ireland’s Small Area Health Research Unit (SAHRU) has developed a deprivation index for health and health services research. The SAHRU deprivation score was based on 2011 census data (the most recent census data available at time of study design) and utilises four indicators for the classification of deprivation: unemployment, low social class, not having a car and residing in government-funded housing (Kelly & Teljeur, Reference Kelly and Teljeur2013). Deprivation scores range from 1 to 10, where 1 is least deprived and 10 is most deprived. In keeping with the 2014 study, a deprivation score of 9 or 10 was taken to indicate an area of high deprivation and a deprivation score of <9 taken to indicate a lower level of deprivation (Darker et al. Reference Darker, Whiston, Long, Donnelly-Swift and Barry2014; Reference Darker, Donnelly-Swift, Whiston, Moore and Barry2016).
Multi-stage, cluster sampling was used in the present study, based on 2016 national census data and GeoDirectory (www.geodirectory.ie), the most comprehensive listing of Irish addresses available (on which national post-codes are based), stratified by level of deprivation so as to include seven electoral divisions in areas of high deprivation and six in areas of lower deprivation. All households in the relevant areas were divided into clusters of eight adjacent households, selected using systematic sampling following a random start. A total of 583 households were invited to participate via letter. Any household that declined was replaced with another household from the same cluster drawn from a reserve list assembled in the same fashion.
Procedure
Data collection took place between January and March 2018. Household invitation letters were sent to selected houses in each cluster outlining the purpose of the study, the topics that the survey would cover, how the house had been randomly selected, the proposed use of results and the proposed dates. The letter also stated that a researcher would call to the house to conduct the interview; participation was voluntary and participants were free to withdraw at any point. Local family doctors, local authorities and community centres were informed of the study in advance to optimise participation.
Each randomly selected household was called to in person a minimum of four times before being eliminated from the sampling frame. An information leaflet about the survey was also compiled and left with respondents or in their letterbox, to confirm the bona fides of the survey.
The timing of the in-person calls made to any household was spread across time of day, day of week and weekday versus weekend to obtain maximum effectiveness from the contact/re-contact process. In order to ensure most benefit was derived from each re-contact, interviewers called to any one household a maximum of twice in one 24-hour period, with a time interval of at least 3 hours between the first and second contact that day. In the cases where selected households were difficult to contact (e.g. those working outside the home, younger individuals, etc.), more than four contacts were required. At least one of the four required contacts was contacted in the evening time, and one at the weekend (Saturday). An upper limit of six contacts overall was set, unless the interviewer had an appointment made with an individual or no one was at home.
In each participating household, the person aged 18 years or more who was the primary carer was invited to be interviewed (‘respondent’). The primary carer was the person who managed the welfare and health of the family/household. In rented accommodation, this person was the one who paid the household bills or whose name was on the rent agreement. No direct inducements or monetary incentives were provided to respondents. A donation of €5 per completed interview was given to charity.
Interviewers with extensive experience in conducting research in sensitive areas (including mental health), trained and working with Behaviour & Attitudes (http://banda.ie), carried out the face-to-face interviews. Interviewers underwent a comprehensive training programme before commencement and were supervised and evaluated on a regular basis. Interviewers used computer-assisted personal interviewing (CAPI) techniques, whereby an interviewer uses a tablet scripted with a questionnaire to interview. The interview takes place in person and the interviewer is present to guide the respondent and enter the data. CAPI has a proven efficiency as a method of encrypted data collection with the capacity to optimise data quality and quality control. This technique has several advantages over pen and paper interview methods, including deploying a fully automated script, which removes interviewer error and minimises missing data, as well as real-time tracking of the data as it is being recorded (thus avoiding a separate data entry process).
CAPI also collects a range of logistical information regarding the interview itself which facilitates ongoing quality control of the interview process. For example, it is possible to review time-stamps for the start and end time, ensuring that interviews are conducted at the correct stated time and that the duration is appropriate; that is not too long (suggesting problems with the interview process) or too short (raising concerns about the interview being rushed). For purposes of quality control, 10% of interviews conducted by each interviewer were back-checked by telephone, whereby the respondent was contacted by telephone within 5–7 days of completing the survey and accuracy was ensured.
Full responses were received from all participating households (n=351) for all survey items in this study.
Measures
The study used the questionnaire from the 2014 Tallaght Health Assets and Needs Assessment Study conducted in this area (Darker et al. Reference Darker, Whiston, Long, Donnelly-Swift and Barry2014; Reference Darker, Donnelly-Swift, Whiston, Moore and Barry2016), with some minor refinements for ease of completion, supplemented with an adaptation of the instrument used in the 2007 SLÁN survey of mental wellbeing (Barry et al. Reference Barry, Van Lente, Molcho, Morgan, McGee, Conroy, Watson, Shelley and Perry2009). Both tools are fully validated and their properties are available in the respective study reports. To address the issue of poor literacy, our questionnaire was designed to be below the reading age of 11 years. Our full, combined questionnaire was piloted before commencement, resulting in only minor technical adjustments.
Demographic information
Data were collected regarding the respondent’s gender, age, nationality, marital status, highest level of education attained, employment status, house occupancy status and level of health cover (private health insurance or entitlement to free health care; i.e. a ‘medical card’). Each respondent was asked if the household included a person with chronic illness or disability, or a smoker, and about household use of healthcare resources (local hospital and GP) over the previous year.
General mental health
Respondents were asked five questions about general mental health derived from the earlier surveys, asking if they had (a) often felt lonely over the previous 4 weeks; or, over the previous 12 months, (b) experienced stress (Darker et al. Reference Darker, Whiston, Long, Donnelly-Swift and Barry2014; Reference Darker, Donnelly-Swift, Whiston, Moore and Barry2016); (c) felt sad, blue or depressed (for 2 weeks or more); (d) lost interest in most things like hobbies, work or activities that usually gave them pleasure (for 2 weeks or more) or (e) felt worried, tense or anxious most of the time (for a month or more) (Barry et al. Reference Barry, Van Lente, Molcho, Morgan, McGee, Conroy, Watson, Shelley and Perry2009).
Positive mental health
As in the SLÁN survey (Barry et al. Reference Barry, Van Lente, Molcho, Morgan, McGee, Conroy, Watson, Shelley and Perry2009), positive mental health was assessed using the Energy and Vitality Index (EVI) from the RAND (Research ANd Development) 36-item Short Form Survey (SF-36), developed at RAND as part of the medical outcomes study. This is a validated, widely used measure of positive mental health based on the occurrence and extent of energy and vitality over the past month (Ware et al. Reference Ware, Snow, Kosinski and Gandek1993; Kovess & Beaudet, Reference Kovess and Beaudet2001; Lavikainen et al. Reference Lavikainen, Fryers and Lehtinen2006). Respondents are asked four questions concerning their wellbeing over the previous 4 weeks and respond using a six-point scale, ranging from ‘All of the time’ to ‘None of the time’:
-
∙ Did you feel full of life (‘pep’)?
-
∙ Did you have a lot of energy?
-
∙ Did you feel worn out?
-
∙ Did you feel tired?
Each item is rated from 0 to 100, and a higher score indicates greater positive mental health (McDowell & Newell, Reference McDowell and Newell1996; Bijl & Ravelli, Reference Bijl and Ravelli2000).
Psychological distress
As in the SLÁN survey (Barry et al. Reference Barry, Van Lente, Molcho, Morgan, McGee, Conroy, Watson, Shelley and Perry2009), psychological distress was assessed using the five-item Mental Health Index-5 (MHI-5) from the RAND SF-36 questionnaire (Ware et al. Reference Ware, Snow, Kosinski and Gandek1993). This is a validated, widely used measure of non-specific psychological distress, usually related to anxiety and depression (McCabe et al. Reference McCabe, Thomas, Brazier and Coleman1996; Holmes, Reference Holmes1998; Ayuso-Mateos et al. Reference Ayuso-Mateos, Lasa, Vázquez-Barquero, Oviedo and Diez-Manrique1999; European Opinion Research Group, 2003; Friedman, Reference Friedman2005; Lavikainen et al. Reference Lavikainen, Fryers and Lehtinen2006; Houghton et al. Reference Houghton, Keane, Murphy, Houghton and Dunne2011). Respondents are asked five questions about their wellbeing over the previous 4 weeks and respond using a six-point scale, ranging from ‘All of the time’ to ‘None of the time’:
-
∙ Have you been a very nervous person?
-
∙ Have you felt so down in the dumps nothing could cheer you up?
-
∙ Have you felt calm and peaceful?
-
∙ Have you felt downhearted and blue?
-
∙ Have you been a happy person?
Each item is rated from 0 to 100, and a lower score indicates greater psychological distress (McDowell & Newell, Reference McDowell and Newell1996; Bijl & Ravelli, Reference Bijl and Ravelli2000). A respondent has a ‘probable mental health problem’ if their score is equal to or below 52 (Lavikainen et al. Reference Lavikainen, Fryers and Lehtinen2006).
Analysis
Anonymised data were stored, described and analysed using IBM Statistical Package for the Social Sciences (SPSS) Statistics (version 24). Data protection guidelines were adhered to and confidentially maintained at all times. All survey questions in the data file were checked against top-line frequency counts that were produced directly from the interviewing database. This was to ensure that the numbers in the data file reflected the numbers in the actual database and that no corruption or error occurred during the creation of the data file. Further checks were performed in SPSS including an item non-response analysis, examination of outliers, and further range and consistency checks.
For bi-variable analysis, we used the Student’s t-test and χ 2 tests as appropriate. We generated two multi-variable linear regression models with EVI and MHI-5 scores as the dependent variables. All of the demographic and clinical variables upon which we collected data were chosen for their possible relevance to the outcomes of interest and therefore all were included as independent variables in both multi-variable models, in order to optimise completeness and comparability across the models. We tested the models for multi-collinearity, which is when two or more variables are so closely related to each other that the model cannot reliably distinguish the independent effects of each. For this, we calculated a ‘tolerance value’ for each independent variable in each model; tolerance values below 0.25 indicate possible multicollinearity, and tolerance values below 0.10 indicate significant problems with multi-collinearity (Katz, Reference Katz1999).
Ethics
Before commencement, this study was approved by the Research Ethics Committee at St James’s Hospital and Tallaght University Hospital, Dublin [Reference 2017-11, List 41 (10)]. Written informed consent was obtained from each respondent.
Results
A total of 583 eligible households were invited to participate and interviews were completed in 351, yielding a response rate of 60.2%. However, 188 households (32.2%) declined to participate and 44 (7.5%) could not be contacted. These proportions did not differ between areas of high and lower deprivation (p>0.05 in all cases).
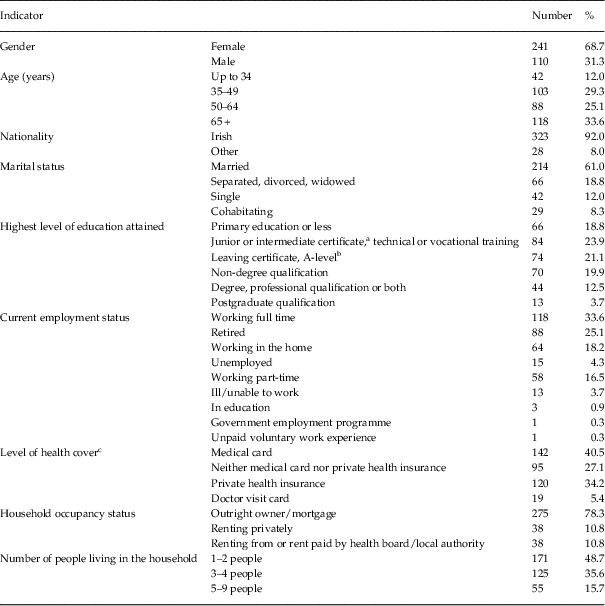
The mean age of primary carers was 53.9 years (s.d. 15.3); 68.7% were females; 61.0% were married; 57.2% were educated to secondary (high) school level or beyond; 33.6% were working full-time and 18.2% working from home (Table 1). One-third had private health insurance (34.2%) and 40.5% were entitled to free medical care provided by the state (i.e. had a ‘medical card’). A majority of respondents self-identified as ‘Irish’ (92%); the ‘non-Irish’ included people from the United Kingdom (n=6; 1.7%), Poland (n=4; 1.1%), Romania (n=4; 1.1%), India (n=3; 0.9%), Nigeria (n=3; 0.9%), Algeria (n=2; 0.6%), Belgium (n=1; 0.3%), Brazil (n=1; 0.3%), Bulgaria (n=1; 0.3%), Italy (n=1; 0.3%), Latvia (n=1; 0.3%) and Lithuania (n=1; 0.3%). A greater proportion of the non-Irish were educated to secondary (high) school level or beyond (78.7%) compared to the Irish (55.4%; χ 2 27.9; p<0.001).
Demographic and socioeconomic characteristics of primary carers in suburban Dublin, Ireland (n=351)

Full responses were received from all participating households (n=351) for all survey items.
a Stage examination taken at approximately age 15 years.
b Stage examination taken at approximately age 18 years.
c Some of these categories are not mutually exclusive. A ‘medical card’ entitles the bearer to means-tested, state-provided general medical (primary care) services; a ‘doctor visit card’ covers doctor visits only (not medicines).
Over three-quarters of respondents (n=275; 78.3%) were living in a house owned by an occupier (rather than rented); 84.3% (n=299) lived in a household comprising four people or fewer; 54.4% (n=191) of households included a person with a chronic illness; 10.8% (n=38) included a person with a disability; 35.6% (n=125) included a smoker; and majorities included at least one person who had used the local hospital for tests or treatment (n=182; 51.9%) or seen a GP (n=267; 76.1%) over the previous year. Our sampling technique ensured that approximately half of respondents (n=178; 50.7%) lived in areas of high deprivation.
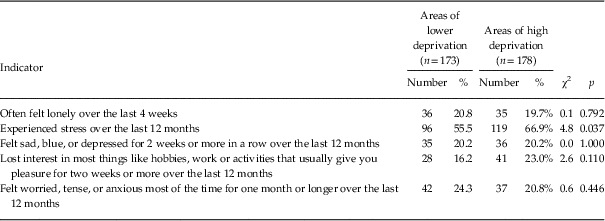
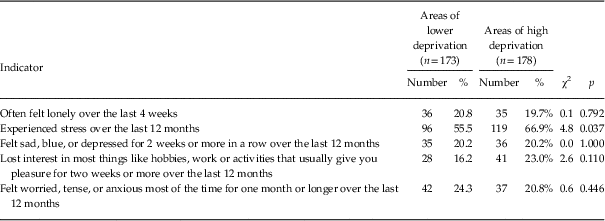
A majority of respondents (n=215; 61.3%) reported experiencing stress during the previous 12 months, with a slightly higher rate in areas of high (66.9%) compared to lower deprivation (55.5%; p=0.037; Table 2). Deprivation was not related to rates of loneliness (n=71; 20.2%); feeling sad, blue or depressed (n=71; 20.2%); loss of interest (n=69; 19.7%); or feeling worried, tense or anxious (n=79; 22.5%).
Key psychological indices among primary carers in suburban Dublin, Ireland in areas of lower and high deprivation (n=351)
Full responses were received from all participating households (n=351) for all survey items.
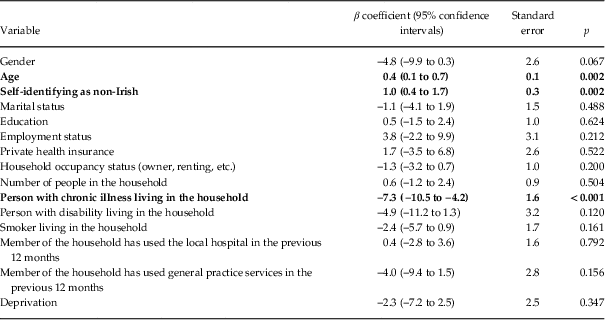
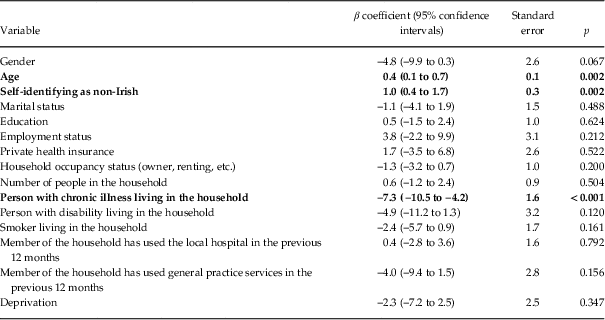
On bi-variable testing, mean EVI scores (59.3 overall; s.d. 23.3; with higher scores indicating greater positive mental health) were higher in males (64.2; s.d. 20.6) than females (57.1; s.d. 24.1; t=2.8; p=0.005), non-Irish (70.4; s.d. 17.6) than Irish respondents (58.4; s.d. 23.5; t=−3.4; p=0.002), and areas of lower (62.2; s.d. 21.8) compared to high deprivation (56.5; s.d. 24.4; t=2.3; p=0.021). On multi-variable testing, higher EVI scores were independently associated with not living with a person with a chronic illness [β −7.3; 95% confidence intervals (CI): −10.5 to −4.2; p<0.001], identifying as non-Irish (β 1.0; 95% CI: 0.4–1.7; p=0.002) and greater age (β 0.4; 95% CI: 0.1–0.7; p=0.002) (model r 2: 19.4%; p<0.001; Table 3). All tolerance values were >0.25, indicating no problems with multi-collinearity.
Multi-variable linear regression analysis of correlates of positive mental health in suburban Dublin, Ireland (n=351)
Full responses were received from all participating households (n=351) for all survey items.
The dependent variable was the Energy and Vitality Index (EVI) score from the RAND SF-36 questionnaire; a higher score indicates greater positive mental health (see text for details).
Model r 2: 19.4%; p<0.001. Bold type-face indicates statistical significance.
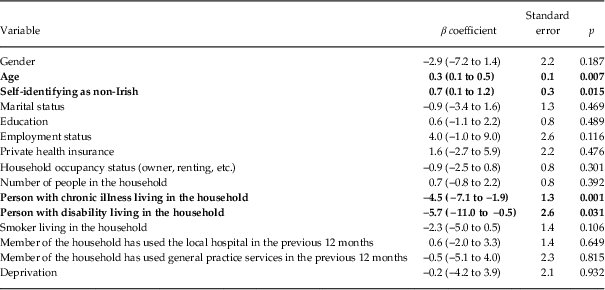
On bi-variable testing, mean MHI-5 scores (76.7 overall; s.d. 18.8) (with higher scores indicating less psychological distress) were higher in males (79.8; s.d. 18.5) than females (75.3; s.d. 18.9; t=2.1; p=0.034), and non-Irish (83.6; s.d. 13.3) than Irish respondents (76.1; s.d. 19.1; t=−2.7; p=0.009) but did not differ between areas of lower (78.1; s.d. 18.8) and high deprivation (75.3; s.d. 18.8; t=1.3; p=0.178). Using the established cut-off point of 52 or lower to indicate ‘probable mental illness’ (Lavikainen et al. Reference Lavikainen, Fryers and Lehtinen2006), 13.1% (n=46) of respondents had ‘probable mental illness’ over the previous 4 weeks. This did not differ between males (n=13; 11.8%) and females (n=33; 13.7%; χ 2 0.2; p=0.734), areas of lower (n=20; 11.6%) and high deprivation (n=26; 14.6%; χ 2 0.7; p=0.432), or Irish (n=45; 13.9%) and non-Irish respondents (n=1; 3.6%; χ 2 0.1; p=0.150). On multi-variable testing, higher MHI-5 scores were independently associated with not living with a person with a chronic illness (β −4.5; 95% CI: −7.1 to −1.9; p=0.001) or disability (β −5.7; 95% CI: −11.0 to −0.5; p=0.031), greater age (β 0.3; 95% CI: 0.1–0.5; p=0.007) and identifying as non-Irish (β 0.7; 95% CI: 0.1–1.2; p=0.015) (model r 2: 14.4%; p<0.001; Table 4). All tolerance values were >0.25, indicating no problems with multi-collinearity.
Multi-variable linear regression analysis of correlates of psychological distress in suburban Dublin, Ireland (n=351)
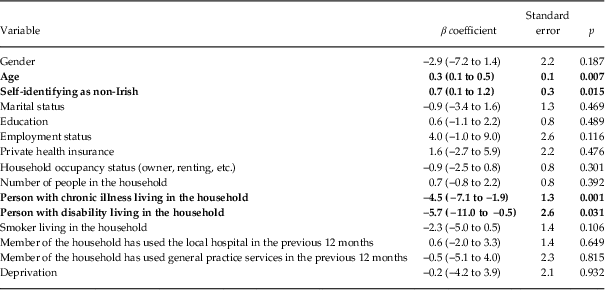
Full responses were received from all participating households (n=351) for all survey items. The dependent variable was the MHI-5 score from the RAND SF-36 questionnaire; a lower score indicates greater psychological distress (see text for details). Model r 2: 14.4%; p<0.001. Bold type-face indicates statistical significance.
Discussion
A majority of primary carers in suburban Dublin (61.3%) report experiencing stress over the previous 12 months, with a higher rate in areas of high (66.9%) compared to lower deprivation (55.5%). All summary indices of good mental health in our deprived, suburban study area were lower than those reported from a national sample in 2007 (Barry et al. Reference Barry, Van Lente, Molcho, Morgan, McGee, Conroy, Watson, Shelley and Perry2009): mean score for positive mental health in our study (59.3 out of 100, with a higher score indicating greater positive mental health) was lower than that in 2007 (68); our mean score for psychological distress (76.7 out of 100, with a higher score indicating less psychological distress) was also lower (82 in 2007); and our rate of ‘probable mental illness’ (13.1%) was higher (7% in 2007). We found that good mental health was associated with not living with a person with a chronic illness or disability, greater age and identifying as non-Irish.
Strengths and limitations
Our study has several methodological strengths. We performed a face-to-face, community-based study with a 60.2% response rate, using the most comprehensive sampling frame available (GeoDirectory), stratified by level of deprivation. Professionally trained interviewers experienced in mental health studies used standardised, validated tools replicating and expanding the methodologies of the 2001 (Long et al. Reference Long, O’Loughlin, O’Keefe and O’Dowd2002) and 2014 studies in this area (Darker et al. Reference Darker, Whiston, Long, Donnelly-Swift and Barry2014; Reference Darker, Donnelly-Swift, Whiston, Moore and Barry2016), with the addition of further validated questions to explore mental health in greater depth to optimise comparability with the 2007 SLÁN study (Barry et al. Reference Barry, Van Lente, Molcho, Morgan, McGee, Conroy, Watson, Shelley and Perry2009). CAPI was used to optimise data quality and reliability, and full responses were received from all participating households (n=351) for all survey items.
Limitations include possible variations in reporting behaviour among respondents as various non-health characteristics, including age, gender and education, may affect reporting (Groot, Reference Groot2000; Jylhä, Reference Jylhä2009; Layes et al. Reference Layes, Asada and Kepart2012; Darker et al. Reference Darker, Donnelly-Swift, Whiston, Moore and Barry2016). We controlled many of these factors by collecting relevant data and incorporating them into our analysis in order to identify and analyse relevant relationships. We did not, however, control for the respondent’s own health status and it is possible that this might introduce respondent bias; future studies could usefully examine this possibility. Another potential source of bias is a tendency for respondents to under-report mental illness in surveys of this type (Cannell et al. Reference Cannell, Marquis and Laurent1977). We addressed this by adding detailed, validated questions about mental health to this round of the survey in order to focus clearly on this topic (Barry et al. Reference Barry, Van Lente, Molcho, Morgan, McGee, Conroy, Watson, Shelley and Perry2009), and ensuring that interviewers were appropriately trained and experienced in mental health surveys.
With regard to recall bias, much of the information gathered related to the previous 4 weeks and this should minimise recall bias for this information, although recall bias may be a factor for information relating to the previous 12 months. Other limitations of the study include the possibility of a Hawthorne effect, which is the alteration of behaviour by respondents due to their awareness of being observed; it is not possible to ascertain if such an effect affected our results, or in what direction it might have acted, but we hope it was minimised by the facts that respondents were unaware of any specific hypotheses being tested; interviewers had high levels of training and experience in this area; and there was ongoing quality control: in terms of inter-rater reliability, for example, 10% of interviews conducted by each interviewer were back-checked by telephone, whereby the respondent was contacted by telephone within 5–7 days of completing the survey and accuracy was ensured. Future work could usefully incorporate further measures of inter-rater reliability.
We used cluster sampling which has the advantages of methodological feasibility and relative efficiency (facilitating greater sample size), incorporating random sampling from multiple areas (e.g. different electoral divisions) and permitting stratification (e.g. by level of deprivation). Disadvantages include possible bias (owing to selection of clusters) and sampling error (as each cluster may be composed of households that are like one another), both potentially resulting in diminished representativeness. We sought to minimise these problems through careful random cluster sampling and making the sample size as large as possible, as we were keen to use cluster sampling in order to optimise comparability with previous studies in this area (Long et al. Reference Long, O’Loughlin, O’Keefe and O’Dowd2002; Darker et al. Reference Darker, Whiston, Long, Donnelly-Swift and Barry2014; Darker et al. Reference Darker, Donnelly-Swift, Whiston, Moore and Barry2016).
We used electoral division boundaries to define our study area and the SAHRU deprivation score to measure deprivation. As electoral divisions can include variations in deprivation, however, alternative methodological options include using small areas and different indices of deprivation, such as the Pobal HP Deprivation Index (https://maps.pobal.ie/WebApps/DeprivationIndices/index.html). We opted to use electoral divisions and the SAHRU deprivation score in order to optimise comparability with previous studies in this area (Long et al. Reference Long, O’Loughlin, O’Keefe and O’Dowd2002; Darker et al. Reference Darker, Whiston, Long, Donnelly-Swift and Barry2014; Darker et al. Reference Darker, Donnelly-Swift, Whiston, Moore and Barry2016) but future work could usefully focus on different geographical divisions and different deprivation indices in order to test the robustness of our findings.
Other limitations include the fact that we did not have ethical approval to gather or analyse information on households that declined to participate, raising the possibility of self-selection bias whereby respondents and non-respondents might differ in specific respects (e.g. levels of stress). We hope that our response rate of 60.2% reduces any such effect but it nonetheless remains a possibility. In addition, the choice of individual ‘respondent’ in each household might be similarly prone to self-selection bias or arbitrariness, despite our definition of the ‘primary carer’ as the person who managed the welfare and health of the family/household, or, in rented accommodation, the person who paid the household bills or whose name was on the rent agreement. While these methodological features might have introduced bias in the present study, however, they were also features of the earlier studies in this area, and thus unlikely to affect comparability.
Despite the statistical significance of the findings presented in this paper, the r 2 values for each of our two multi-variable models were below 20%, suggesting that factors other than those included in our analyses account for most of the variance in positive mental health and psychological distress in this population. This highlights the need for further research in this area, looking at variables that we did not examine in this study; see below for further suggestions regarding future research.
Comparison with previous studies
Given the notable differences between our results and those of the SLÁN survey of 2007 (Barry et al. Reference Barry, Van Lente, Molcho, Morgan, McGee, Conroy, Watson, Shelley and Perry2009), the comparability of the two studies merits consideration. Tallaght is a relatively deprived area in suburban Dublin and we were concerned at the outset about possible limitations on the generalisability of our findings outside similarly deprived settings. On this basis, we stratified our sample into areas of high and lower deprivation in order to both explore the relevance of deprivation and optimise generalisability. Even so, it is apparent that the high levels of mental health problems in our study compared to the national sample in the 2007 SLÁN study may be attributable, at least in part, to the relatively high level of deprivation in our area compared to the national sample used by SLÁN in 2007.
However, while we found that the 12-month prevalence of stress was higher in areas of high (66.9%) compared to lower deprivation (55.5%; p=0.037) within our study area, deprivation was not associated with rates of loneliness (20.2%), feeling sad, blue or depressed (20.2%), loss of interest (19.7%), or feeling worried, tense or anxious (22.5%; p>0.05 in all cases; Table 2). In addition, the rate of ‘probable mental illness’ did not differ significantly between areas of high (14.6%) and lower deprivation (11.6%) within our study (p=0.432). These observations suggest that while deprivation likely explains part of the contrast between our findings and those of the SLÁN national study in 2007, it is unlikely to account for the disparities in full. Other factors, such as Ireland’s economic turmoil over the intervening decade, are also likely relevant (Kelly & Doherty, Reference Kelly and Doherty2013; Duffy et al. Reference Duffy, Mullin, O’Dwyer, Wrigley and Kelly2016; Kelly, Reference Kelly2016).
It is especially notable that while deprivation was associated with stress in our area, it was not associated with composite measures of positive mental health (Table 3) or psychological distress (Table 4). This suggests that deprivation is associated with levels of stress that are troubling for individuals but do not quite meet the threshold for formal diagnosis. In addition, the proportion of people with ‘probable mental illness’ in areas of high deprivation (14.6%) was slightly but non-significantly higher than the proportion in areas of lower deprivation (11.6%), so this relationship might attain statistical significance in a larger sample, although it does not in ours.
With regard to corelates of mental health, we found that good mental health was associated with not living with a person with a chronic illness or disability, greater age and identifying as non-Irish (Tables 3 and 4). The strong link between poor mental health and living with a person who has chronic illness or disability likely reflects caregiver burden, which is known to be associated with increased risk of depression (Blanco et al. Reference Blanco, Rohde, Vázquez and Torres2014). This is one of the key findings of our study: the centrality of carer burden in shaping mental health in Ireland.
The association we identified between greater age and better mental health is consistent with a 2011 study of a younger sample of 753 third-level (university) students in Limerick, Ireland that found a mean score of 72.7 out of 100 on the MHI-5 (Houghton et al. Reference Houghton, Keane, Murphy, Houghton and Dunne2011), which is lower than those reported in both the 2007 SLÁN study (82) and our study (76.7). The mean age in the Limerick sample was 22.2 years (s.d. 5.7) compared to 53.9 (s.d. 15.3) in ours. Our finding linking better mental health with greater age is also consistent with broader evidence that wellbeing is U-shaped across the lifespan, with the greatest wellbeing reported in childhood and older adult life (Blanchflower & Oswald, Reference Blanchflower and Oswald2008; Hawkes, Reference Hawkes2012). Our study included only persons aged 18 years or over and thus demonstrated a positive linear relationship between age and mental wellbeing: as an older adult, the older you are, the better your mental health.
Perhaps our most interesting finding is the association between self-identifying as non-Irish and having better mental health. Historically, Ireland was more accustomed to outward rather than inward migration, but this changed in the late 1900s as the net outward migration of 2% of the entire population in 1988/1989 reversed, and the number of immigrants entering Ireland between 1995 and 2000 amounted to some 7% of the population (MacÉinrí, Reference MacÉinrí2001). Much of the resultant psychiatric and psychological literature has focussed on the mental health needs of this group, with particular (and necessary) emphasis on the psychological consequences of trauma (Wilson et al. Reference Wilson, Hennessy, Dooley, Kelly and Ryan2013).
Against this background, our finding that self-identifying as non-Irish is associated with better mental health is very interesting. While a greater proportion of the non-Irish were educated to secondary (high) school level or beyond (78.7%) compared to the Irish (55.4%; p<0.001), identifying as non-Irish remained independently associated with better mental health in both multi-variable models even after controlling for level of education (which was not independently associated with better mental health).
It is, however, important to note that only 8.0% of our respondents identified as non-Irish (n=28) and this limits our power to draw firm conclusions on this point. Nonetheless, our findings suggest, at the very least, that people who identify as non-Irish may have better mental health, and this possibility merits further study with larger samples so as to increase power, facilitate more systematic categorisation of nationality and determine whether or not this relationship truly exists across the population more broadly.
Conclusions
Levels of mental health problems in our deprived, suburban area in 2018 are substantially higher than those reported in a national sample in 2007 (Barry et al. Reference Barry, Van Lente, Molcho, Morgan, McGee, Conroy, Watson, Shelley and Perry2009). These differences are attributable in part to deprivation but other factors are also likely relevant, including Ireland’s tumultuous economic and social trajectory over the intervening decade. Our findings emphasise the continued high prevalence of stress, especially in deprived suburban areas; the centrality of carer burden in determining mental wellbeing in Ireland and the facts that ageing and self-identifying as non-Irish are associated with positive mental health (although the latter in particular requires replication).
Future social policy aimed at increasing population wellbeing could usefully make greater efforts to alleviate stress and carer burden, especially in deprived areas. Some of our research group (G.M.S., A.O’C, B.D.K.) are clinicians working in mental health services in this area and the rate of ‘probable mental illness’ identified in this study (13.1%) highlights a strong need for appropriate universal access to high quality mental health services at both primary care (GP) level and secondary care (hospital and specialist community clinic) level in Tallaght and other communities. Full implementation of Ireland’s national mental health policy, A Vision for Change, with particular awareness of heightened need in deprived areas, would help greatly with this (Expert Group on Mental Health, 2006).
Future community studies of mental health could usefully explore the relevance of various factors not considered in this study which are likely to be relevant (e.g. substance misuse, acute physical illness, recent life stressors, stability of employment, community facilities), the precise relationship between nationality and mental wellbeing and possible interventions to build on these findings and improve population mental health in an effective, sustainable and evidence-based fashion.
Acknowledgements
The RAND 36-item Short Form Survey (SF-36) was developed at RAND as part of the medical outcomes study. We wish to thank the Meath Foundation for funding; Professor Margaret M. Barry, who led the SLÁN 2007 mental health survey, for assistance with the questionnaire; Behaviour & Attitudes (http://banda.ie) for performing the field work; and the Fettercairn Community Health Project for their support. Most of all, we thank the participants who took part in the study. The authors are very grateful to the editor and reviewers for their comments and suggestions.
Financial Support
This work was supported by a grant from the Meath Foundation, Tallaght University Hospital, Dublin, Ireland (www.meathfoundation.com). The funding body had no role in the design of the study, collection, analysis and interpretation of data, or in writing the manuscript.
Conflicts of Interest
G.M.S., C.D., L.W., A.O’C., J.M.B., and B.D.K. have no conflicts of interest to disclose.
Ethical Standards
The authors assert that all procedures contributing to this work comply with the ethical standards of the relevant national and institutional committee on human experimentation with the Helsinki Declaration of 1975, as revised in 2008. The study protocol was approved by the Ethics Committee of each participating institution. Ethical approval for the study was obtained from the Research Ethics Committee of St James’s Hospital and Tallaght University Hospital, Dublin, Ireland [Reference no. 2017-11 List 41 (10)]. Written informed consent was obtained from all study participants.