





Introduction
Rice is a staple food in many countries of Africa and constitutes a major part of the diet for more than half of the world’s population; hence, it is considered a strategic commodity crop in the world (Fukagawa and Zhiska, Reference Fukagawa and Zhiska2019). Consumption of rice in Africa has increased compared to other traditional cereals of Africa, such as sorghum, millet, and other root and tuber crops like cassava and yam (Seck et al., Reference Seck, Diagne and Mohanty2012). Yet, the majority of sub-Saharan African countries are not self-sufficient in rice production, putting a burden on economies due to large imports of rice in the continent (Yuan et al., Reference Yuan, Saito and van Oort2024). It is necessary to increase rice production in Africa to meet the demand in rice consumption.
Flooding is a natural disaster that has a detrimental effect on plant growth and farmers’ livelihoods. The effect of flash floods on plant survival seriously depends on the duration of submergence stress. This submergence stress is a condition where the entire plant is fully immersed in water (complete submergence) or at least part of the shoot terminal is maintained above the water surface (partial submergence) (Tamang et al., Reference Tamang and Fukao2015). Rice is often the only cereal that can be grown in flood-prone ecosystems (Sarkar et al., Reference Sarkar and Bhattacharjee2011), but flash floods and excessive rainfall regularly affect rain-fed lowland rice in many parts of the world where floodwater remains for fourteen days or more (Aryalekshmi et al., Reference Aryalekshmi, Vighneswaran and Shilpa2021). In recent years in many sub-Saharan African countries, rice crops have faced serious flood problems leading to large agricultural losses (Reed et al., Reference Reed, Anderson and Kruczkiewicz2022; Balgah et al., Reference Balgah, Ngwa and Buchenrieder2023). There have been increasing incidents of repeated cycles of complete submergence of rice crops in many parts of Africa during the main cropping wet season (WS) (July to October). Also, there have been incidents where submergence periods have exceeded a month and beyond, where no rice variety could survive. In flood-prone ecology, rice farmers generally grow traditional rice varieties that can tolerate flooding, but these usually have poor yields (Dar et al., Reference Dar, Chakravorty and Waza2017). In recent years, a gene for submergence tolerance (Sub1) has been identified and introgressed into high-yielding rice varieties that can tolerate submergence for up to two weeks (Septiningsih et al., Reference Septiningsih, Pamplona and Sanchez2009).
The Sub1 gene is an important QTL on chromosome 9 derived from the landrace FR13A and comprises three ethylene response factor (ERF) transcription factors. The tolerant Sub1A allele limits shoot elongation in the form of a quiescence strategy, thereby preserving carbohydrates and improving survival during complete submergence (Xu et al., Reference Xu, Xu, Fukao, Canlas, Maghirang-Rodriguez, Heuer, Ismail, Bailey-Serres, Ronald and Mackill2006). In recent years, through marker-assisted backcrossing, Sub1 has been introgressed into high-yielding rice varieties that maintain grain yield (GY) as well as survive submergence for up to two weeks (Septiningsih et al., Reference Septiningsih, Pamplona and Sanchez2009). Beyond survival, Sub1 introgressed varieties have delivered measurable on-farm benefits in flood-prone areas, reducing the yield losses and stabilizing production. However, when there is recurrent incidence of submergence within the same growing season, accumulated stress-induced constraints could cause reduction in yield even in Sub1 introgressed lines.
When plants are exposed to environmental changes, they initiate a series of physiological, biochemical, and molecular adaptations to survive under stress conditions. These responses are crucial for rice under low-oxygen environments like submerged conditions (Kuroha et al., Reference Kuroha and Ashikari2020; Oladosu et al., Reference Oladosu, Rafii and Arolu2020). To adapt, plants upregulate antioxidative defense mechanisms, produce molecules such as ERFs, and synthesize and accumulate cryoprotectant solutes (Bailey-Serres et al., Reference Bailey-Serres, Fukao and Gibbs2012; Kuroha et al., Reference Kuroha and Ashikari2020). Additionally, they undergo modifications that protect and stabilize cellular membranes. These collective changes enable plants to adapt, survive, and maintain cellular function under adverse environmental conditions (Kuroha et al., Reference Kuroha and Ashikari2020). Abiotic stress acclimatory responses and benefits are well known and documented for many abiotic stresses in rice and other crops (Gupta et al., Reference Gupta and Shrestha2023). However, to the best of our knowledge, there is no research reported in literature on the acclimation capacity of rice to submergence or the response of rice crops to repeated cycles of flood stress. Considering recent climatic events of repeated floods during rice cropping, there is an urgent need to identify rice varieties capable of withstanding submergence stress for more than two weeks and to identify varieties that can perform well in repeated cycles of submergence and recovery. In the present study, we evaluated the response of widely cultivated submergence-tolerant rice varieties carrying the Sub1 gene, along with non-Sub1 improved varieties and selected Nigerian landraces, to two sequential cycles of submergence stress separated by a recovery phase. The objective was to investigate the extent of stress acclimation in these genotypes by examining survival, growth, and yield-related responses under repeated submergence conditions.
Materials and methods
Experimental site and plant material
The experiments were carried out at the Africa Rice Center (Africa Rice) research station at the International Institute of Tropical Agriculture (IITA), Ibadan, Nigeria (Latitude 3°54′32″ E and Longitude 7°29′15″N). Screening for submergence was conducted under field conditions using specially created deep submergence tanks (depth 2 m).
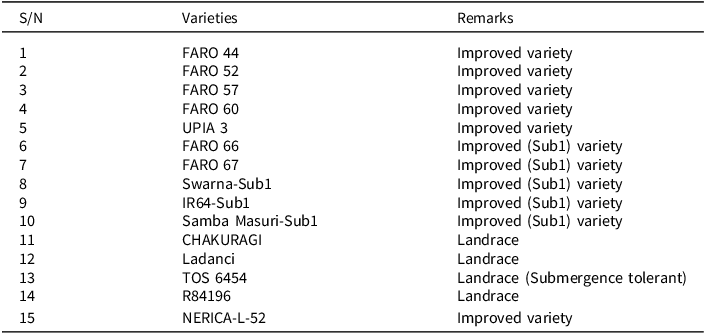
Fifteen rice genotypes were obtained from the rainfed lowland breeding programme of the Africa Rice Centre based at Ibadan, Nigeria. Table 1 shows the list of varieties used in this study. The two experiments were conducted in the WS of 2019 and repeated in the 2020 dry season (DS). The rice genotypes were planted and evaluated for submergence tolerance in a random complete block design with three replicates in the submergence tanks. Seeds were kept in an oven for 48 h at 50°C to break the dormancy, followed by direct seeding in the submergence tanks. The experiments were designed using an alpha lattice design with 3 replicates. The plot size was 2 m × 2 rows, maintaining 22 hills per plot at a spacing of 20 cm between the hills and 30 cm between the rows. Two submergence tanks, one each for single- and double-submergence stress treatments, were used.
List of varieties and landraces used for this study.

Table 1. Long description
A table with 15 rows and 3 columns. The columns are labeled S/N, Varieties, and Remarks. The table lists different rice genotypes used in the study, indicating whether they are improved varieties or landraces. Each row provides a serial number, the variety name, and a remark indicating the type of variety. Notable varieties include FARO 44, FARO 52, FARO 57, FARO 60, UPIA 3, FARO 66, FARO 67, Swarna-Sub1, IR64-Sub1, Samba Masuri-Sub1, CHAKURAGI, Ladanci, TOS 6454, R84196, and NERICA-L-52. The remarks column specifies if the variety is improved or a landrace, with some varieties noted as improved (Sub1) and one as landrace (Submergence tolerant).
Submergence stress treatments
For the single-submergence stress treatment, fourteen-days-old rice seedlings were subjected to complete submergence for fourteen days by filling the submergence tank with water. . A water depth of 2 m was maintained in the submergence tank for the entire period during the stress treatment by adding water regularly. The water was drained out completely after 14 days of stress to start the recovery period. The survival rates of plants were scored twice: once immediately after the water was drained off, and the second scoring was after 21 days of the recovery period (Xu et al., Reference Xu, Xu and Ronald2000). The surviving seedlings were allowed to grow normally until their full maturity. A standing water depth of 5 cm was maintained in the tank for the remaining growth period (Xu et al., Reference Xu, Xu and Ronald2000; Septiningsih et al., Reference Septiningsih, Pamplona and Sanchez2009).
For the double-submergence stress treatment, fourteen-days-old rice seedlings were subjected to complete submergence for eight days, followed by recovery for 21 days in the submergence tank as described earlier. The survival rates of the rice plants were scored twice as described earlier (Septiningsih et al., Reference Septiningsih, Pamplona and Sanchez2009; Xu et al., Reference Xu, Xu and Ronald2000). The recovered rice seedlings were subjected to a second cycle of submergence stress for fourteen days by adding water to the submergence tank. The survival of seedlings was again scored twice: First scoring was done immediately after the water was drained off, and second scoring was after 21 days of the recovery period (Xu et al., Reference Xu, Xu and Ronald2000). The surviving seedlings were allowed to grow normally until their full maturity. Standing water depth of 5 cm was maintained in the tank for the remaining growth period. The double-submergence treatment (8 days + 14 days) was designed to mimic natural flood recurrence patterns frequently experienced in rainfed lowland rice systems, where an early-season transient flood is often followed by a prolonged late-season submergence (Ismail et al., Reference Ismail, Singh, Singh, Dar and Mackill2013). A recovery phase between the two events was included to assess whether early submergence exposure could induce physiological acclimation, a concept widely studied in drought, heat, and salinity stress, but that had not previously been investigated in rice submergence tolerance. Thus, the total stress duration (8 + 14 days) does not represent continuous submergence but two discrete stress events separated by recovery, reflecting realistic field conditions rather than equalized-duration treatments. The overall single and double submergence stress treatments are also summarized in Figure S1.
Submergence treatments were imposed using regular lake water which was clean and transparent (IITA Lake, Ibadan). Although turbidity was not quantitatively measured, the water remained moderately turbid due to suspended soil particles mimicking flooding conditions commonly encountered in rainfed lowland rice systems.
Data collection
The data were collected as described by Septiningsih et al. (Reference Septiningsih, Pamplona and Sanchez2009) and the IRRI Standard Evaluation System for Rice (IRRI, 2002). Plant survival was assessed 21 days after de-submergence. A plant was considered to have survived if it exhibited active regrowth, characterized by the emergence of new green leaves or tillers from the basal nodes. Survival percentage was calculated as the proportion of surviving plants relative to the total number of plants subjected to submergence in each experimental unit. For measuring % shoot elongation, the seedling length measurements were taken immediately before submergence and immediately after de-submergence. Shoot elongation (%) during submergence was calculated following formula:
 $$Shoot\;elongation\;(\% ) = \left[ {{{(Height\;after\;submergence - Height\;before\;submergence)} \over {Height\;before\;submergence}}} \right] \times 100$$
Final plant height (cm) at maturity was analysed separately as an absolute morphological trait and was not used to infer submergence-induced elongation responses. The number of tillers per plant was recorded at physiological maturity by counting all productive and non-productive tillers from tagged plants in each replicate. A panicle number per plant was determined by counting the total number of panicle-bearing tillers at maturity. Days to 50% flowering were recorded as the number of days from sowing until approximately 50% of plants in each experimental plot had exerted panicles and flowered. GY was determined on a per-plant basis at physiological maturity. All panicles from all the plants from the plots were harvested manually, sun-dried, and threshed. Grains were cleaned and weighed after air-drying. Grain weight was adjusted to a standard moisture content of 14% prior to analysis. GY per hectare (kg ha−1) was estimated by extrapolating per-plot yield based on plant density at harvest.
Statistical analysis
Data from the two-year planting season were analysed using R Statistical software package version 3.6.2. The analysis used general linear models where replications and varieties were considered as fixed. Significant means were separated using Tukey’s Honest Significant Difference (HSD). The data presented in the tables are combined means of the two independent trials.
Pearson’s correlation coefficients were computed among all measured traits – viz. survival percentage, shoot elongation (%), days to flowering, number of tillers, number of panicles, and GY – using R software (Core Team, Reference Core Team2024). Correlation matrices and heatmaps were produced using the ‘corrplot’ package to visualize the strength and direction of relationships among traits. Correlation analysis was performed using pooled data from both single- and double-submergence treatments to examine overall trait interrelationships under submergence stress. To examine patterns of trait associations and genotype groupings, a principal component analysis (PCA) was conducted on standardized mean trait values. The first two principal components (PC1 and PC2) were used for visualization in a biplot. Hierarchical clustering of genotypes was applied to the PCA scores to identify distinct response groups, and the clusters were overlaid on the biplot using the ‘factoextra’ package in R.
Results
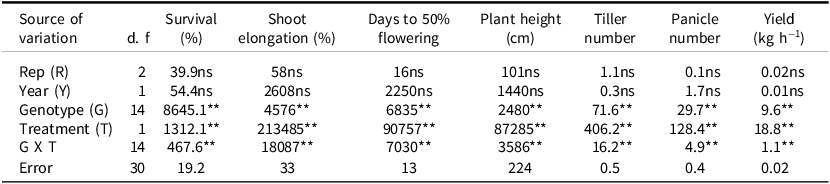
Analysis of variance for different traits of 15 rice genotypes evaluated under submergence stress conditions indicated that there was no significant effect due to replication and season of planting in all traits studied (Table 2). Genotype, submergence stress treatment, and their interaction were significantly different (P < 0.01) for all traits (Table 2).
Analysis of variance showing the effect of single- and double-submergence stresses on 15 rice varieties.

Table 2. Long description
A table analyzing variance in rice traits under submergence stress. The table has 7 rows and 8 columns. Column headers are Source of variation, d.f, Survival (percent), Shoot elongation (percent), Days to 50 percent flowering, Plant height (centimeters), Tiller number, Panicle number, Yield (kilograms per hectare). Row labels are Rep (R), Year (Y), Genotype (G), Treatment (T), G X T, Error. Row 1: Source of variation, Did, 2, 1, 14, 1, 14, 30. Row 2: Survival (percent), 39.9ns, 54.4ns, 8645.1**, 1312.1**, 467.6**, 19.2. Row 3: Shoot elongation (percent), 58ns, 2608ns, 4576**, 213485**, 18087**, 33. Row 4: Days to 50 percent flowering, 16ns, 2250ns, 6835**, 90757**, 7030**, 13. Row 5: Plant height (centimeters), 101ns, 1440ns, 2480**, 87285**, 3586**, 224. Row 6: Tiller number, 1.1ns, 0.3ns, 71.6**, 406.2**, 16.2**, 0.5. Row 7: Panicle number, 0.1ns, 1.7ns, 29.7**, 128.4**, 4.9**, 0.4. Row 8: Yield (kilograms per hectare), 0.02ns, 0.01ns, 9.6**, 18.8**, 1.1**, 0.02.
**Significant at 1% probability level, *significant at 5% probability level, NS not significant.
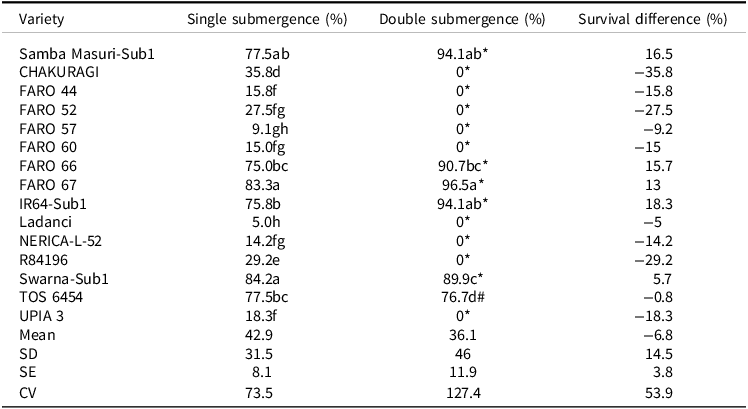
The survival percentage declined significantly for submergence-sensitive non-Sub1 genotypes under double submergence stress compared to single submergence stress (Table 3). All non-SUB1 lines had 0% survival after double submergence treatment, indicating that these varieties failed to recover from the initial exposure. In contrast, submergence-tolerant Sub1 varieties such as FARO 66, FARO 67, IR-64-Sub1, Samba Masuri-Sub1, and Swarna-Sub1 exhibited high survival rates under both single- and double-submergence conditions (Table 3). The survival rates of these Sub1 varieties increased by 5.7%–18.2% under the double-submergence stress treatment compared to single-submergence treatment (Table 3). However, the survival % of submergence-tolerant landrace TOS 6454 remained similar under both single- and double-submergence treatments.
Percentage mean survival under two different submergence stress conditions.

Table 3. Long description
A table comparing survival percentages of different rice varieties under single and double submergence stress. The table has 18 rows and 4 columns. The columns are labeled Variety, Single submergence (%), Double submergence (%), and Survival difference (%). Row 1: Samba Masuri-Sub1, 77.5ab, 94.1ab*, 16.5. Row 2: CHAKURAGI, 35.8d, 0*, -35.8. Row 3: FARO 44, 15.8f, 0*, -15.8. Row 4: FARO 52, 27.5fg, 0*, -27.5. Row 5: FARO 57, 9.1gh, 0*, -9.2. Row 6: FARO 60, 15.0fg, 0*, -15. Row 7: FARO 66, 75.0bc, 90.7bc*, 15.7. Row 8: FARO 67, 83.3a, 96.5a*, 13. Row 9: IR64-Sub1, 75.8b, 94.1ab*, 18.3. Row 10: Ladanci, 5.0h, 0*, -5. Row 11: NERICA-L-52, 14.2fg, 0*, -14.2. Row 12: R84196, 29.2e, 0*, -29.2. Row 13: Swarna, 84.2a, 89.9c*, 5.7. Row 14: TOS 6454, 77.5bc, 76.7d#, -0.8. Row 15: UPIA 3, 18.3f, 0*, -18.3. Row 16: Mean, 42.9, 36.1, -6.8. Row 17: SD, 31.5, 46, 14.5. Row 18: SE, 8.1, 11.9, 3.8. Row 19: CV, 73.5, 127.4, 53.9.
The sign ‘*’ indicates significant differences between single and double submergence stress treatments, while ‘#’ indicates no significant differences between single- and double-submergence stress treatments at a 5% probability level. The total number of germinated seedlings in each plot was counted at the start of submergence stress treatments and at the end of the recovery to calculate the % of seedlings that survived in each plot. Survival difference (%) is calculated as the difference between double- and single-submergence treatments. Means followed by the same letter along the same treatment column are not significantly different from one another at 5% probability level.
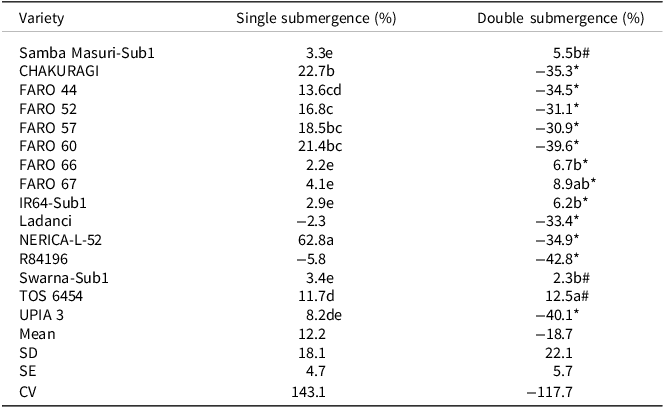
The shoot elongation response, a key adaptation mechanism under submergence, varied widely among varieties. Under single-submergence stress, NERICA-L-52 recorded the highest shoot elongation (62.26%), whereas FARO 66 exhibited minimal elongation (2.21%) (Table 4). The Sub1 varieties maintained lowest % elongation under single-submergence treatment, while the non-Sub1 varieties exhibited significantly higher % elongation compared to all Sub1 varieties. In the double-submergence condition, shoot elongation was significantly reduced in all non-Sub1 varieties, all exhibiting negative growth values (Table 4). Notably, all Sub1 varieties maintained a low elongation response across treatments. The submergence-tolerant landrace TOS 6454 maintained similar % elongation rates under both single- and double-submergence stress, however, the elongation % of TOS 6454 was significantly higher than all Sub1 varieties under both single- and double-submergence stress treatments (Table 4).
Seedling shoot elongation (%) of 15 rice varieties under two different submergence stress conditions.

Table 4. Long description
The table presents data on seedling shoot elongation percentages for 15 rice varieties under single and double submergence conditions. It has 15 rows and 3 columns. The columns are labeled ‘Variety’, ‘Single submergence (%)’, and ‘Double submergence (%)’. Each row lists a different rice variety and its corresponding elongation percentages under the two conditions. Notable values include NERICA-L-52 with the highest single submergence elongation at 62.2 percent and FARO 66 with the lowest at 2.2 percent. Under double submergence, all non-Sub1 varieties show negative growth values, while Sub1 varieties maintain low elongation rates. TOS 6454 shows similar elongation rates under both conditions but higher than all Sub1 varieties.
The sign ‘*’ indicates significant differences between single and double submergence stress treatments, while ‘#’ indicates no significant differences between single- and double-submergence stress treatments at a 5% probability level. For measuring % shoot elongation, the seedling length measurements were taken immediately before submergence and immediately after de-submergence. % elongation under submergence treatment was calculated considering shoot length before submergence as 100%. The values are means of 20 recorded observations. Means followed by the same letter along the same treatment column are not significantly different from one another at the 5% probability level.
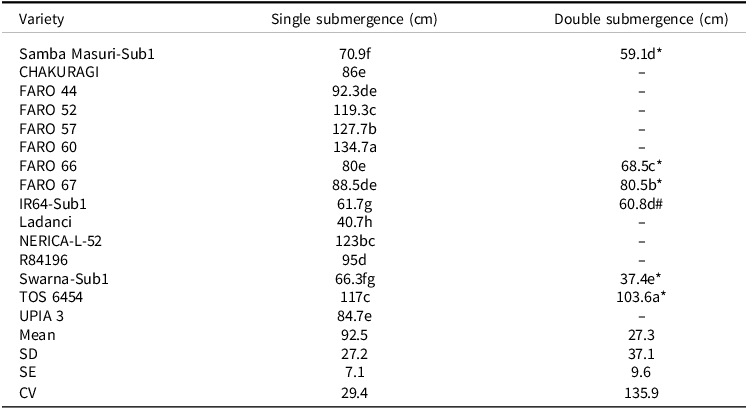
Plant height was significantly affected by both submergence stress treatments. Under single-submergence stress, Ladanci had a relatively shortest plant height (40.67 cm), and FARO 60 recorded the highest plant height (134.67 cm) (Table 5). The Sub1-varieties exhibited lower plant heights compared to the non-Sub1 varieties under single-submergence stress except for FARO 66 and FARO 67. In the double-submergence condition, plant height for non-Sub1 lines could not be recorded, as none of them survived. Plant height was significantly reduced in all Sub1 genotypes under double-submergence stress compared to the single-submergence treatment (Table 5). The submergence-tolerant landrace TOS 6454 also exhibited a significant decline in plant height under double-submergence stress compared to single-submergence stress. However, plant height of TOS6454 was significantly higher than all Sub1 varieties under both stress treatments (Table 5).
Plant height of 15 rice varieties after-submergence stress in the field.

Table 5. Long description
A table comparing plant heights of 15 rice varieties under single and double submergence stress. The table has 15 rows and 3 columns. The columns are labeled ‘Variety’, ‘Single submergence (cm)’, and ‘Double submergence (cm)’. Each row lists a rice variety and its corresponding plant height under single and double submergence stress. Notable varieties include Samba Masuri-Sub1, CHAKURAGI, FARO 44, FARO 52, FARO 57, FARO 60, FARO 66, FARO 67, IR64-Sub1, Ladanci, NERICA-L-52, R84196, Swarna-Sub1, TOS 6454, and UPIA 3. The table also includes mean, standard deviation (SD), standard error (SE), and coefficient of variation (CV) values for the plant heights under both stress conditions.
The sign ‘*’ indicates significant differences between single- and double-submergence stress treatments, while ‘#’ indicates no significant differences between single- and double-submergence stress treatments at the 5% probability level. Plant height was measured by measuring scale at maturity from the soil surface to the top of the panicle of the longest tiller in the hill. The values are means of 20 recorded observations. Means followed by the same letter along the same treatment column are not significantly different from one another at the 5% probability level.
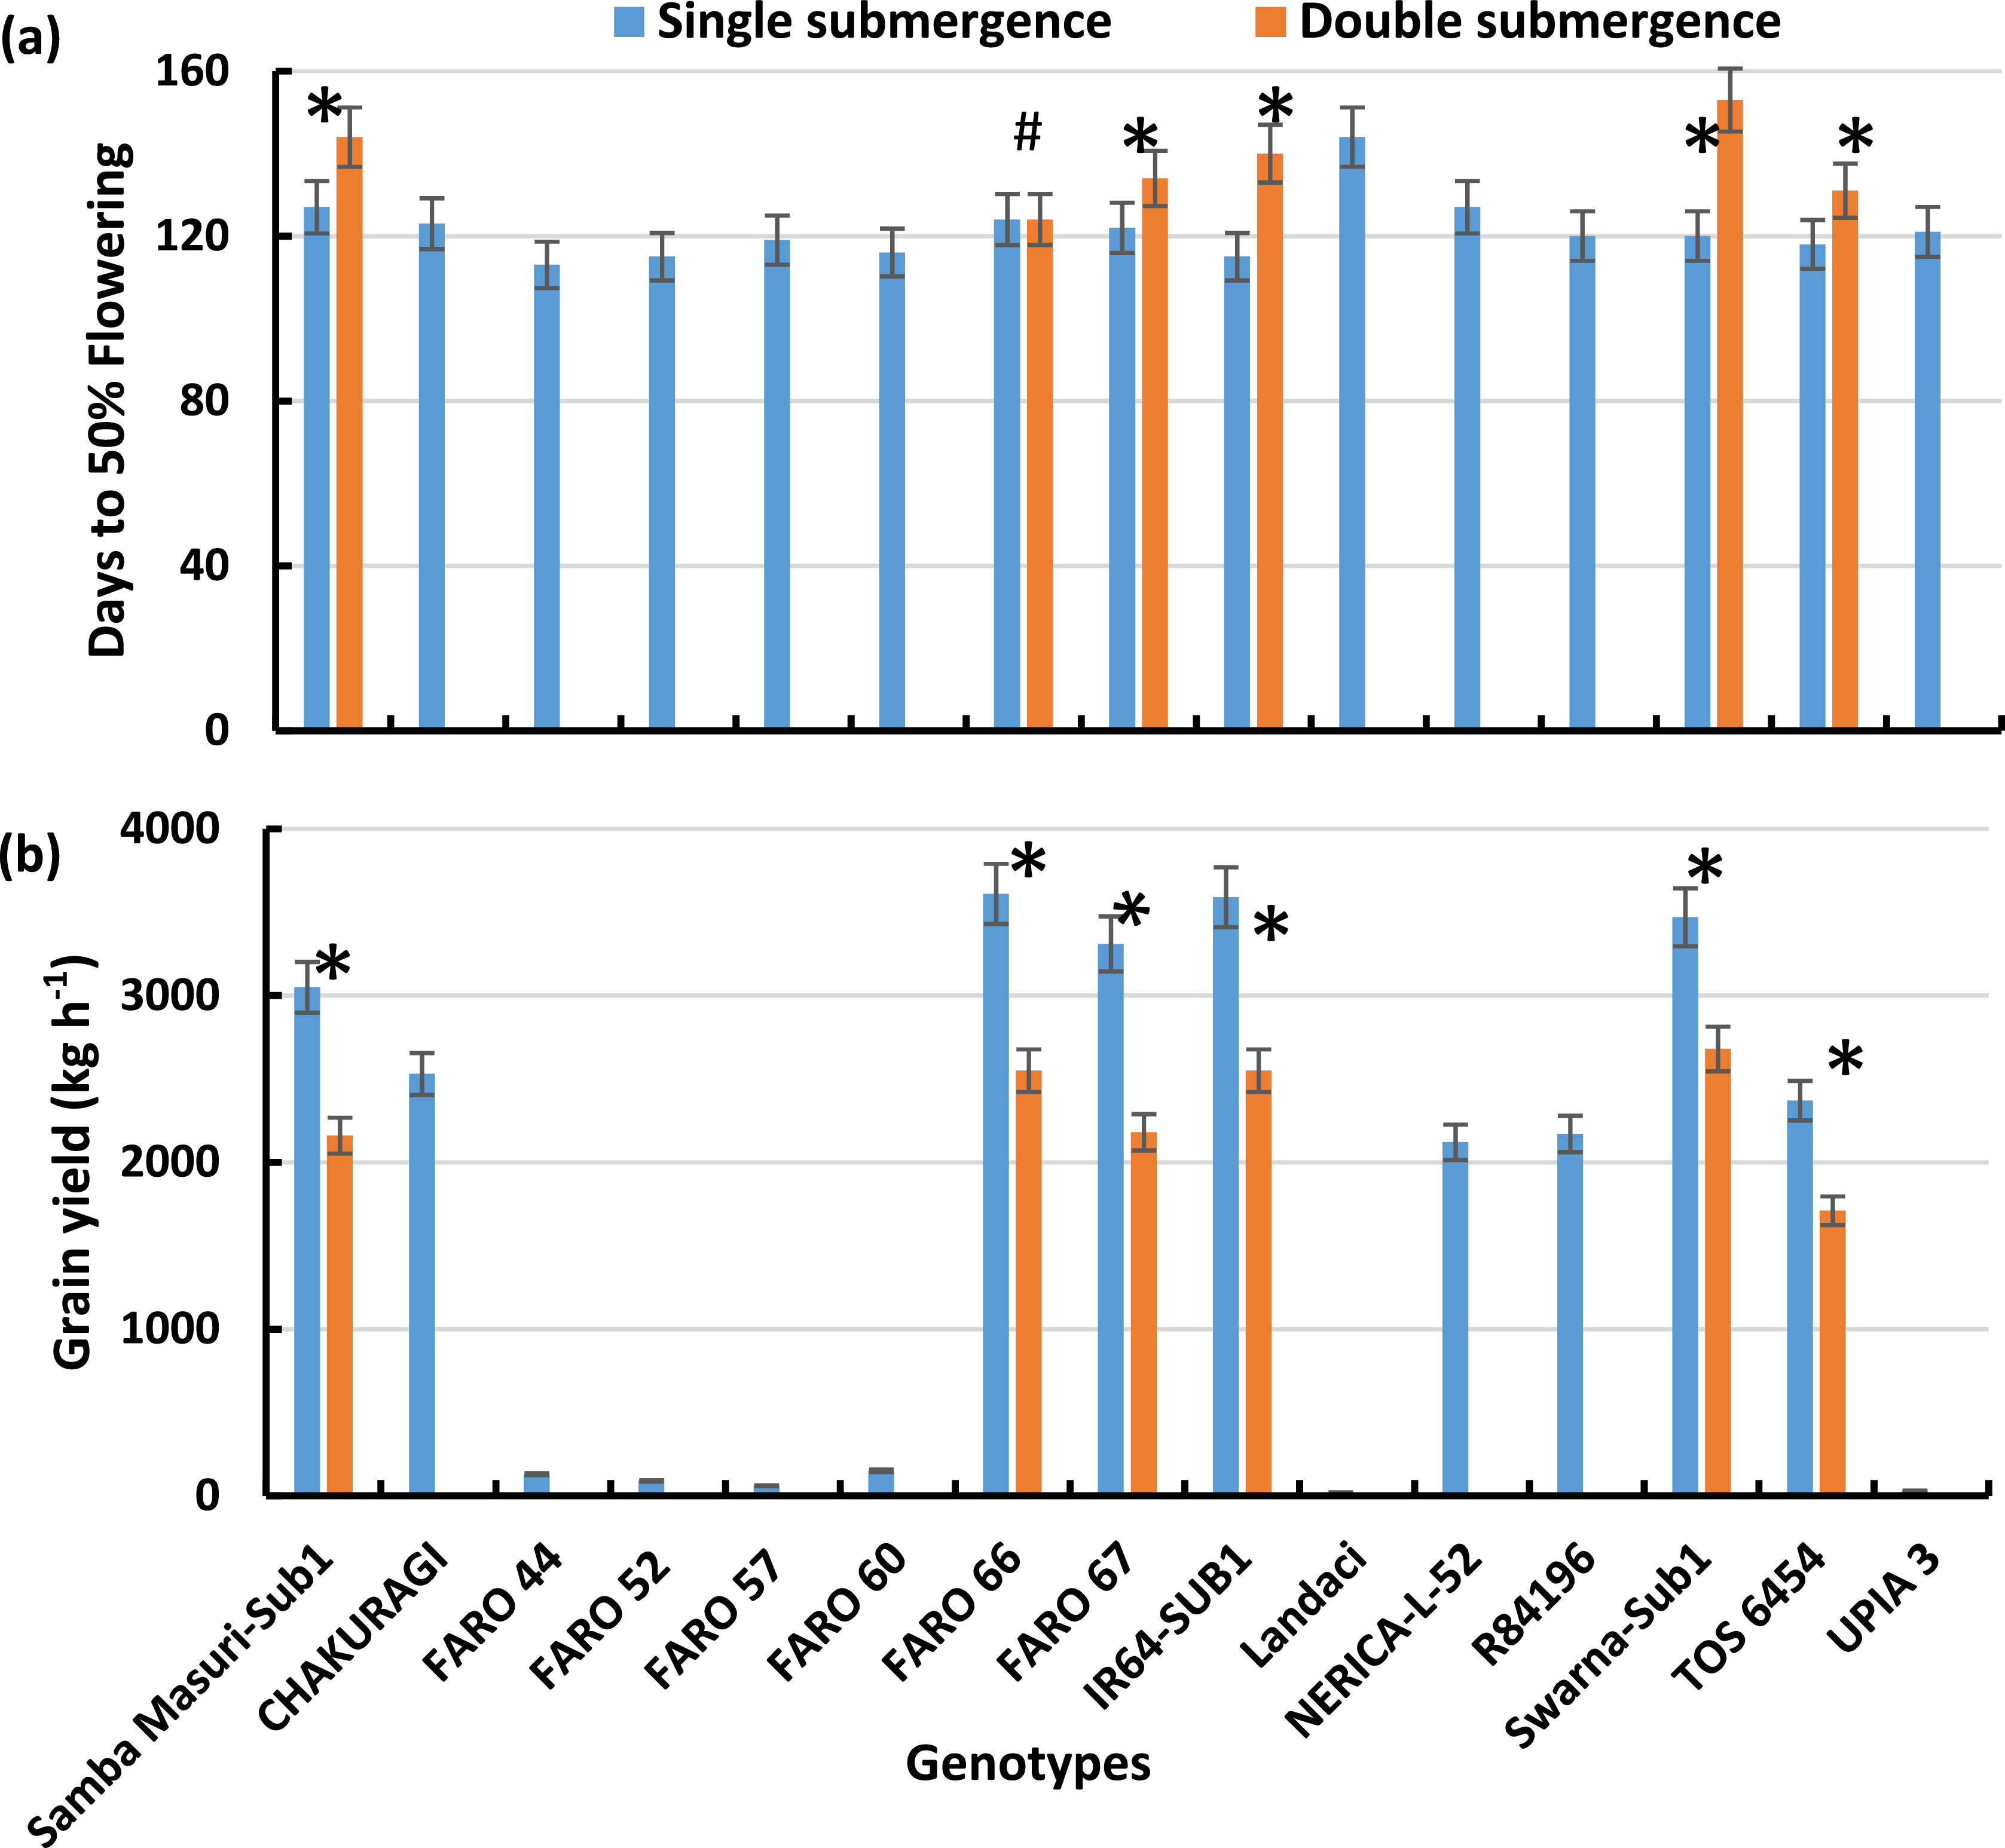
Under single-submergence stress conditions, Ladanci recorded the longest days to flowering 144 days, while FARO 44 had the shortest days to flowering 113 days (Figure 1a). The days to flowering increased significantly under double-submergence stress treatment for TOS 6454 and all Sub1 varieties compared to single-submergence treatment except for FARO 66 (Figure 1a). Under double-submergence stress condition, Swarna-Sub1 had the longest flowering days of 153 days, while FARO 66 have the least flowering days of 124 (Figure 1a).
Days to 50% flowering (a) and grain yield (b) of 15 rice genotypes evaluated under different submergence stress treatments. Days to 50% flowering were recorded when all plants in a plot show at least 50% flowering. Plot yields were measured in grams from three replicates and converted to kg h−1. Error bars indicate standard error in the measurement (n = 3). The sign ‘*’ indicates significant differences between single- and double-submergence stress treatments for same genotype at 5% probability level.

Figure 1. Long description
Panel A: A vertical bar graph shows the days to 50% flowering for 15 rice genotypes under single and double submergence stress treatments. The x-axis lists the genotypes, and the y-axis measures days to 50% flowering. Blue bars represent single submergence, and orange bars represent double submergence. Error bars indicate standard error. Significant differences between treatments for the same genotype are marked with an asterisk. Panel B: Another vertical bar graph displays the grain yield in kg per hectare for the same genotypes and treatments. The x-axis lists the genotypes, and the y-axis measures grain yield. Blue bars represent single submergence, and orange bars represent double submergence. Error bars indicate standard error. Significant differences are marked with an asterisk.
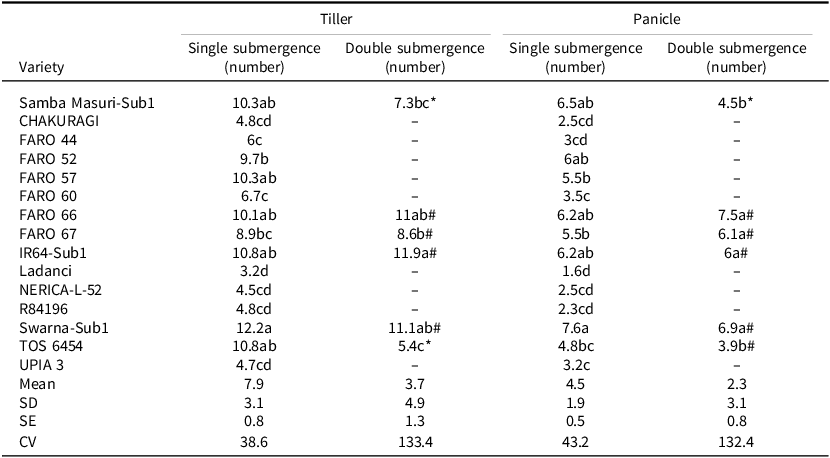
All Sub1 varieties maintained significantly higher tillers and panicle numbers compared to the non-Sub1 varieties except for FAR0 52 and FARO 57 (Table 6). Under single-submergence stress, Swarna-Sub1 maintained a relatively high tiller number (12.2) and panicle count (7.61), whereas susceptible non-Sub1 genotypes such as Ladanci and FARO 44 had lowest tillers and panicles (Table 6). Under double-submergence stress all Sub1 varieties maintained similar numbers of tillers and panicles as under single-submergence treatment except for Samba Masuri-Sub1 and TOS 6454, which exhibited a significant decline in numbers of tillers and panicles under double-submergence stress compared to single-submergence stress (Table 6).
Tiller and panicle number of 15 rice varieties evaluated under submergence stress treatments in the field.

Table 6. Long description
The table presents data on tiller and panicle numbers of 15 rice varieties under single and double submergence stress treatments. It has 19 rows and 5 columns. The columns are labeled ‘Variety’, ‘Tiller Single submergence (number)’, ‘Tiller Double submergence (number)’, ‘Panicle Single submergence (number)’, and ‘Panicle Double submergence (number)’. Each row lists a different rice variety and the corresponding tiller and panicle numbers under different submergence conditions. Notable varieties include Samba Masuri-Sub1, CHAKURAGI, FARO 44, FARO 52, FARO 57, FARO 60, FARO 66, FARO 67, IR64-Sub1, Ladanci, NERICA-L-52, R84196, Swarna-Sub1, TOS 6454, and UPIA 3. The table also includes mean, standard deviation (SD), standard error (SE), and coefficient of variation (CV) values for the data presented.
The sign ‘*’ indicates significant differences between single- and double-submergence stress treatments, while ‘#’ indicates no significant differences between single- and double-submergence stress treatments at the 5% probability level. The total number of the tillers and panicles was counted on 20 hills in each plot, and the values given are means of 20 recorded observations. Means followed by the same letter along the same treatment column are not significantly different from one another at the 5% probability level.
Submergence-tolerant Sub1 varieties yielded higher than the non-Sub1 varieties under single-submergence treatment (Figure 1b). There was a significant decline in GY in all genotypes under double-submergence stress compared to the single submergence (Figure 1b). The highest yielding submergence-tolerant genotypes with Sub1 gene, FARO 66, FARO 67, Swarna-Sub1, IR 64-Sub1, Sambha Masuri-Sub1 and TOS 6454 all showed a significant decline in yield under double-submergence stress compared to single-submergence stress (Figure 1b). For all other non-Sub1 susceptible genotypes, no GY could be recorded after double-submergence stress as none of them survived double-submergence stress.
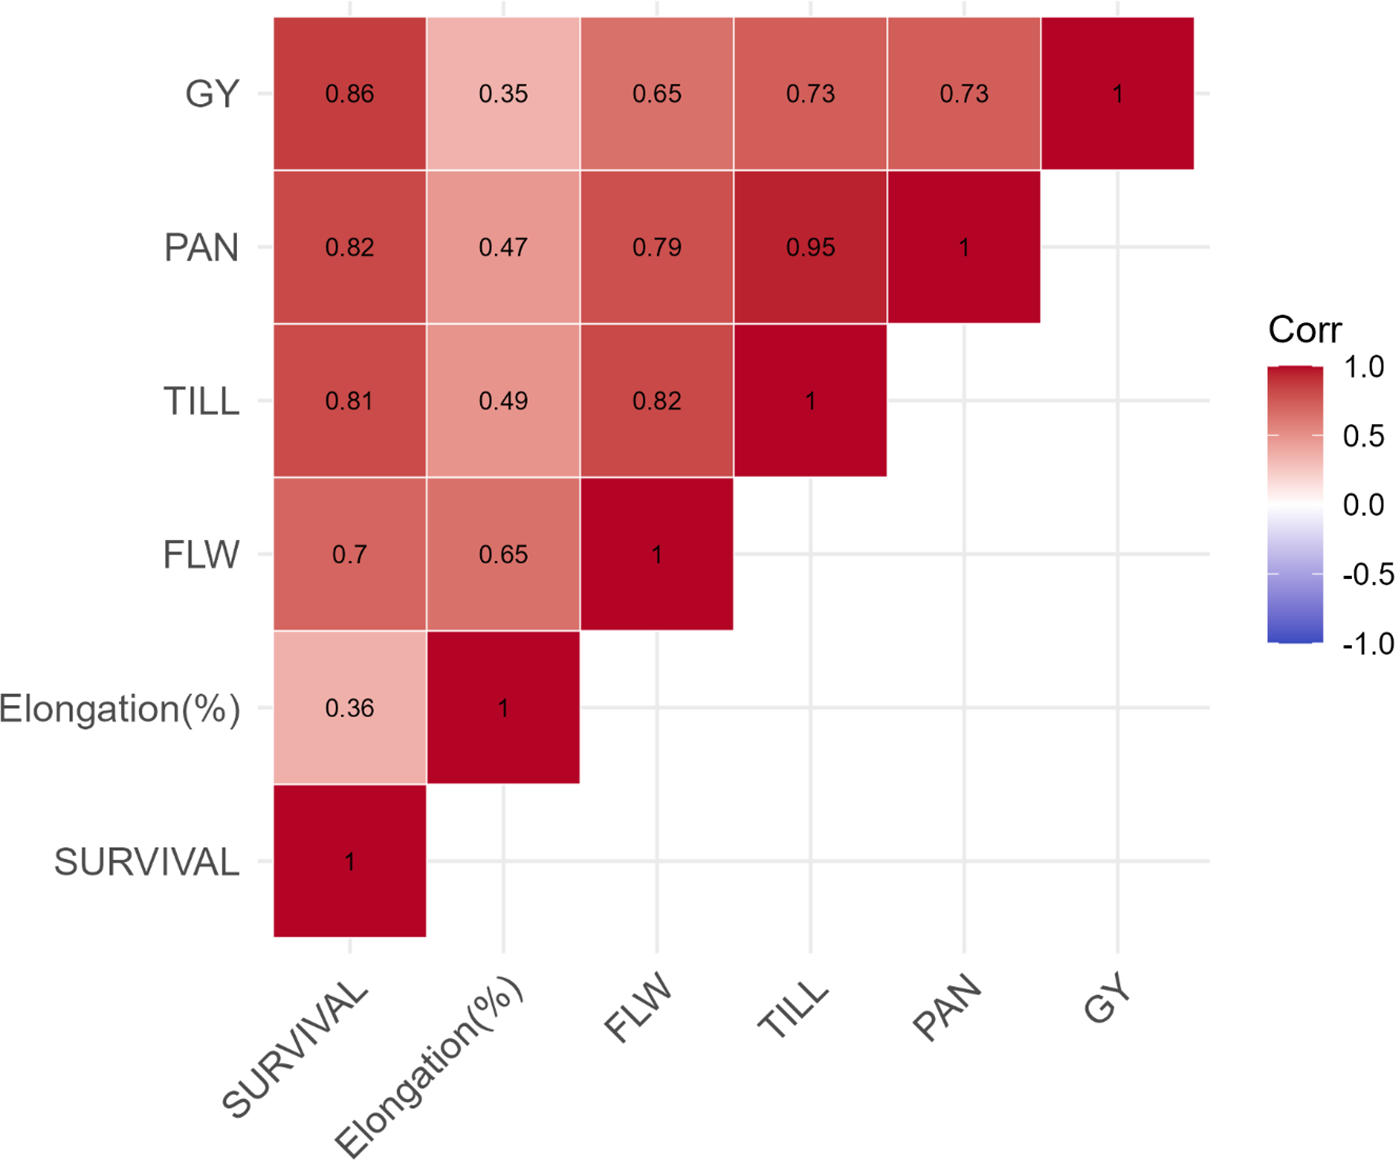
Correlation analysis revealed strong positive associations between yield and key yield components (Figure 2). GY was highly correlated with survival (r = 0.86), panicle number (r = 0.73), and tiller number (r = 0.73), indicating that both plant survival and sink-related traits contributed substantially to yield performance under submergence conditions. Panicle number was strongly associated with tiller number (r = 0.95), reflecting the close developmental linkage between these traits. Flowering time (FLW) also showed moderate-to-strong positive correlations with yield (r = 0.65) and other traits. In contrast, shoot elongation exhibited comparatively weaker associations with GY (r = 0.35) and survival percentage (r = 0.36), suggesting a limited direct contribution of elongation to productivity in the genotypes used in this study (Figure 2). PCA supported these relationships. The first principal component (PC1), explaining 74.2% of the total variation, was primarily associated with GY, survival, tiller number, and panicle number, indicating that these traits collectively define the major axis of variation among genotypes (Figure 3). The second principal component (PC2) explaining 13.8% of total variation, was largely influenced by shoot elongation, which was oriented orthogonally to yield and yield components. This separation indicates that elongation represents an independent response dimension that is not closely aligned with yield performance under submergence stress in the genotypes used in this study.
Pearson’s correlation heat map showing relationships among survival percentage, shoot elongation, flowering time, and yield-related traits of rice genotypes evaluated under submergence stress. Data from single- and double-submergence treatments were pooled to examine overall trait interrelationships under submergence conditions. Color intensity represents the strength and direction of correlations. GY = grain yield; PAN= number of panicles; TILL = number of tillers; FLW = days to 50% flowering; Elongation (%) = seeding elongation % under submergence; SURVIVAL = survival %; Corr = correlation coefficient.

Principal component analysis (PCA) biplot illustrating the multivariate relationships among survival, growth, phenology, and yield-related traits of rice genotypes under submergence stress. Trait vectors indicate variable loadings, while points represent individual observations. The first two principal components (PC1 and PC2) explain most of the total variation. GY = grain yield; PAN = number of panicles; TILL = number of tillers; FLW = days to 50% flowering; Elongation (%) = seeding elongation % under submergence; SURVIVAL = survival %; Dim1 = principal component 1; Dim2 = principal component 2.

Discussion
This present study provides limited evidence for acclimation to repeated submergence stress, and this response appears to be restricted to plant survival in a subset of genotypes, particularly those carrying the Sub1 locus. While some genotypes exhibited improved survival following repeated submergence, this effect did not translate into improvements in key productivity traits, including tiller number, panicle number, or GY. The correlation and multivariate analyses further support this distinction, showing that although survival is positively associated with yield formation, it is more strongly driven by the maintenance of tiller and panicle number. Therefore, the observed response is best interpreted as a partial acclimation effect, confined to the plant’s ability to withstand stress, rather than a comprehensive adaptive advantage affecting overall plant growth and performance. This suggests that the Sub1-mediated quiescence strategy may enhance survival under repeated stress but may not prevent the downstream penalties on growth and reproductive development that ultimately determine yield. This could be attributed to the fact that rice plants rely on stored carbohydrate reserves for survival under submerged conditions. During the first submergence event, these reserves are depleted, and while some varieties manage to survive a second submergence, they may lack sufficient energy for post-submergence recovery and reproductive growth. This aligns with previous studies that highlight the importance of carbohydrate availability in submergence tolerance (Das et al., Reference Das, Panda and Sarkar2009; Singh et al., Reference Singh, Septiningsih and Balyan2017).
The role of shoot elongation in submergence tolerance is well known (Sakagami et al., Reference Sakagami, Yukiko and Chiharu2013). In the present study, some varieties exhibited a higher degree of elongation compared to others (Table 4). Excessive shoot elongation can be detrimental, as it leads to energy depletion. Sub1 varieties such as Swarna-Sub1 and Samba Masuri-Sub1, which maintained a low elongation rate, demonstrated the well-documented quiescence strategy associated with the Sub1 gene. This response minimizes energy expenditure, allowing plants to survive under prolonged submergence stress. Conversely, varieties with excessive shoot elongation, such as NERICA-L-52, experienced greater stress post-submergence due to carbohydrate exhaustion, which clearly explains their lower yield performance after recovery. Interestingly, the submergence-tolerant landrace TOS 6454 (Agbeleye et al., Reference Agbeleye, Olubiyi, Ehirim, Shittu, Jolayemi, Adetimirin, Ariyo, Sani and Venuprasad2019) exhibited significantly higher elongation compared to varieties with Sub1 locus (Table 4), but that elongation was less than all non-Sub1 varieties. TOS 6454 is known to carry an additional epistatic Sub2 QTL on chromosome 2 in addition to Sub1 locus on chromosome 9 (Akintayo et al., Reference Akintayo, Daniel, Shittu, Jolayemi, Semwal and Venuprasad2023). The interaction between Sub1 and Sub2 may have led to elongation resulting in partial quiescence in TOS 6454 under submergence stress.
The delay in days to flowering observed in all varieties after double submergence stress suggests that reproductive development is particularly sensitive to flooding. This is consistent with reports by Septiningsih et al. (Reference Septiningsih, Pamplona and Sanchez2009) and, Sarkar and Bhattacharjee (Reference Sarkar and Bhattacharjee2011), who reported that submergence stress alters hormonal balances, particularly ethylene and gibberellin levels, leading to delays in panicle initiation and flowering. Delayed flowering may have negatively impacted grain filling duration, leading to yield losses despite successful survival as observed in this study (Figure 1a, b).
The fewer tiller and panicle numbers under double-submergence stress further explain the lack of yield advantage in acclimated plants. The ability of rice plants to recover from submergence depends not only on survival but also on their ability to restore tiller production. However, repeated submergence appears to cause cumulative damage, preventing effective tiller regeneration. This finding is supported by studies that indicate submergence stress suppresses hormonal activity, which is crucial for tiller bud initiation in rice (Fukao and Bailey Serres Reference Fukao and Bailey-Serres2008; Zha et al., Reference Zha, Zhao and Wang2022). It is well known that submergence-tolerant genotypes with Sub1 locus have the capacity to recover faster and resume normal growth, leading to high numbers of tillers; however, that capacity is greatly compromised when the stress duration is longer than 14 days (Singh et al., Reference Singh, Mackill and Iamail2014). Maintaining high productive tillering is reported to be essential for yield maintenance in rice in other long-term flooding stresses like stagnant flooding also (Semwal et al., Reference Semwal, Bhadmus, Afeez and Venuprasad2025; Semwal et al., Reference Semwal, Afeez, Bhadmus, Okanlawon and Venuprasad2026). Repeated submergence may limit this ability of recovery and growth in Sub1 varieties.
Despite some improvement in survival, GY remained significantly lower under double-submergence stress, indicating high survival under submergence stress alone does not enhance yield potential. The reduction in yield under double-submergence stress could be attributed to several physiological constraints: (i) prolonged submergence may induce chlorophyll degradation resulting in reduced photosynthetic efficiency and limiting post-submergence recovery (Sone and Sakagami, Reference Sone and Sakagami2017); (ii) submergence stress may have led to nutrient leaching and depletion of essential elements such as nitrogen, phosphorus, and potassium from the soil which are vital for grain development (Phukan et al., Reference Phukan, Jindal and Laldinsangi2024); (iii) prolonged submergence and post-submergence stress can induce spikelet sterility, reducing the number of filled grains per panicle (Behera et al., Reference Behera, Singh and Sarangi2019); and (iv) submergence-induced oxidative stress could lead to cell and tissue damage resulting in insufficient recovery (Kawano et al., Reference Kawano, Ella and Ito2002).
The combined correlation and multivariate analyses indicate that GY under submergence stress is strongly associated with survival and yield-component traits, particularly tiller and panicle number (Figure 2). The close alignment of these traits along the primary axis of variation (PC1) suggests that yield formation is predominantly governed by the plant’s ability to maintain viable tillers and reproductive structures following stress exposure (Figure 3). While survival showed a strong positive correlation with yield, its effect appears to be indirect, likely mediated through the maintenance of tiller and panicle number rather than acting as a sole determinant of productivity. Similar results have been reported in earlier study using Sub1 varieties (Singh et al., Singh et al., Reference Singh, Mackill and Iamail2014). In contrast, shoot elongation exhibited weak correlations with yield and survival and was largely separated along the second principal component (Figure 3), indicating a distinct physiological response that does not directly translate into yield advantage in this study. This pattern suggests that elongation responses under submergence may reflect an adaptive strategy that is functionally independent of yield formation. Overall, these results suggest that multiple trait interactions, rather than any single trait, underpin yield performance under submergence stress, with survival and yield components playing a central role, while elongation contributes less directly to final productivity in the genotypes used in this study.
It is acknowledged that the cumulative submergence duration differed between treatments; however, this design was deliberate to reflect natural flooding recurrence rather than controlled equal-duration stress. Moreover, the plants underwent a recovery phase between the two stress events, and therefore the double-submergence treatment should not be considered a simple extension of the total submergence period. Instead, this regime represents a priming–recovery–stress sequence, conceptually like acclimation models described for drought, salinity, and heat stresses. Nevertheless, because the repeated-submergence treatment involved a greater cumulative duration of flooding than the single-submergence treatment, the observed differences cannot be unequivocally attributed to physiological acclimation or priming alone. It is possible that the responses reflect the combined effects of repeated exposure and cumulative stress intensity. Interestingly, despite a longer cumulative exposure, several Sub1 genotypes exhibited higher survival under the double-submergence regime. Therefore, our results should be interpreted as evidence consistent with a limited, survival-specific acclimation response rather than definitive proof of stress priming. Future studies employing treatments with equivalent cumulative stress duration or alternative priming designs will be valuable for confirming the underlying mechanisms.
Together, the findings of this study suggest that yield penalties under repeated submergence are not solely a consequence of immediate stress damage or survival outcomes but arise from cumulative disruptions to plant development, particularly in tillering and reproductive processes. This highlights the importance of considering multiple trait responses when evaluating submergence tolerance and adaptation. Future breeding should prioritize genotypes that combine high survival with sustained tillering and panicle formation under repeated submergence. Emphasis should shift from survival alone to overall yield stability and post-submergence recovery capacity.
Supplementary material
The supplementary material for this article can be found at https://doi.org/10.1017/S0014479726100428.
Data availability statement
The raw datasets obtained during this study are available on request from the corresponding author.
Acknowledgements
The authors would like to acknowledge the support of AfricaRice staff: Mr. Amidu Adelu, Ms. Margret Olom, Dr. Olatunde Azeez for helping in field management during this study.
Author contributions
NAS – Experiment execution, data collection, data analysis, writing original draft, writing, review and editing; MAAV – Conceptualization, writing, review and editing; EOI – writing, review and editing; VKS – Conceptualization, data analysis, writing, review and editing, Fund acquisition.
Funding statement
This research was supported by financial grants from the Gates Foundation (Grant number OPP1080832) to Africa Rice Center (AfricaRice).
Competing interests
The authors declare that there are no competing interests.


 Open access

