Nosocomial infections are a major cause of morbidity and mortality in children undergoing cardiac surgery.1 Prompt and accurate diagnosis of such infections is problematic. Common and traditionally used markers of infection, such as the presence of fever, leukocytosis, elevated sedimentation rate and C-reactive protein, are sensitive but rather non-specific, resulting in the frequent empiric use of broad spectrum systemic antibiotics.2 Procalcitonin, a protein that is stimulated by bacterial endotoxins, has been shown to be more specific than standard markers in predicting bacterial infection in a wide variety of clinical settings.3–13 Studies in adults have shown the protein to be a specific marker for septic shock, and more useful than C-reactive protein, tumor necrosis factor, or interleukin-6 for differentiating cardiogenic shock from infection.14
Cardiopulmonary bypass is associated with the induction of an inflammatory cascade known as the systemic inflammatory response. Although the incidence of this is debated, there is evidence that it occurs to some degree in all patients who undergo cardiac surgery.15 Differentiating sepsis from the systemic inflammatory response on clinical grounds in the post-operative period is difficult. Elevated levels of procalcitonin following cardiopulmonary bypass have been reported in adults in the absence of bacterial infection, suggesting that the systemic inflammatory response triggered by cardiopulmonary bypass may influence the circulating levels of procalcitonin.16, 17 Consequently, before considering the use of procalcitonin as a marker of bacterial sepsis after cardiopulmonary bypass, it is important to ascertain the presence, degree, and duration of elevated levels following cardiac surgery in children.
Methods
Patients
We prospectively enrolled 53 consecutive patients, 29 male and 24 female, who were older than 2 months of age, over a 5-month period, who were about to undergo elective cardiac surgery at The Children's Hospital, The Cleveland Clinic. Infants less than 2 months of age were excluded because historically they are known to have erratic concentrations of procalcitonin in the neonatal period.18, 19 Prior to enrollment in the study, each patient was evaluated pre-operatively for historical or clinical evidence of infection. Patients having a pre-operative history of recent or ongoing infection, or those who had physical or laboratory evidence of an infection, were excluded pre-operatively, with 11 such patients being identified and excluded.
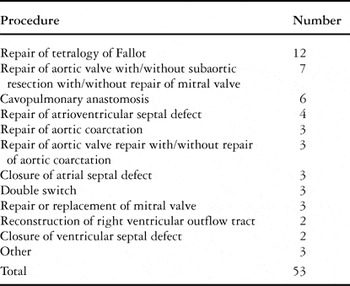
Age, sex, diagnosis, type of surgery, bypass time, and cross-clamp time were recorded for each enrolled patient. The diagnoses and types of surgery performed on these patients are summarized in Tables 1 and 2. Of the 53 patients, 48 underwent open-heart surgery and required cardiopulmonary bypass. We added methyprednisolone at a dose of 20 milligrams per kilogram to the priming solution for the patients undergoing cardiopulmonary bypass. Post-operatively, all patients were ventilated and received inotropic support, volume, and vasodilators as clinically indicated. All patients were given peri-operative antibiotic prophylaxis with cefuroxime at a dose of 25 milligrams per kilogram every 12 hours and oral nystatin, commencing at the time of surgery and continuing for 48 to 72 hours post-operatively. Bacterial cultures were obtained as clinically indicated, and complications such as infection and re-operation were recorded. Charts were reviewed for patients in whom any microbiological cultures were obtained, or those in whom changes were made in the antibiotic regimen. The Institutional Review Board of The Cleveland Clinic Foundation approved the study, and informed consent was obtained from the parents of all children prior to their enrollment.
Table 1. Diagnoses.

Table 2. Operative procedures.

Collection of blood samples
Blood samples were collected in serum separator tubes (367819, Becton Dickinson, Rutherford, New Jersey, United States of America) to measure levels of procalcitonin prior to surgery, and at approximately 24, 48, and 72 hours post-operatively. Baseline samples were taken at the time of the pre-operative evaluation, along with other standard laboratory measurements. Post-operative samples were drawn from either central venous or arterial catheters, or peripherally with routine daily samples. The blood samples were refrigerated after being collected. Serum was separated from the blood sample within 24 hours of collection, and frozen at negative 20 degrees Celsius until analysis was performed.
Laboratory analysis
The concentration of procalcitonin was measured by a commercially available immunoluminometric assay (LUMItest procalcitonin, Brahms Diagnostica, Henningsdorf, Germany). Analytical assay sensitivity is approximately 0.1 nanograms per millilitre. The functional sensitivity assay, with a 20% inter-assay variation coefficient, is approximately 0.3 nanograms per millilitre. A concentration greater than 0.5 nanograms per millilitre is indicative of infection, while a concentration of greater than 2.0 nanograms per millilitre is thought to correlate strongly with serious bacterial infection.2, 4
Statistical analysis
In all analyses, we used the base 10 logarithms of values better to meet assumptions of normality. We then transformed the results back to the original scale for presentation. To estimate mean base 10 logarithms of procalcitonin and its 95 percent confidence interval at each time point, and to compare mean base 10 logarithms of values between timepoints, we used a repeated measures mixed model in which time was categorized as 0, 24, 48, or 72 hours. In the model, we treated values of procalcitonin below the minimum threshold of detectability, defined as less than 0.5 nanograms per millilitre, as equal to 0.25 nanograms per millilitre.
When planning the study, we performed simulations to assess the effect of various sizes of sample on the standard error of the estimated mean base 10 logarithms for procalcitonin at each time point, and we chose the sample size of 50 patients so that these standard errors would be less than 0.15 units.
To assess the association between bypass time and levels of procalcitonin at each time point, we used the nonparametric Spearman rank correlation. We compared 8 patients found to exhibit extreme values of procalcitonin to the rest of the cohort on age and bypass time using the nonparametric Wilcoxon Rank Sum test.
All tests were two-tailed, and performed at a level of significance of 0.05. Statistical analysis 8.2 software, supplied by Statistical Analysis Software Institute, Cary, North Carolina, was used for all analyses.
Results
Blood was collected and concentrations of procalcitonin in the serum analyzed for 53 patients pre-operatively, 49 patients at 24 hours, 50 patients at 48 hours, and 34 patients at 72 hours post-operatively. The median age at enrollment was 5.4 years, with a range of 2 months to 17 years. Median bypass time for the 48 patients who had cardiopulmonary bypass was 84 minutes, with a range from 22 to 192 minutes. Surgery in 45 patients involved aortic cross-clamping along with cardiopulmonary bypass, with a median cross-clamp time of 46 minutes, and a range of 6 to 95 minutes. In 3 of the enrolled patients, concentrations of procalcitonin were elevated at baseline, being greater than or equal to 0.5 nanogram per millilitre, and measuring 0.5, 1.6, and 3.5 nanograms per millilitre, respectively.
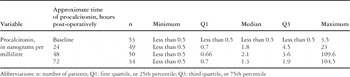
None of the patients enrolled were deemed to be infected in the peri-operative period based on clinical and laboratory data, and none required re-operation or died in the post-operative period. Every attempt was made to draw procalcitonin at 24, 48, and 72 hours after surgery. Some variability of levels may exist due to inexact times at which the samples were drawn. Quartiles and ranges for concentrations prior to surgery, and at 24, 48, and 72 hours after surgery, are shown in Table 3. The median concentration increased from baseline to 1.8 and 2.1 nanograms per millilitre at 24 and 48 hours, respectively. At 72 hours, the median concentration decreased to 1.3 nanograms per millilitre, which is still above the baseline median. Peak concentration in this study, therefore, was reached at 48 hours. Figure 1 shows boxplots for base 10 logarithms levels at each time point, a visual representation of Table 3.
Table 3. Basic descriptive statistics at each time point. Because procalcitonin is not normally distributed, means, quartiles, and ranges are presented.


Figure 1. Boxplot showing concentrations of procalcitonin, in actual and base 10 logarithm scale, at each time point after surgery. The boxes represent the first and third quartile, solid horizontal lines represent the median, open circles represent outliers, and the whiskers extend to 1.5 times the difference between the first and third quartiles.
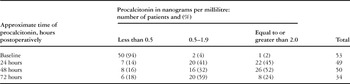
At 72 hours after the operation, 24% of patients had concentrations greater or equal to 2.0 nanograms per millilitre, and 83 percent had concentrations greater or equal to 0.5 nanograms per millilitre, as shown in Table 4. A similar number of patients, 84 percent, had concentrations greater than 0.5 nanograms per millilitre at 48 hours, but more than twice the number of patients had concentrations greater than 2.0 nanograms per millilitre at 48 hours as compared to 72 hours post-operatively.
Table 4. Frequencies and percentages of patients by levels and time of procalcitonin.

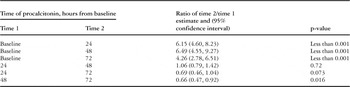
As shown in Table 5, there was a significant change in concentrations at all post-operative time-points when compared to baseline, with a p-value less than 0.001. Bypass times were not significantly associated with concentrations at 24, 48, or 72 hours, the p-value being greater than 0.3 at each time point (data not shown). In 5 of the enrolled patients, we did not use cardiopulmonary bypass. These patients all had pre-operative concentrations of less than 0.5 nanograms per millilitre, with means at 24, 48, and 72 hours post-operatively of 0.852, 0.848, 0.65 nanograms per millilitre, respectively.
Table 5. Ratio of measures at each pair of time points as estimated in the repeated measures model.

Of the 53 patients enrolled, 8 had exaggerated elevations post-operatively. These patients all had pre-operative concentrations less than 0.5 nanograms per millilitre. The post-operative ranges were 0.58 to 23 nanograms per millilitre at 24 hours, 4.5 to 109.6 nanograms per millilitre at 48 hours, and 1.8 to 104.5 nanograms per millilitre at 72 hours. Chart reviews failed to show any clinical evidence of infection, and the post-operative course in each of these 8 patients was uncomplicated. Thus, 6 were extubated within 24 hours and transferred to the cardiology step-down unit within 2 post-operative days, one patient developed a pleural effusion and was extubated on the third post-operative day, while the other was extubated on the fifth post-operative. There were no changes made to the routine prophylactic antibiotic regimen of these patients. These patients did not differ significantly from the other patients in terms of bypass times or age.
Discussion
Much interest has been generated in procalcitonin since it was first discovered to be elevated in patients with bacterial infection.4 Several studies done in children have found the protein to be both a sensitive and specific marker for sepsis associated with bacterial infection in certain clinical contexts.20–23 Its utility in the setting of cardiac surgery, however, has largely been investigated in adults, with conflicting results.11, 14, 17, 24–28
Our study was conducted to ascertain the kinetics of concentrations of the protein related to cardiopulmonary bypass in the absence of bacterial infection. Thus, we sought to establish “normal” concentrations in the post-operative period, and to establish parameters to aid in distinguishing elevations associated with cardiopulmonary bypass from those related to sepsis.
We found that concentrations are indeed elevated subsequent to cardiopulmonary bypass, with a peak concentration at 48 hours post-operatively. Although concentrations decrease thereafter, there was a significant difference in concentrations even at 72 hours after surgery when compared to baseline. Furthermore, we found that half and one-quarter of the children continued to have concentrations equal to or greater than 2.0 nanograms per millilitre at 48 hours and 72 hours, respectively, in the absence of bacterial infection. Given the fact that concentrations equal or greater than 2.0 nanograms per millilitre appear to correlate well with bacterial infection in most clinical situations, the findings of our study bring into question the utility of using concentrations of the protein in the serum in predicting bacterial sepsis following cardiac surgery.
The results of our study contrast with the recent findings of Beghetti et al., who studied 25 children undergoing cardiac surgery.29 They found a transient increase in concentrations after cardiopulmonary bypass, with a peak concentration at 24 hours. Using a concentration of less than 1.1 nanograms per millilitre as normal, over four-fifths of their patients were deemed to have normal concentrations at 72 hours, and almost nine-tenths had normal concentrations on the fifth post-operative day. In addition, median concentrations at 24, 48, and 72 hours post-operatively were lower than the medians observed in our patients. Contrary to our results, they found a positive correlation between bypass times and concentrations of procalcitonin at various time points. Similar to our study, however, they found a wide range of concentrations, with some patients having significantly higher concentrations in the absence of infection.
It is possible that our cohort represented a more “complicated” population than the children studied by Beghetti et al.,29 thus resulting in higher post-operative concentrations. While a direct comparison of populations is difficult, this is not apparent when reviewing types of surgery, bypass times, or overall mortality or morbidity. Our population included patients without regard to type of surgery, use of cardiopulmonary bypass, or post-operative complications other than infection. Thus, our population was diverse, and represented typical patients submitted for cardiac surgery in a pediatric hospital.
The precise reasons for concentrations of procalcitonin being elevated in patients subsequent to cardiopulmonary bypass are not well understood. Beghetti et al.29 found a correlation between non-infectious post-operative complications and elevated concentrations. Although our study was not designed to examine the reasons for elevated concentrations, we did not find any correlation between bypass times and concentrations. If there is a correlation between these events, however, the utility of using elevated concentrations of procalcitonin in predicting infection in this setting is questioned. After all, the patients with post-operative complications are the ones at greatest risk for infection.
Procalcitonin was markedly elevated in the serum from 8 of the 53 patients we enrolled in the absence of clinical signs of infection. These patients were similar to the rest of the cohort in regard to age and bypass times. All did well post-operatively. It is possible that other non-infectious post-operative complications influenced the increased concentrations in these patients. Review of the charts from these patients, however, did not reveal obvious complications.
The fact that concentrations are increased in non-infected patients after cardiopulmonary bypass is likely to influence the specificity of the protein in predicting bacterial sepsis in this population. Given the results of our study, it will be difficult to define parameters that differentiate between post-operative sepsis of bacterial and non-bacterial origin and non-infectious etiologies.
We did not examine concentrations of the protein beyond 72 hours post-operatively.
Presuming that these concentrations continue to decrease, and reach baseline from 3 to 5 days post-operatively, as has been shown in other studies, the utility of using the concentrations in predicting bacterial infection after the third post-operative day may prove to be useful.
Further studies need to be performed, nonetheless, to elucidate the aetiology of the elevated concentrations of procalcitonin found in children who undergo cardiac surgery.
Acknowledgement
We are very grateful for the helpful technical assistance given by Donna Londrico and Rose Arciaga.