Introduction
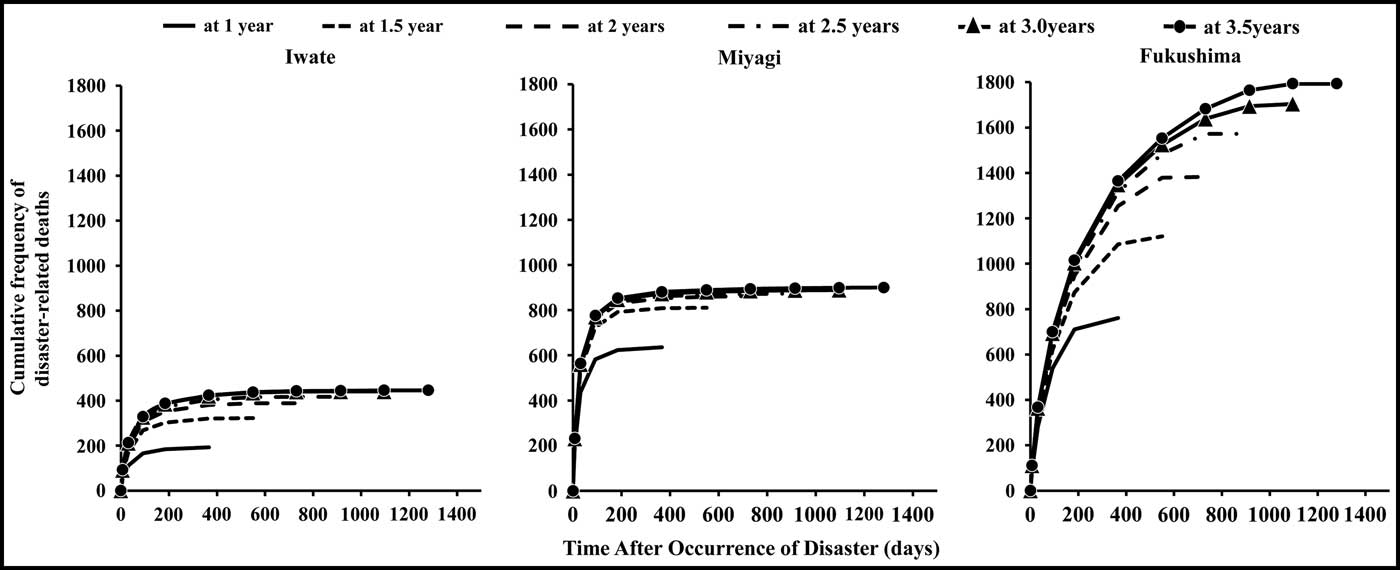
Disaster-related death is defined generally as death caused by illness or deterioration of a chronic disease arising from disaster-induced fatigue or psychological trauma, including suicide. It is assessed in Japan by municipal committees comprising clinicians, lawyers, and scholars. It is well known that the Great East Japan Earthquake, which occurred approximately four years ago on March 11, 2011, resulted in a large number of disaster-related deaths. However, it is not common knowledge that the number of disaster-related deaths continues to increase in Fukushima Prefecture four years after the earthquake. According to data reported by the Reconstruction Agency (Minato, Tokyo Japan) every six months, the numbers of previously reported, cumulative frequency of disaster-related deaths are revised and still increasing in Fukushima Prefecture, although the rate of the increase appears to be declining gradually. In comparison, those in other prefectures plateaued within two years of the earthquake (Figure 1). 1 , 2 In this report, the causes for the increase in disaster-related deaths in Fukushima Prefecture, which may also have implications for developing response strategies to other disasters, were analyzed.
Changes in Cumulative Frequency of Disaster-related Deaths in Iwate, Miyagi, and Fukushima Prefectures in Japan by Number of Days After the Great East Japan Earthquake. (Time points in each line graph in each prefecture are: 0; 7; 31; 92; 184; 366; 550; 731; 915; 1,096; and 1,280 days. All data were provided by reports of the Reconstruction Agency.)

Report
The Complexity and Diversity of Major Disasters
On March 11, 2011, the Great East Japan Earthquake occurred in northeast Japan, resulting in more than 18,000 dead or missing (excluding disaster-related deaths), 6,000 injured, and 300,000 refugees. 1 – 4 Despite Japan being one of the most earthquake-prone countries in the world,Reference Kondo, Koido and Morino 5 this disaster revealed the lack of an effective health care system and policies for resource distribution in a time of disaster. Damage stemming directly from the earthquake was complicated by the subsequent tsunami and the nuclear accident. It is difficult to establish fixed policies in the face of complex and diverse major disasters which require the health care system and resource distributors to adapt to local conditions. Nevertheless, society must learn and establish appropriate measures for medical care during such disasters.
Disaster Medical Assistance Teams (DMATs) were introduced into Japan, in response to major earthquakes. Such events have demonstrated the necessity for medically trained mobile teams operating during the acute phase of a disaster. These DMATs are estimated to have prevented up to 500 deaths after the 1995 Great Hanshin-Awaji Earthquake.Reference Kondo, Koido and Morino 5 , 6 The DMATs are deployed to the affected area to provide triage, immediate medical support, and wide-area medical evacuation in the acute phase after disasters. The large number of disaster-related deaths occurring in the subacute phase after the earthquake has also been recognized as a problem and motivates the development of countermeasures targeting more vulnerable, older refugees over a longer term.Reference Kondo, Koido and Morino 5 , 6
Many DMATs (approximately 380 teams comprising 1,800 members) were deployed to the affected area immediately after the Great East Japan Earthquake. However, the tsunami negated the effectiveness of DMATs. Because there were few survivors, and DMATs only function for 48 hours after their arrival, only 19 patients were transported to safety.Reference Koido, Kondo, Ichihara, Kohayagawa and Henmi 7 More than 90% of the 18,000 deaths occurred immediately after the tsunami, but a number of disaster-related deaths occurred in the subacute phase after the DMATs had left the area. 1 Serious infrastructure damage hindered other medical teams, intended to follow the DMATs, from approaching the affected area unassisted by Self-Defense Forces for approximately 10 days.
Vulnerability of Older People in a Time of Disaster
Analysis of reports released by the Reconstruction Agency on December 26, 2014, the National Police Agency (Chiyoda, Tokyo Japan) on December 10, 2014, and Fukushima Prefecture on January 7, 2015 demonstrate a pressing need to improve disaster-response to save as many lives as possible. 1 – 4 As of September 30, 2014, the total number of disaster-related deaths was 3,194, which exceeds the number of traumatic deaths (excluding those killed immediately by the tsunami) and represents 14.7% of total fatalities. 1 Notably, people aged 66 years or older accounted for 89.1% of disaster-related deaths. 1 People aged 65 years or older accounted for 54.4% of direct deaths. 8 In 2010, senior citizens aged over 65 years comprised 26.3% of the population of northeast Japan. 9 Therefore, older people especially are vulnerable after major disasters. After the Great Hanshin-Awaji Earthquake in 1995, the proportion of disaster-related deaths was 14.3% (919 of 6,434; excluding 17 suicides). 6 This suggests that the difficulties experienced by older people after the Great East Japan Earthquake were even more challenging than those in 1995, in spite of the countermeasures; although, the change in the population structure for 16 years should be taken into account.
Unsafe Radiation Level and Disaster-related Deaths per 1,000 Population
The ineffectiveness of the countermeasures for disaster-related deaths mainly can be attributed to the complicating factors of the nuclear accident that followed the earthquake and tsunami, which was rated as a major accident, Level 7, on the International Nuclear and Radiological Event Scale. Compared with a typical natural disaster, refugees of the nuclear accident have experienced a longer period of evacuation. The seriousness of the combined earthquake, tsunami, and nuclear accident limited the effectiveness of countermeasures that had been implemented based on previous disaster experiences, particularly with respect to older refugees.
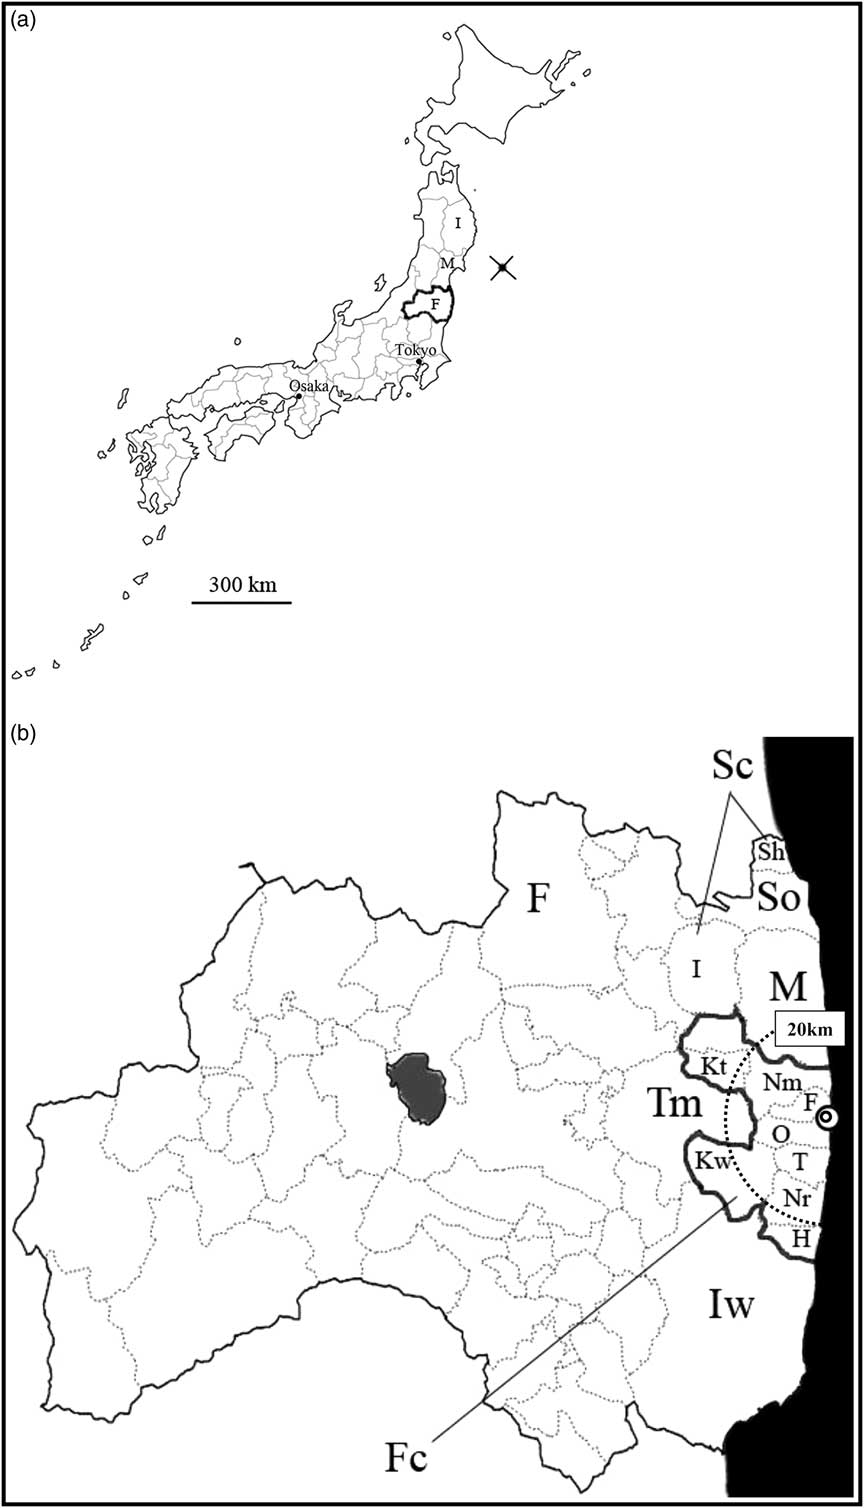
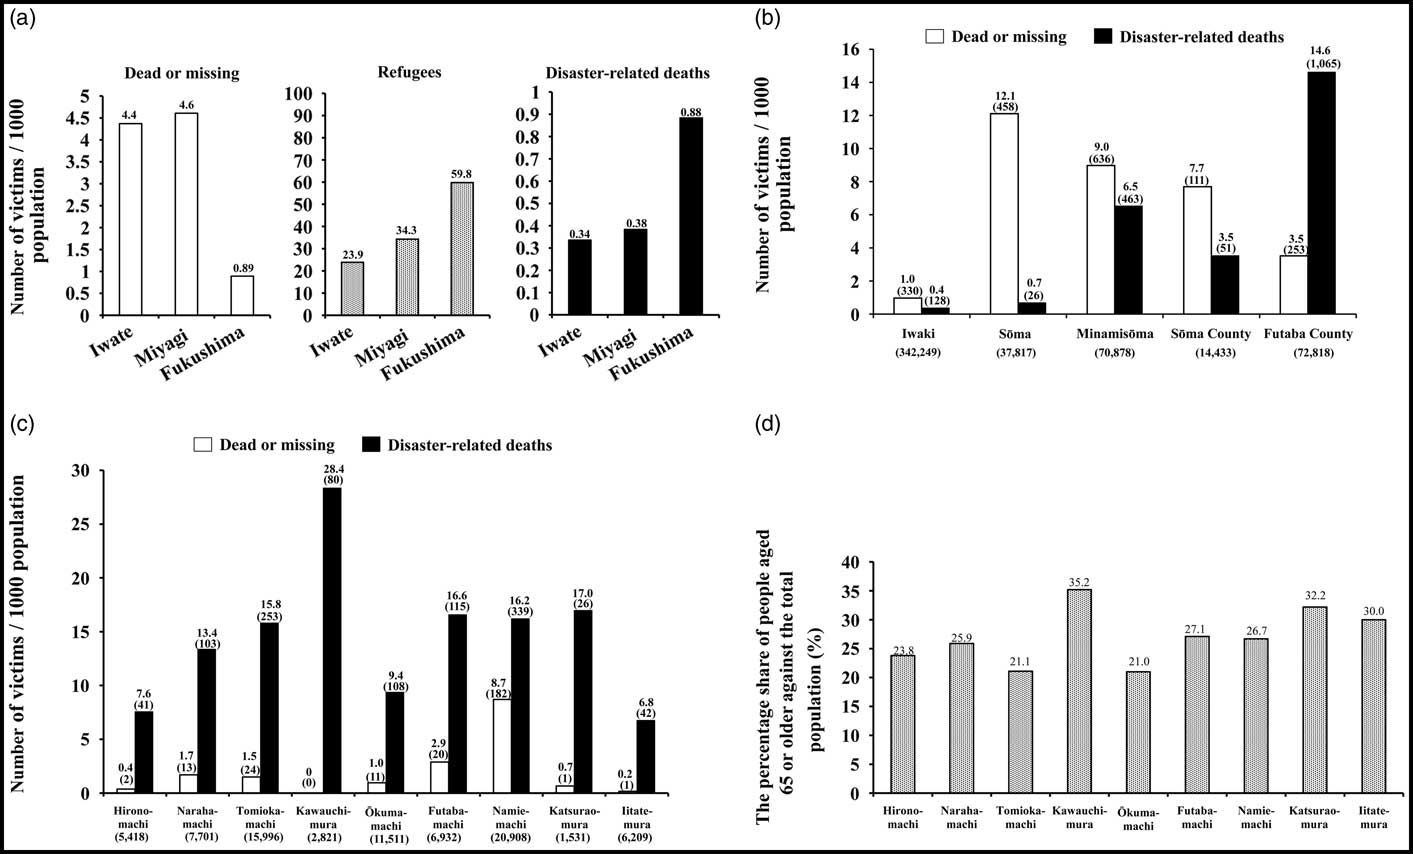
To elucidate the effect of the nuclear accident on refugees, the number of disaster-related deaths, dead or missing persons, and refugees per 1,000 people in Fukushima Prefecture, where it occurred, was calculated and compared with those numbers in other stricken areas (Figure 2 and Figure 3). 1 – 4 , 10 The open bars on the left in Figure 3a show that the rate of dead or missing persons in Miyagi, Iwate, and Fukushima Prefectures (in order of descending prevalence) likely was a consequence of their geographical orientation with the pacific coastline close to the epicenter (Figure 2a). The disaster-related death rates in Fukushima, Miyagi, and Iwate Prefectures (in descending order; Figure 3a, closed bars on the right) were identical to the ranking by refugee rate (Figure 3a, dotted bars in the middle). In Fukushima Prefecture, the dead or missing rate (Figure 3b, open bars) was higher than the disaster-related death rate (Figure 3b, closed bars) in areas facing the sea (Sōma, Minamisōma, and Sōma County), with the exception of Futaba County (Figure 2b). Moreover, in all municipalities in Futaba County, including Futaba-machi and Okuma-machi, where the Fukushima Daiichi Nuclear Power Station is located, the disaster-related death rate (Figure 3c, closed bars) was higher than the dead or missing rate (Figure 3c, open bars). All areas in Futaba-machi, Ōkuma-machi, and Tomioka-machi are within the 20 km “difficult-to-return zone,” where the radiation levels are still considered unsafe (Figure 2b). 11 In October 2014, radiation levels also remained too high for habitation in most of Namie-machi, Naraha-machi, and Katsurao-mura in Futaba County. 11 Although Iitate-mura in Sōma County is more than 30 km away from the collapsed power plant, radiation levels have been unsafe for habitation because of meteorological conditions, and the disaster-related death rate was also higher than the dead or missing rate in Iitate-mura (Figure 3c). 1 , 2 , 11 These areas, in which the disaster-related death rate was higher than the dead or missing rate, coincide exactly with the Areas under Evacuation Orders because of unsafe radiation levels. 11 These results suggest that increased rates of disaster-related deaths in these areas are related to unsafe radiation levels.
a. Location of the Epicenter of the Great East Japan Earthquake in Relation to Fukushima Prefecture and Other Prefectures in the Northeastern Area of Honshu, Japan. (The epicenter of the Great East Japan Earthquake (cross) located under the Pacific Ocean approximately 150 km east of the coast of the Miyagi prefecture.) Abbreviations: F, Fukushima Prefecture; I, Iwate Prefecture; M, Miyagi Prefecture. b. Locations of the Cities Most Affected by the Great East Japan Earthquake in the Fukushima Prefecture, the Municipalities in Futaba County, and the Fukushima Daiichi Nuclear Power Station (double circle). Abbreviations: F, Fukushima City (prefectural capital); F, Futaba-machi; Fc, Futaba County; H, Hirono-machi; I, Iitate-mura; Iw, Iwaki City; Kt, Katsurao-mura; Kw, Kawauchi-mura; M, Minamisoma City; Nm, Namie-machi; Nr, Naraha-machi; O, Ōkuma-machi; Sc, Soma County; Sh, Shinchi-machi; So, Soma City; T, Tomioka-machi; Tm, Tamura City.

a. Number of Dead or Missing, Refugees, and Disaster-related Deaths per 1,000 Population in the Major Prefectures Severely Damaged by the Earthquake in Tohoku Region in Japan. (All data were provided by reports of the Reconstruction Agency.) a The population which were used for the calculation of the rates are from the National Census on October 1, 2010. 10 The number of disaster-related deaths in each bar in each graph represents the number of disaster-related dead victims who had lived in the prefecture or the municipality when the earthquake occurred, regardless of whether they moved and where they were at the time of their death. b. Number of Dead or Missing and Disaster-related Deaths per 1,000 Population in the Major Municipalities Severely Damaged in Fukushima Prefecture. (Each number in the parenthesis expresses the absolute number of the population in each municipality, or its subgroup. All data are based on reports by the Reconstruction Agency, the National Police Agency, and Fukushima Prefecture.) a The population which were used for the calculation of the rates are from the National Census on October 1, 2010. 10 The number of disaster-related deaths in each bar in each graph represents the number of disaster-related dead victims who had lived in the prefecture or the municipality when the earthquake occurred, regardless of whether they moved and where they were at the time of their death. c. Number of Dead or Missing and Disaster-related Deaths per 1,000 Population in All the Towns and Villages in Futaba County and Iitate-mura in Sōma County. (Each number in the parenthesis expresses the absolute number of the population in each municipality, town, village, or its subgroup. All data are based on reports by the Reconstruction Agency, the National Police Agency, and Fukushima Prefecture.) a The population which were used for the calculation of the rates are from the National Census on October 1, 2010. 10 The number of disaster-related deaths in each bar in each graph represents the number of disaster-related dead victims who had lived in the prefecture or the municipality when the earthquake occurred, regardless of whether they moved and where they were at the time of their death. d. The Percentage Share of People aged 65 or Older Against the Total Population in All the Towns and Villages in Futaba County and Iitate-mura in Sōma County. (All data are based on reports by National census on October 1, 2010. 10 )

The disaster-related deaths rate of Kawauchi-mura in Futaba County, on the other hand, is the highest of all (Figure 3c, closed bars). As the Area under Evacuation Orders of Kawauchi-mura had been relatively small, decontamination of radioactivity was already complete and the Evacuation Order was lifted on October 1, 2014. 11 However, only less than 20% of the population before the disaster in Kawauchi-mura has returned home, even now, because their life infrastructures, including the workplaces and schools, had concentrated in the area near the nuclear power plant and they were all moved or closed (Figure 2b). Another reason of high disaster-related deaths rate of Kawauchi-mura may be relevant to its own characteristic population structure. People aged 65 years or older comprised 35.2% of the population of the village (Figure 3d). 10 There are no other municipalities of which rate of senior citizens 65 years or older is more than 35.0% near the stricken nuclear power plant in Fukushima Prefecture.
Psychological Stress and Hypertension
Similar to other major disasters,Reference Saito, Kim, Maekawa, Ikeda and Yokoyama 12 – Reference Chen, Li and Xian 14 significant increases in victims’ blood pressure during the aftermath of the Great East Japan Earthquake have been reported.Reference Satoh, Kikuya, Ohkubo and Imai 15 , Reference Murakami, Akashi and Noda 16 There is a high probability that many refugees from the above-described area in Fukushima Prefecture may also have had hypertension after the disaster. Hypertension is one of the most important risk factors for disaster-related deaths. Those exposed to ionizing radiation after the Chernobyl (Ukraine; 1986) explosion may have developed hypertension as a consequence of vascular disease caused by T-lymphocyte depletion, and post-radiation encephalopathy as a result of autoantibodies to specific brain proteins.Reference Kordysh, Goldsmith and Quastel 17 The relationship between radiation exposure at Chernobyl and hypertension could also be attributed partly to psychological stress from cancer-related anxiety and somatization.Reference Kordysh, Goldsmith and Quastel 17 Presently, the external and internal radiation doses of most of the victims of the Great East Japan Earthquake appear to be less than 50 mSv, which is much lower than Chernobyl, and makes it less likely that the hypertension was caused by radiation.
Many investigators have reported that emotional stressors, such as major disasters or the death of a loved one, may trigger hypertension and cardiovascular events.Reference Schwartz, French and Mayeda 18 , 19 Disaster-related death is, on the other hand, difficult to define and judge precisely, because there is no consensus about the criteria of the certification process among the municipalities and the concept of a “disaster-related death” is indeed an administrative term. 20 However, after a major disaster, there are no alternative means of categorizing deaths more precisely. Although the concept of a “disaster-related death” underpins almost all research in the field of disaster medicine, it is imperfect and not a medical definition. Nevertheless, the high refugee rate and incidence of disaster-related death in the municipalities near the Fukushima nuclear plant imply that psychological stress associated with living in shelters or other temporary accommodations with an uncertain future may be underestimated.Reference Yabe, Suzuki and Mashiko 21 In other words, people who lived in areas exposed to high levels of radiation might fear for the future and experience psychological stress even after they have moved away (they may not ever be able to return to their home town to live and work after their sudden evacuation), and that this stress might contribute to disaster-related deaths in the long term.
Discussion
Flexible Strategy and Measures for Preventing Disaster-related Deaths
The landfall of Hurricane Katrina (Category 3 hurricane on the Saffir-Simpson scale) in the United States in August 2005 resulted in more than 1,800 deaths and large numbers of evacuees. Analysis of a timeline of problematic response events during and after the disaster revealed many areas for improvement.Reference Brodie, Weltzien, Altman, Blendon and Benson 22 – Reference Broz, Levin and Mucha 24 A concrete action plan was composed along a time axis, and included key stakeholders, such as residents, municipalities, fire stations, railroad companies, electric power companies, and hospitals. In October 2012, when Hurricane Sandy (Category 2) made landfall, a state of emergency was declared, and an evacuation advisory had been issued one-and-one-half to three days beforehand in New York (USA) and New Jersey (USA). The action plan before landfall involved many kinds of preparation. These actions minimized damages (132 deaths, including Canada), and most systems were restored quickly.Reference Powell, Hanfling and Gostin 25 Society could learn from the aforementioned examples and examine countermeasures in Fukushima Prefecture for disaster-related deaths using a similar time axis-based analysis.
Providing medical support for patients in the intervening period between DMAT activities and the arrival of follow-up medical teams, and support for older refugees who face an uncertainty over the duration of their evacuation, are two major problems that need to be addressed.
Preparing for natural disasters has focused historically on treatment for acute injuries, environmental exposures, and infectious diseases. Many disaster survivors also have existing chronic illness, which may worsen in post-disaster conditions. Although the state provides assistance to affected prefectures immediately after such disasters to cover expenses associated with acute medical needs, especially trauma, this strategy should be reviewed first. The strategy should be flexible and adaptable enough to respond effectively to a variety of disasters, such as tsunamis or nuclear power plant accidents.
Recommendations for Improvement
Although DMATs only examine critical patients and leave the area 48 hours after their arrival, they could play an important role in saving lives if they could change their policy in accordance with the situation. This flexibility was emphasized in the DMAT guideline revised on March 30, 2012. Therefore, to reduce total fatalities further, it may be necessary to measure the characteristics of a disaster promptly after its occurrence to determine what would have been the most effective response strategy. More specifically, it is recommended highly that expending resources to establish an expert panel “Urgent Prevention Teams of Disaster-related Deaths” (UPTODD), either independently or as an extension of existing DMAT arrangements, would be beneficial. The UPTODD teams should focus their efforts on evacuation shelters or temporary accommodation from the subacute phase of the disaster (around four days post-disaster) by undertaking clinical examinations of survivors and promptly providing drugs, such as antihypertensive, anticoagulant, or hypoglycaemic medications, to those who need them. These UPTODD teams should be made up of experts in chronic diseases and degenerative disease.
For effective reduction of disaster-related deaths, it is vital to reserve and increase space in the refuges for exclusive use by older or handicapped people who cannot live in general evacuation shelters (which are called “welfare refuges”). Municipalities need to contract in advance with many facilities, such as nursing homes, to designate their undamaged facilities as welfare refuges and then dispatch care support specialists or provide relief supplies when a disaster strikes.Reference Laditka, Laditka, Xirasagar, Cornman and Davis 26 Although few facilities were designated as welfare refuges after the Great East Japan Earthquake (and they did not have the resources they needed to operate effectively), they reportedly saved many older people.
Conclusion/Next Steps
Clinicians and health care practitioners of many specialties who may be required to give medical support after a major disaster, health care managers, and politicians who are responsible for emergency response planning should recognize that prolonged living as a refugee following a disaster may be fatal, owing largely to psychological stress, especially for older people. To prevent further increases in disaster-related deaths, there is an urgent need for them to provide support for refugees, and follow up on their mental states, regardless of where they presently live.