INTRODUCTION
When high-frequency fire regimes are introduced in tropical forests, pervasive tree mortality leads to grass-dominated savanna systems (Cochrane Reference COCHRANE2003, D’Antonio & Vitousek Reference D’ANTONIO and VITOUSEK1992). This process threatens the small area of tropical dry forest that remains intact (Miles et al. Reference MILES, NEWTON, DEFRIES, RAVILIOUS, MAY, BLYTH, KAPOS and GORDON2006). Assessing the historic role that fire played in structuring dry forests is complicated by human disturbances such as burning, grass introduction and fragmentation (Murphy & Lugo Reference MURPHY and LUGO1986a). Although fires in Central America were thought to be exclusively human-caused (Koonce & González-Cabán Reference KOONCE, GONZÁLEZ-CABÁN and Goldammer1990), lightning-ignited wildfires have been observed in Central American dry forest (Middleton et al. Reference MIDDLETON, SANCHEZ-ROJAS, SUEDMEYER and MICHELS1997). Because fires can spread easily in dry conditions, wildfires were probably more common in dry forests than in wetter forests (Keeley & Bond Reference KEELEY and BOND2001). Still, it is unclear whether dry-forest trees are better at persisting through fires than trees in wetter forests.
Various life-history strategies enable plants to persist in fire-prone areas, such as resprouting from below-ground despite top-kill (i.e. above-ground mortality) or preventing top-kill through fire resistance (Bond & van Wilgen Reference BOND and VAN WILGEN1996). Fire resistance rather than resprouting appears to determine whether trees persist through frequent fires, as species from infrequently burned forests resprout similarly to species from fire-prone savannas but are top-killed at much higher rates during fires (Hoffmann et al. Reference HOFFMANN, ADASME, HARIDASAN, DE CARVALHO, GEIGER, PEREIRA, GOTSCH and FRANCO2009). In fire-resistant trees, bark provides protection from top-kill through its capacity to insulate the stem against heat-induced cambium necrosis, which is mainly determined by its thickness, while bark density and water content have minor effects (Brando et al. Reference BRANDO, NEPSTAD, BALCH, BOLKER, CHRISTMAN, COE and PUTZ2012, Hoffmann et al. Reference HOFFMANN, GEIGER, GOTSCH, ROSSATTO, SILVA, LAU, HARIDASAN and FRANCO2012, Lawes et al. Reference LAWES, ADIE, RUSSELL-SMITH, MURPHY and MIDGLEY2011, Pinard & Huffman Reference PINARD and HUFFMAN1997).
Bark thickness generally increases with stem diameter. Tree species that inhabit frequently burned areas (e.g. savannas) often develop bark thick enough to prevent top-kill as saplings, while species from infrequently burned areas (e.g. wet forests) often do not develop such thickness in even the largest stems (Uhl & Kauffman Reference UHL and KAUFFMAN1990). When forests burn, differential mortality increases the relative abundance of species with thicker bark (Barlow et al. Reference BARLOW, LAGAN and PERES2003, Hopkins & Jenkin Reference HOPKINS and JENKIN1963, Slik et al. Reference SLIK, BREMAN, BERNARD, VAN BEEK, CANNON, EICHHORN and SIDIYASA2010). Within species, trees growing in burned areas have been found to have thicker bark than trees growing in unburned areas (Eriksson et al. Reference ERIKSSON, TEKETAY and GRANSTROM2003, Hegde et al. Reference HEGDE, CHANDRAN and GADGIL1998), which may result from directional selection for thicker bark (Stephens & Libby Reference STEPHENS and LIBBY2006) or fire-induced bark growth (but see Wang & Wangen Reference WANG and WANGEN2011).
In Caribbean dry forests, recurrent hurricanes suppress tree sizes (Van Bloem et al. Reference VAN BLOEM, LUGO and MURPHY2006), yet the most extensive Caribbean dry-forest type, termed deciduous forest (Lugo et al. Reference LUGO, GONZALEZ-LIBOY, CINTRON and DUGGER1978), is characterized by a continuous tree canopy with sparse understorey grasses – a forest structure that is consistent with infrequent burning (Hoffmann et al. Reference HOFFMANN, GEIGER, GOTSCH, ROSSATTO, SILVA, LAU, HARIDASAN and FRANCO2012). In contrast, some coastal Caribbean dry forests, termed scrub forest, are characterized by widely spaced trees interspersed with grasses and shrubs. Human-caused fires are common in scrub forest but rare in deciduous forest (Murphy et al. Reference MURPHY, LUGO, MURPHY, NEPSTAD, Lugo and Lowe1995). The long-term fire regime and recent fires could have selected for thicker-barked trees in the scrub forest compared with the deciduous forest. We measured bark thickness in a Puerto Rican dry forest and compared our results to those of other studies to test the following hypotheses: (1) trees in Caribbean dry forests rarely develop bark that is thick enough to prevent top-kill during fire; (2) within species, bark is thicker in the scrub forest than in the deciduous forest; (3) species that are common in the scrub forest have thicker bark than those that are common in deciduous forest; and (4) bark in Caribbean dry forest is thinner than in savannas, similar to other seasonally dry forests, and thicker than in moist and wet forests throughout the tropics.
METHODS
Study site
This study was conducted in the Guánica Commonwealth Forest (17°58′N, 66°55′W), a 4500-ha protected area located in south-west Puerto Rico (Ewel & Whitmore Reference EWEL and WHITMORE1973). Annual rainfall is highly variable, averaging 860 mm, with a major wet season from August to November and a minor wet season from April to May (Murphy & Lugo Reference MURPHY and LUGO1986b). Temperature fluctuates little throughout the year and averages 25.1 °C. Soils are generally shallow and alkaline (Lugo et al. Reference LUGO, GONZALEZ-LIBOY, CINTRON and DUGGER1978). The forest is composed mostly of deciduous-forest stands, with scrub-forest stands occurring on coastal slopes below 80 m asl, where soils are thinner and interspersed with exposed rock substrate (Lugo et al. Reference LUGO, GONZALEZ-LIBOY, CINTRON and DUGGER1978). We measured trees in the deciduous forest near the Fuerte Capron trail (125–150 m asl) and in the scrub forest near road PR 333 (5–30 m asl).
Study design and field measurements
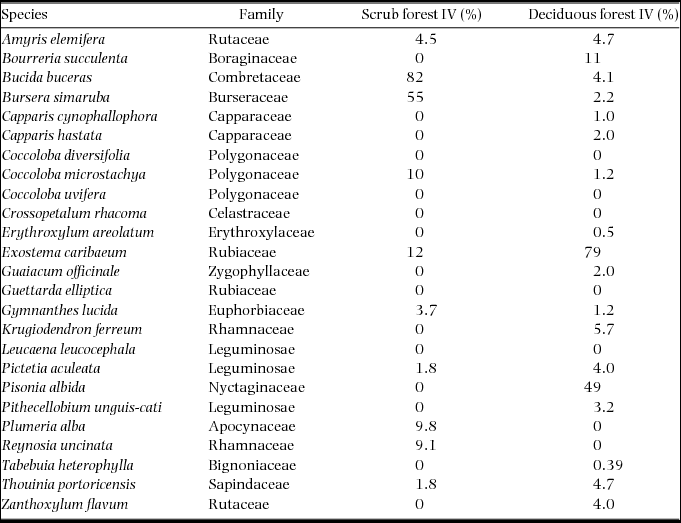
Tree species were selected based on their abundances in the sampling plots of Lugo et al. (Reference LUGO, GONZALEZ-LIBOY, CINTRON and DUGGER1978), which showed similar patterns to more recent sampling efforts (Agosto Diaz Reference AGOSTO DIAZ2008, Ramjohn Reference RAMJOHN2004). Ten of the 11 tree species in the Lugo et al. (Reference LUGO, GONZALEZ-LIBOY, CINTRON and DUGGER1978) scrub-forest plot and 18 of the 27 species in the deciduous-forest plots were selected for measurements. Eight species were shared between the two forest types (Table 1). Five additional tree species were included in this study to compare bark characteristics with sapling survival in a controlled burn experiment (Wolfe & Van Bloem Reference WOLFE and VAN BLOEM2012).
Tree species measured in Guánica Forest, Puerto Rico, for this study. Importance values (IV) are based on stem density and basal area in the plots of Lugo et al. (Reference LUGO, GONZALEZ-LIBOY, CINTRON and DUGGER1978).

Measurements were made between October and December 2008. For each species, we attempted to measure five haphazardly selected stems in each of three size classes (2.5–4.9, 5.0–10 and >10 cm diameter at 50 cm height) in both the scrub and deciduous forests. For many species, measurements of stems in the larger size classes were precluded by the rarity or absence of large stems. Because we searched extensively throughout both habitats for trees in all size classes, the sample likely included individuals of each species near its maximum size in the scrub and deciduous forests. In total, 472 stems of 25 species were measured. Bark thickness was measured to the nearest 0.1 mm with calipers on an 11.1-mm-diameter core that was extracted with a steel punch from the north side of each stem at 50 cm height. Stem diameter was measured at 50 cm and at breast height (dbh, 130 cm) using a diameter tape.
Comparisons between scrub and deciduous forests
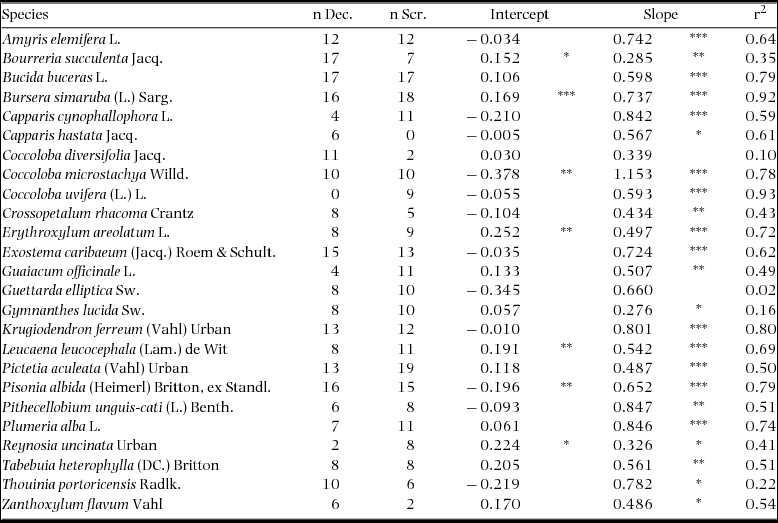
For each species, the relationship between stem diameter and bark thickness was modelled with linear least-squares regression on log-transformed values. Logarithmic transformation was used because most species had log-normally structured error distributions (Xiao et al. Reference XIAO, WHITE, HOOTEN and DURHAM2011). To test for intraspecific differences in bark thickness between the scrub and deciduous forests, we modelled log-transformed bark thickness with ANOVA, including as parameters: species, habitat, log-transformed stem diameter, and the two-way interactions of species by habitat and species by log-transformed diameter. The three-way interaction and the log-transformed-diameter-by-habitat interaction were not included, assuming that for each species the slope of the log-log bark thickness by stem diameter relationship did not vary between habitats, which was confirmed with likelihood ratio tests. Post hoc contrasts were used to test for differences in bark thickness between habitats within each species, correcting for multiple comparisons with a Holm adjustment (α = 0.05). Only the 18 species with ≥5 stems measured in each habitat were included in the model (Appendix 1).
To test whether species with thicker bark are more common in the scrub forest than in the deciduous forest, we calculated an index of relative importance from the plot data of Lugo et al. (Reference LUGO, GONZALEZ-LIBOY, CINTRON and DUGGER1978). For each tree species, an importance value (IV) was calculated as the sum of relative stem density and relative basal area in each plot. These values were then averaged for the two deciduous forest plots. Each species’ scrub/deciduous forest relative IV was calculated as (scrub forest IV + 1)/(deciduous forest IV + 1). One was added to the IV values to prevent values of zero and infinity. We plotted species’ scrub/deciduous forest relative IV against their estimated bark thickness at 5 cm diameter calculated with regression on log-transformed values (Appendix 1). Since the species reach a wide range of sizes in the forest, we also made comparisons of bark thickness at the midpoint of each species’ measured stem diameters, a proxy for bark thickness of adult-sized trees.
Comparisons between Puerto Rican dry forest and other tropical ecosystems
To assess the fire resistance of trees in Puerto Rican dry forest relative to trees in other tropical ecosystems, we compared our measurements to published values of allometric coefficients. Because measurements and analyses varied among studies, we re-analysed our data to follow each source as closely as possible before making comparisons. We then compared allometric coefficients and estimated bark thickness at 10 cm stem diameter between Puerto Rican dry forest and each site using Mann–Whitney U-tests.
Some studies reported the relationship between bark thickness and stem diameter for species pooled within sampling plots (i.e. community-level bark thickness). To compare Puerto Rican dry forest to these sites, we used data from 15 10 × 10-m plots located in a deciduous forest stand within Guánica Forest (Murphy & Lugo Reference MURPHY and LUGO1986b). In each plot, all stems ≥5 cm dbh and ≥ 2.5 cm dbh were identified and measured for dbh within the entire plot and within a 5 × 5-m subplot, respectively. In total, 601 stems of 39 species were measured during a re-census in 2009 (S. J. Van Bloem, unpubl. data). Of these, we had bark thickness data for 17 species totalling 471 stems. We estimated the bark thickness of the 471 stems using species-specific linear regressions of log-transformed values of bark thickness versus dbh.
The deciduous forest plots were also used to estimate the community-wide vulnerability to fire of Puerto Rican dry forest. We estimated the probability that each stem would be top-killed (P top-kill) in a low-intensity fire (flame length ≤2 m) using the logistic regression of Hoffmann et al. (Reference HOFFMANN, GEIGER, GOTSCH, ROSSATTO, SILVA, LAU, HARIDASAN and FRANCO2012). They reported P top-kill in Brazilian savanna fires as a function of bark thickness across 25 species:
 \begin{eqnarray}
P_{{\rm top - kill}} = 1/(1 + \exp ( - 3.95 + 5.15 \times \log _{10} ({\rm T})))\nonumber\\
\end{eqnarray}
where T is bark thickness. Lawes et al. (Reference LAWES, ADIE, RUSSELL-SMITH, MURPHY and MIDGLEY2011) presented similar logistic regression curves from experimental fires in Australian savannas, further supporting the use of bark thickness to estimate P top-kill. Depending on fire characteristics, P top-kill within deciduous dry-forest stands may vary from Eqn (1), but the equation provides a useful point of reference, especially for stands with grass understoreys.
RESULTS
Bark thickness in scrub forest and deciduous forest
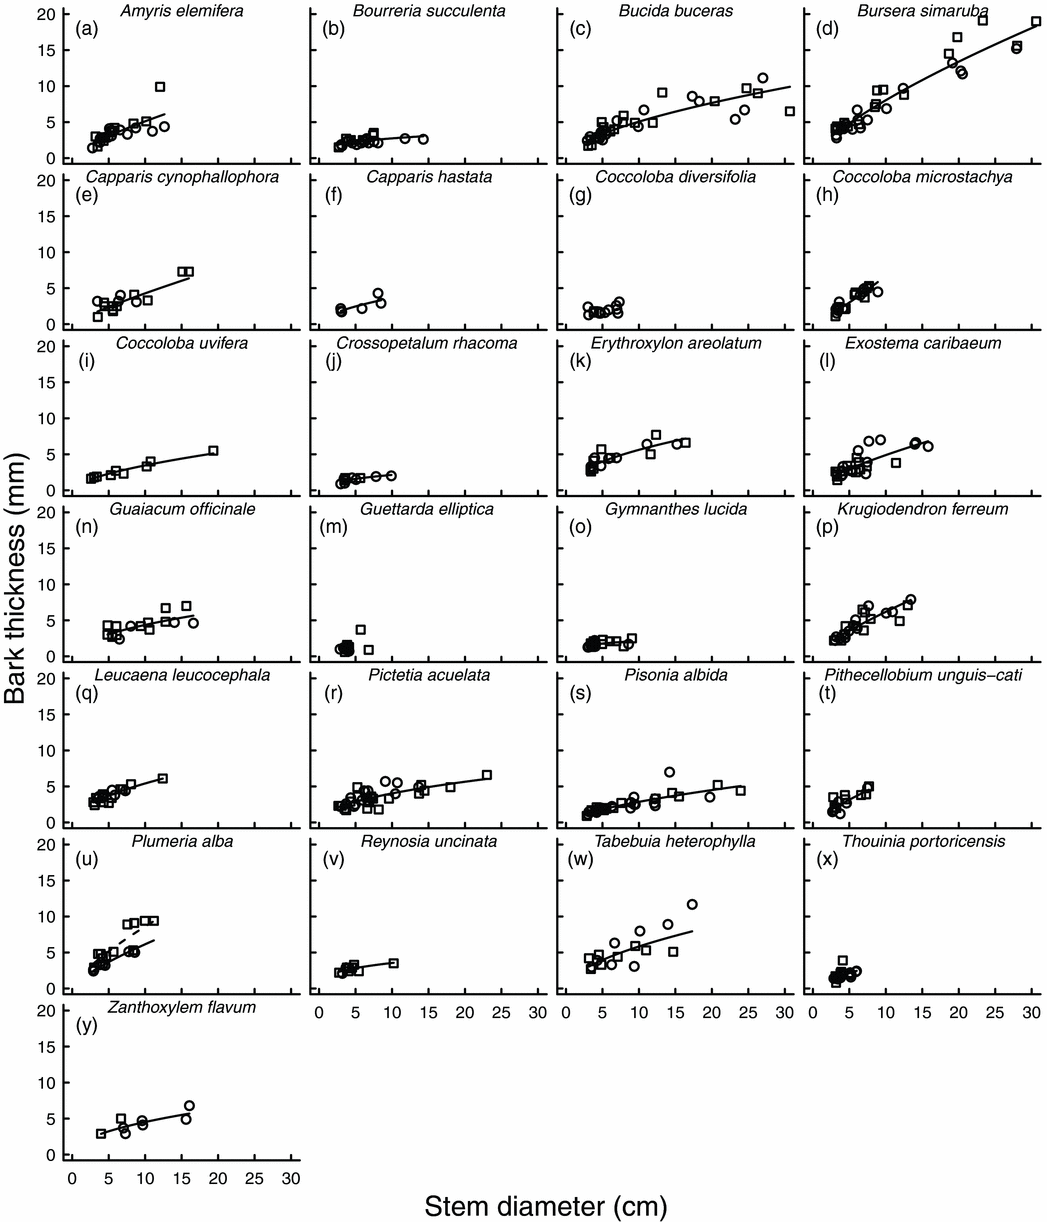
Of the 25 species studied, 23 had bark thickness that increased significantly with stem diameter, even though most species reached relatively small stem diameters (Figure 1, Appendix 1). The rate at which bark thickness increased with stem diameter varied among species (F = 2.70; df = 17, 340; P < 0.001). The interaction term between species and habitat was significant (F = 2.27; df = 17, 340; P = 0.003), indicating that the difference in bark thickness between scrub forest and deciduous forest varied among species; however, only Plumeria alba had bark thickness that varied significantly between habitats (P = 0.043). For P. alba, bark on 5-cm diameter stems in the deciduous forest was predicted to be 3.7 mm thick (3.1–4.4 mm, 95% confidence interval) versus 5.2 mm (4.4–6.2 mm) in the scrub forest.
The relationship between bark thickness and stem diameter for 25 tree species in Puerto Rican dry forest (a–y). Circles and squares represent trees located in the deciduous forest and the scrub forest, respectively. Lines indicate the linear regression on log-transformed values and are not drawn for species with coefficients with P > 0.05. The bark thickness by stem diameter relationship varied significantly between habitats for only one species, Plumeria alba; there, the solid line indicates the regression for deciduous forest and the dashed line indicates the regression for the scrub forest.
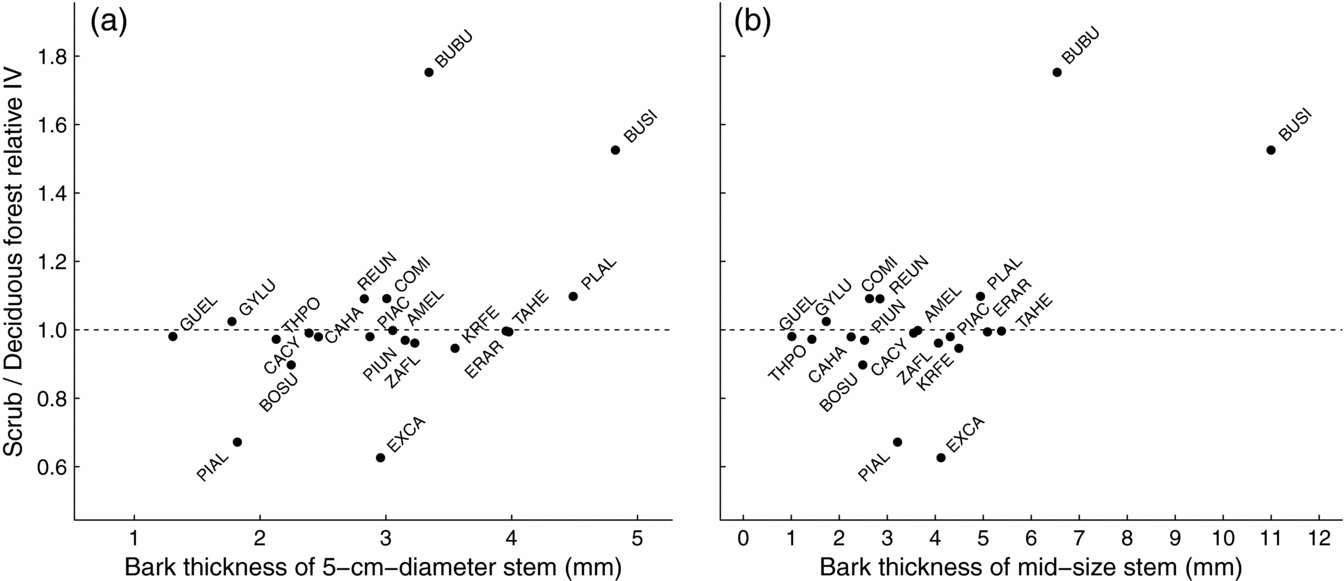
The scrub/deciduous forest relative importance values (IV) ranged widely among species. However, most species had values near 1, indicating little evidence for habitat preference between the scrub and deciduous forests (y-axis in Figure 2). No relationship was found between bark thickness at 5-cm stem diameter and the scrub/deciduous forest relative IV (Figure 2a). Plotting bark thickness of mid-sized stems with the scrub/deciduous forest relative IV revealed that the two species that were highly overrepresented in the scrub forest (i.e. > 1 standard deviation from the mean), Bucida buceras and Bursera simaruba, had the thickest bark on mid-sized stems (Figure 2b). Among the remaining species, there was no relationship between mid-sized-stem bark thickness and scrub/deciduous forest relative IV. The two species that were underrepresented in the scrub forest, Pisonia albida and Exostema caribaeum, had bark thickness that was similar to the species with low habitat preference (Figure 2), suggesting that fire alone does not suppress their relative abundance in the scrub forest.
The relationship between species’ relative importance in the scrub forest versus deciduous forest and their estimated bark thickness at 5 cm stem diameter (a) and estimated bark thickness of a mid-size stem (i.e. midpoint of species’ measured diameters) (b). Each species is labelled with the first two letters of its genus and the first two letters of its species. See Table 1 for species names. The horizontal line at 1 indicates no habitat preference.
Comparisons with other tropical ecosystems
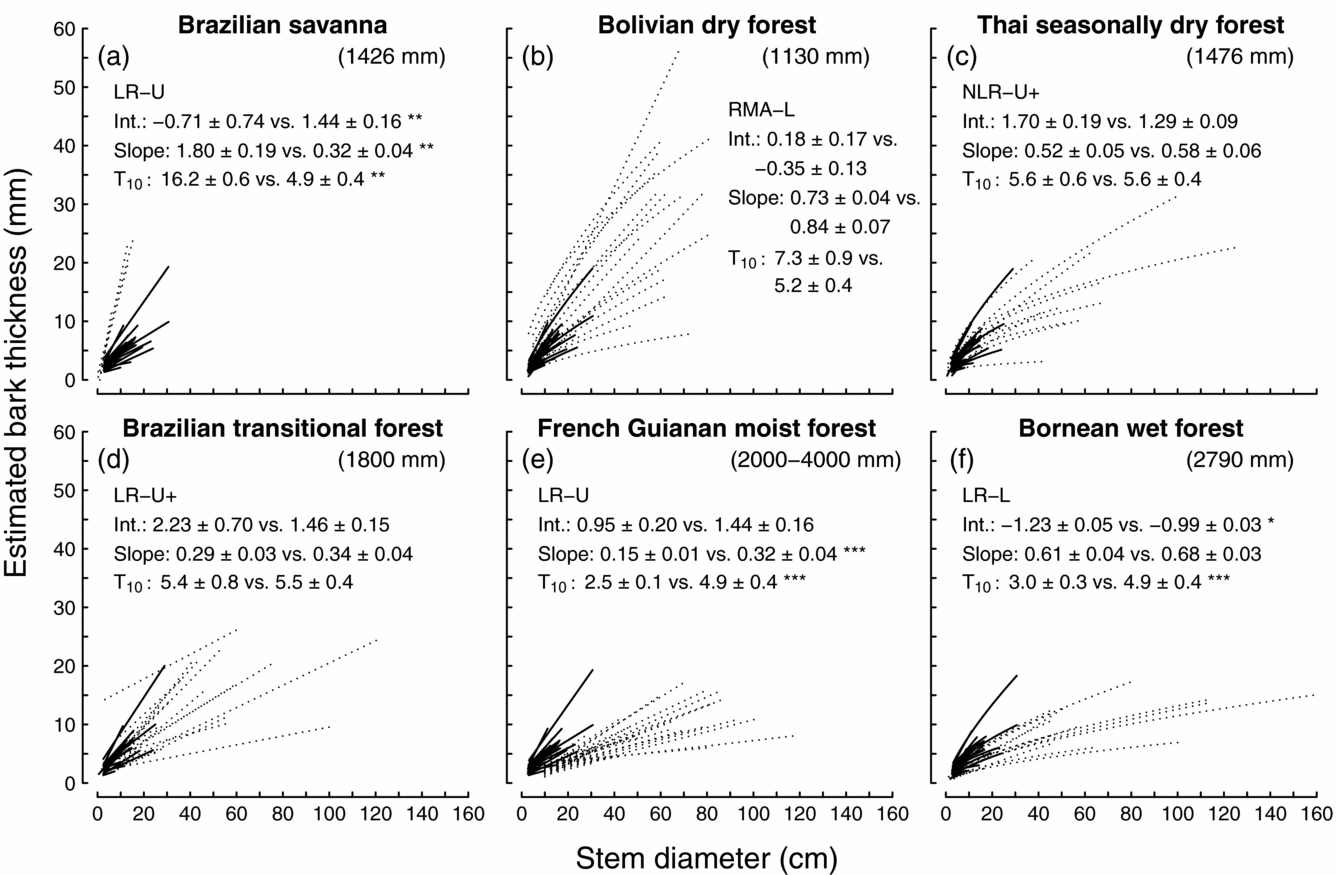
We compared the bark-thickness allometry of tree species in Puerto Rican dry forest to species in six other tropical ecosystems. In general, the regression parameters and estimated bark thickness indicated that the bark of Puerto Rican dry-forest species was thinner than the bark of savanna species, similar in thickness to the bark of species from seasonally dry tropical forests, but thicker than the bark from species in the two wettest forests that we compared (Figure 3).
Comparisons of bark thickness allometry between tree species from Puerto Rican dry forest and species from other tropical ecosystems, including Brazilian savanna (a), Bolivian dry forest (b), Thai seasonally dry forest (c), Brazilian transitional forest (d), French Guianan moist forest (e), and Bornean wet forest (f). In each graph, the site's species are represented with dotted lines, Puerto Rican dry-forest species are represented with solid lines, the site's mean annual rainfall is in parentheses, and the type of regression that the source used to model bark thickness is listed with abbreviations as follows: LR = linear regression, RMA = reduced major axis regression, NLR = non-linear regression, U = untransformed values, L = log transformed values. Most studies regressed bark thickness against stem diameter measured at the same height, whereas ‘+’ indicates that bark thickness lower on the stem was regressed against dbh. For comparisons of the regression intercept (int.), slope, and bark thickness on 10-cm diameter stems (T10), the site's mean ± SE is followed by the mean ± SE from Puerto Rican dry forest. Comparisons with * are significantly different at P < 0.05; **, P < 0.01; ***, P < 0.001; with Mann–Whitney U-tests. Bark thickness values for Puerto Rico vary among comparisons because they were calculated with different regression types and stem heights to follow each source as closely as possible. Sources are Hoffmann & Solbrig (Reference HOFFMANN and SOLBRIG2003) (a), Pinard & Huffman (Reference PINARD and HUFFMAN1997) (b), Baker & Bunyavejchewin (Reference BAKER and BUNYAVEJCHEWIN2006) (c), Brando et al. (Reference BRANDO, NEPSTAD, BALCH, BOLKER, CHRISTMAN, COE and PUTZ2012) (d), Paine et al. (Reference PAINE, STAHL, COURTOIS, PATIÑO, SARMIENTO and BARALOTO2010) (e) and van Nieuwstadt (Reference VAN NIEUWSTADT2002) (f).
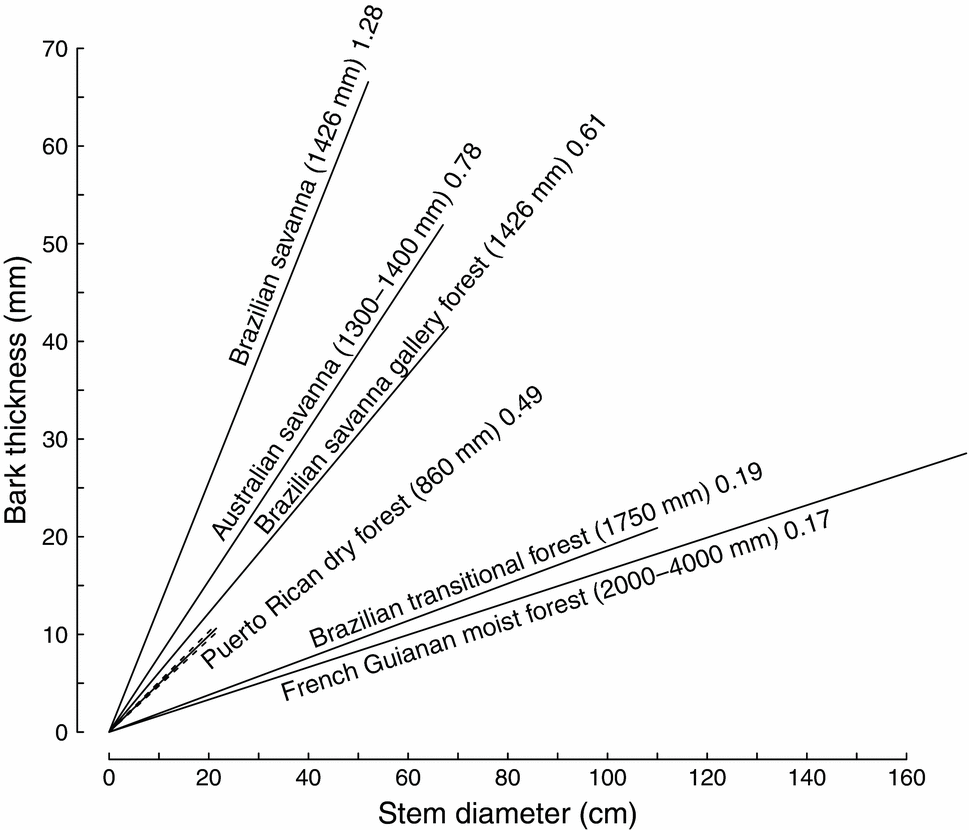
Community-level bark thickness was compared between Puerto Rican dry forest and five other tropical ecosystems. When forced through the origin, the slope of the bark thickness versus dbh relationships indicated that, at any given stem diameter, the Puerto Rican dry forest had thicker bark than a Brazilian transitional forest and a French Guianan moist forest yet thinner bark than a Brazil savanna and its associated gallery forest as well as an Australian savanna (Figure 4). However, as with the species-level comparisons, Puerto Rican dry-forest trees reached much smaller stem diameters than trees in other ecosystems, so large trees in all other forests had thicker bark than the largest trees in the Puerto Rican dry forest (Figures 3 and 4).
The relationship between bark thickness and stem diameter at the community level in a Puerto Rican dry forest stand in comparison other tropical ecosystems. The solid lines represent linear regressions forced through the origin and extend to the maximum dbh of trees measured at each site. Each site is labelled with its annual rainfall and regression slope. The dashed lines indicate 95% confidence intervals. Sources are Hoffmann et al. (Reference HOFFMANN, ADASME, HARIDASAN, DE CARVALHO, GEIGER, PEREIRA, GOTSCH and FRANCO2009), Paine et al. (Reference PAINE, STAHL, COURTOIS, PATIÑO, SARMIENTO and BARALOTO2010) and Lawes et al. (Reference LAWES, MIDGLEY and CLARKE2012).
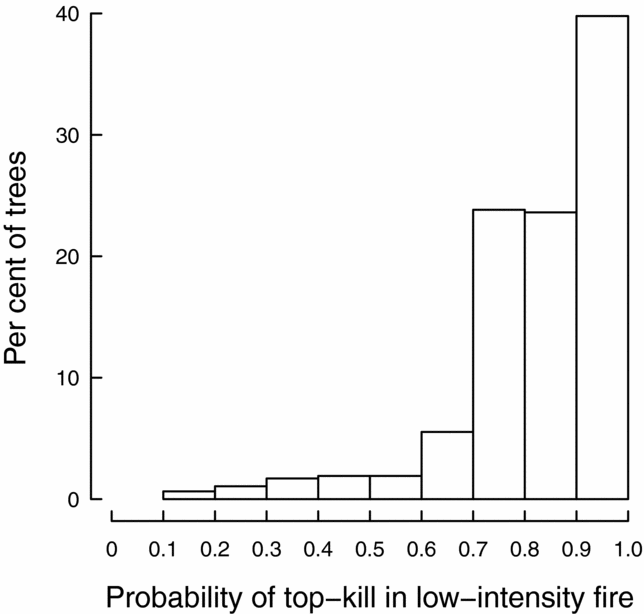
Using Eqn (1) and estimated bark thickness in a deciduous-forest stand within Guánica Forest, the mean P top-kill in a low-intensity fire for trees >2.5 cm dbh was 82.3%. Most trees had a high P top-kill; 40% of trees had a >90% P top-kill (Figure 5). In total, 25 of the 471 trees for which we estimated bark thickness had a <50% P top-kill. These consisted of only four of the 17 species: 16 B. simaruba, four Krugiodendron ferreum, two P. alba and three Tabebuia heterophylla. Although it was not encountered in the sample plots, B. buceras is common as a relatively large tree in the deciduous forest of Guánica Forest (Lugo et al. Reference LUGO, GONZALEZ-LIBOY, CINTRON and DUGGER1978), so individuals of this species are also likely to have <50% P top-kill.
The distribution of the probability of top-kill in a low-intensity fire among trees in permanent sample plots in a deciduous forest stand of Guánica Forest, Puerto Rico. For each tree, the probability of top-kill was calculated using Eqn (1).
DISCUSSION
The role of fire in structuring Puerto Rican dry forest
Most trees in the dry forest of Puerto Rico had bark that is unlikely to prevent top-kill in low-intensity fires. Most species did not have bark thick enough to provide 50% probability of surviving a low-intensity fire (i.e. 5.9 mm, Eqn (1)). Among the species that produced bark thick enough to prevent top-kill, most only produced it on relatively large trees, which are uncommon throughout the forest. Tree size is limited in Puerto Rican dry forest by persistent soil water deficits, occasional hurricane-force winds, and selective cutting that occurred before the 1950s (Murphy & Lugo Reference MURPHY and LUGO1986b, Lugo et al. Reference LUGO, GONZALEZ-LIBOY, CINTRON and DUGGER1978, Van Bloem et al. Reference VAN BLOEM, LUGO and MURPHY2006). A single low-intensity fire has the potential to top-kill the vast majority of trees in deciduous forest stands (Figure 5). Although top-killed Caribbean dry-forest trees often resprout from their base after burning (Santiago-Garcia et al. Reference SANTIAGO-GARCIA, MOLINA COLÓN, SOLLINS and VAN BLOEM2009, Wolfe & Van Bloem Reference WOLFE and VAN BLOEM2012), this ability is ineffective for persisting through frequent fires (Hoffmann et al. Reference HOFFMANN, ADASME, HARIDASAN, DE CARVALHO, GEIGER, PEREIRA, GOTSCH and FRANCO2009). Frequent fires would exclude all but the largest trees of a few species and prevent the current species assemblage from regenerating. Indeed, when forests in this region burn, they are often converted to savannas (Francis & Parrotta Reference FRANCIS and PARROTTA2006). These results suggest that fires were historically rare in the deciduous forest in order for it to develop its current community and structure.
Fires are common in the scrub forest of Guánica Forest, occurring as localized events ignited accidently or as arson by visitors to nearby beaches, which has been an issue for many decades (Murphy et al. Reference MURPHY, LUGO, MURPHY, NEPSTAD, Lugo and Lowe1995; M. Canals, Forest Management Officer, pers. comm.). Various lines of evidence suggest that fire has played a role in structuring the scrub forest. It has a lower density of intermediate-sized stems than the deciduous forest (400 versus 1580 stems ha−1 5–10 cm dbh), but a similar density of larger stems (140 versus 135 stems ha−1 >10 cm dbh; Lugo et al. Reference LUGO, GONZALEZ-LIBOY, CINTRON and DUGGER1978). Because larger stems have thicker bark, overall, a lower percentage of stems in the scrub forest are vulnerable to fire. Furthermore, the two species with outstanding bark thickness on mid-sized stems, Bursera simaruba and Bucida buceras, were highly overrepresented in the scrub forest compared with the deciduous forest (Figure 2b). These species have been described as fire-tolerant species that grow in Puerto Rico as large, isolated trees in annually burned pastoral grasslands (Ewel & Whitmore Reference EWEL and WHITMORE1973, Gleason & Cook Reference GLEASON and COOK1927). It is likely that the large individuals of these two species, which constitute the majority of the basal area of the scrub forest (Lugo et al. Reference LUGO, GONZALEZ-LIBOY, CINTRON and DUGGER1978), are survivors of past fires that removed other species from the area.
Bursera simaruba stood out as the most fire-resistant species in the Puerto Rican dry forest. Although some species had similar bark thickness to B. simaruba on small-diameter stems, their stems did not grow large enough to develop bark that would provide ample fire protection. Only B. simaruba consistently developed bark thick enough to withstand high-intensity fires (i.e. 11.4-mm thick bark conferred 50% survival among trees in high-intensity fires (flame length >2 m) in Brazilian savanna; Hoffmann & Solbrig Reference HOFFMANN and SOLBRIG2003). Bursera simaruba appears to follow a different pattern of resource allocation than the majority of trees in Puerto Rican dry forest. It rarely occurs as a multi-stemmed tree and it had the lowest proportion of individuals that resprouted after a hurricane (Van Bloem et al. Reference VAN BLOEM, MURPHY and LUGO2003). Bursera simaruba has papery thin outer bark that flakes off, revealing the chlorophyll-filled surface of the inner bark. The thick, succulent inner bark may facilitate stem photosynthesis. This species is also particularly vulnerable to cavitation at low water potential (Lopez et al. Reference LOPEZ, KURSAR, COCHARD and TYREE2005); the water stored in the bark may buffer stem water potential during drought. Fire resistance in B. simaruba may therefore be a side effect of its water-use strategy. Despite its role in fire survival, the functional basis for variation in bark thickness among species remains unclear (Paine et al. Reference PAINE, STAHL, COURTOIS, PATIÑO, SARMIENTO and BARALOTO2010).
Bark thickness in tropical forests and savannas
Using Puerto Rican dry-forest species as a point of reference to compare bark thickness among studies that used disparate methodologies, we can compare bark thickness among sites throughout the tropics. Our results support those of Hoffmann et al. (Reference HOFFMANN, ORTHEN and NASCIMENTO2003), who found that savanna species had much thicker bark than forest species. Tree species from drier forests tend to have thicker bark at any given stem diameter than species from wetter forests. The bark thickness parameters of species in Puerto Rican dry forest did not differ from species in three seasonally dry forests that had similarly rare fire occurrences; however, the parameters indicated significantly thicker bark in Puerto Rican dry forest species than in the species from the two wettest forests in our comparison. These results support the idea of grouping tropical trees into functional types based on fire resistance, with savanna species having relatively high fire resistance, seasonally dry-forest species having intermediate resistance, and wet-forest species having relatively low resistance.
We compared bark thickness while controlling for stem size, thus comparing how trees invest in bark thickness versus xylem diameter. When assessing fire resistance, the time needed for trees to develop fire-resistant bark is also relevant. If trees growing in grass-dominated areas are able to develop fire-resistant bark and sufficient canopy closure to shade grasses during a fire-free interval, then recurrent burning is unlikely, allowing a transition to forest (Hoffmann et al. Reference HOFFMANN, GEIGER, GOTSCH, ROSSATTO, SILVA, LAU, HARIDASAN and FRANCO2012). Trees in dry forests generally grow more slowly than trees in moist and wet forests (Schuur Reference SCHUUR2003), so their ability to avoid fire mortality may be similar to wetter forests despite their higher relative investment in bark. Our study site receives annual rainfall that is near the minimum that supports forest cover and tree growth is exceedingly slow (Murphy et al. Reference MURPHY, LUGO, MURPHY, NEPSTAD, Lugo and Lowe1995), increasing the forest's vulnerability to fire. Furthermore, the trees in Puerto Rican dry forest reached smaller diameters than trees from other tropical forests; the largest trees in all other forests tended to have thicker bark than the largest trees in Puerto Rican dry forest (Figures 3 and 4). The structure of our study site is typical of mature Caribbean dry forests, where hurricanes occur, whereas dry forests outside of hurricane zones obtain much higher basal area (Van Bloem et al. Reference VAN BLOEM, LUGO and MURPHY2006). Because hurricanes suppress stem diameter in dry forests, they increase the forests’ vulnerability to fire relative to hurricane-free areas. Thus predictions of fire impacts on forests must account for the impacts that other disturbances have on forest structure.
Conclusion
Predicting how tropical forests will respond to global change is a major challenge. Incorporating the effects of fire into these predictions is necessary. Most tropical forest communities have at least some species that produce fire-resistant bark as mature trees, more so in drier forests. Thicker bark could indicate an adaptation to fire in species from drier forests; however, where hurricanes suppress tree size, forests are more vulnerable to fire than would be predicted by their climate alone. Tree populations in fire-prone areas, such as semi-closed-canopy scrub forest, may be more resistant to fire than populations of the same species that do not experience fire. However, this does not appear to be widespread as only one of 18 species that we tested had significantly thicker bark in a scrub habitat than in a mature deciduous forest. Thus, the ability for dry-forest species to adapt fire-resistance in response to increased fire frequency may be limited. Although there can be no one-size-fits-all fire-management plan, excluding fires from tropical dry forests that do not have a history of frequent burning, especially those in hurricane zones, will facilitate their conservation.
ACKNOWLEDGEMENTS
We thank Miguel Canals and the PR-DNRA for facilitating research in Guánica Forest; Timothy Paine and William Hoffmann for providing unpublished summary statistics; and Carolina Sarmiento, Thomas Kursar, Timothy Paine, Lourens Poorter and two anonymous reviewers for helpful comments on the manuscript. A USDA McIntire Stennis grant to S.J.V.B. and a DOE Savanna River scholarship to B.T.W. supported this project. The USDA Forest Service International Institute of Tropical Forestry provided additional support to S.J.V.B. While preparing the manuscript, B.T.W. was supported by the University of Utah's NSF-GK-12-funded TGLL programme.
Regression statistics for the relationship between bark thickness and stem diameter of study species. Number of stems measured in the deciduous forest (n Dec.) and scrub forest (n Scr.), coefficients for least-squares linear regression of log10-tranformed bark thickness at 50-cm stem height (mm) on log10-tranformed stem diameter (cm) at 50-cm stem height for 25 species in Guánica Forest, Puerto Rico. * P < 0.05, ** P < 0.01, *** P < 0.001.