

Introduction
Japan's annual real GDP growth rate sharply declined in the 1990s. While the drop in itself is a problem, at the same time it exacerbated many other problems, namely inequality, budget deficits, and the increasing burden of an aging society.
Society is not concerned about income distribution when an economy is growing but begins to worry about inequality when an economic slump shows no sign of ending. Actually, the employment situation surrounding young people worsened because of the prolonged recession, causing inequality among them. The ratio of cumulative Japanese government bonds (JGBs) outstanding to nominal GDP was 37% in 1990, and, more importantly, the ratio was declining, but it is now 134%, and is the worst among OECD countries. The budget deficit and rise in cumulative JGBs outstanding was caused by the prolonged recession. Tax revenue shrank and the government repeatedly increased public investment as economic stimulus measures, but the economy did not recover in a sustained fashion. As a result, Japan saw huge deficits.
Japan's low growth has continued for 20 years, which is variously termed the Lost Decade,Footnote 1 the Great Recession, and Great Stagnation. Incomes of the younger and middle-aged segments of the population did not increase during the Great Recession. Additionally, Japanese society is aging. The ratio of those over 65 to the total population was 12% in 1990, but 23% in 2010, and will increase to 42% by 2070. The aged need pensions, medical treatment, and care, costs which must be borne by younger and middle-aged segments of the population, in fact those who have not experienced Japan's prosperous times.
This paper will cover three topics: the Great Recession, inequality, and budget deficit and the burden of an aging population. I will introduce policy discussions on these issues, analyze them, and make policy proposals.
This selection of issues depends on my judgment, and is therefore not objective, but I believe the selection reflects the Japanese concerns now.
1. What caused the Great Recession?Footnote 2
The Japanese economy has traced an unstable recovery since the global financial crisis in 2008; economic growth dropped from 4.6% in the 1980s to 1.2% in the 1990s. This decline is termed the Great Recession, but what were the causes?Footnote 3
Possible explanations
There are at least five key arguments as to what caused the Great Recession. (1) the bubble hypothesis – a bubble and its bursting caused a long slump; (2) the efficiency shock hypothesis – certain structural problems eroded the efficiency of the Japanese economy in the 1990s; (3) the fiscal policy hypothesis – insufficient government expenditure impeded economic recovery (in contrast, another version of this is that too much government expenditure hinders recovery though the so-called ‘non-Keynesian effect’); (4) the financial system hypothesis – that a decline in financial system functions hampered economic growth, which comes in two forms: one is that non-performing assets lessened the ability of banks to extend loans to industry, and the other is that non-performing loans forced banks to extend loans to inefficient industries; and (5) the monetary policy hypothesis – where insufficient monetary expansion caused the slump.
Authors who examine the Great Recession usually discuss most of these hypotheses. Books on the subject cover all or most of the hypotheses.Footnote 4
Below, I discuss these explanations, excluding some as I go, focusing on others, and explore other avenues.
Can the bubble and its subsequent bursting explain the Great Recession?. Many Japanese economists attribute Japan's Great Recession to the ‘bubble’ its subsequent bursting, and financial crisis, but many countries have experienced bubbles, their subsequent bursting, and financial crises. No country, however, has experienced such prolonged stagnation as Japan.
Based on extensive data collection, Reinhart and Rogoff examined the ‘Big Five’ severe financial crises and 13 milder financial crises among advanced countries since World War II (the Big Five are Spain in 1977, Norway in 1987, Finland in 1991, Sweden in 1991, and Japan in 1992, and milder cases are the UK in 1974, 1991, and 1995, Germany in 1977, Canada in 1983, the US in 1984, Iceland in 1985, Denmark in 1987, New Zealand in 1987, Australia in 1989, Italy in 1990, Greece in 1991, and France in 1994).Footnote 5
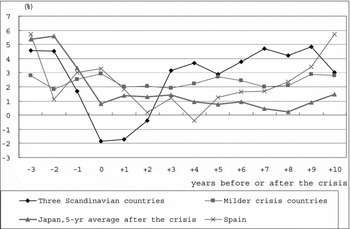
Figure 1 shows the growth rates of real GDP before and after the respective crises of the average of 13 milder crisis-hit countries and the Big Five. The Big Five countries are divided into the average of three Scandinavian countries in 1987 or 1991, Spain in 1977, and Japan in 1992. In the case of Japan, five-year average growth rates after the crisis are shown, as rates greatly fluctuated. Neither the growth rates of milder crisis countries, nor those of the Big Five, except Japan, perpetually declined after their respective crisis. Those of the milder crisis countries did not decline, and those of three Scandinavian countries among the Big Five recovered to the rates before their respective crisis in three years. It took nine years for Spain to return to its growth rate before its crisis, but the growth rate became higher. Only Japan's prolonged stagnation is exceptional, and has to be explained by factors other than the bubble and its bursting.
Real GDP Growth Rates Before and After the Crisis
Source: IMF, International Financial Statistics.
Note: Selection of countries and periods is based on Reinhart and Rogoff, This Time is Different. Growth rates for Japan after crisis are 5-year average. Volatile annual growth rates are also shown.

Was there an inefficiency shock in the 1990s?. Many economists also argue that Japan's low growth rate is best explained by an efficiency shock to its economy using a growth accounting method. Hayashi and Prescott's paper is a pioneering work.Footnote 6 That is, they assert that the Japanese economy received an inefficiency shock, and that the total factor productivity (TFP) growth rate declined in the early 1990s.Footnote 7
No economist, however, can explain what the shock was that caused GDP growth to shrink from 4.6% to 1.2%.Footnote 8 As an exception, Hayashi and Prescott suggest that the shock that reduced GDP growth was the change in market hours when the work week was reduced from 44 hours to 40 hours by law in the early 1990s. Their assertion might be right for the early 1990s, but not after the mid-1990s. The shortening of labor hours might have reduced economic growth and the level of real GDP in the early 1990s, but not after that.
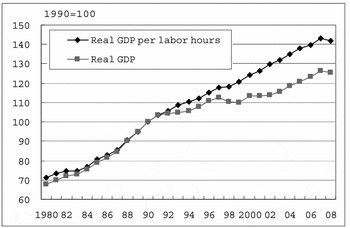
If we look at real GDP per working hour instead of ordinary real GDP, we see a different picture. Figure 2, originally formulated by Bosworth and Jorgenson, shows real GDP per working hour and real GDP (both are indexed at 1990 = 100).Footnote 9 While real GDP growth has declined sharply since the 1990s, real GDP per working hour has not significantly declined.
Real GDP and Real GDP per Labor Hour
Sources: Cabinet Office, Ministry Health, Labor and Welfare.
Notes: 1) total labor hours = workers by industries × labor hours by industries
2) 2008 is estimated by MHLW data.

More careful growth accounting studies that consider capital utilization and other factors also support the contention that GDP per working hour did not decrease. After intensive surveys, Inui and Kwan and Kwan and FukaoFootnote 10 concluded that the decelerating increase in TFP in the 1990s is rather smaller than that given in Hayashi and Prescott.
Among 15 studies (Inui and Kwan, and Kwan and Fukao, and I added MotohashiFootnote 11), for example, Motohashi, Nakajima et al.,Footnote 12 Inui, Kawai and Miyagawa,Footnote 13 Jorgenson and Motohashi,Footnote 14 and KawamotoFootnote 15 show that TFP has not significantly declined. Kawamoto shows that TFP did not change. Nakajima et al., Motohashi, and Jorgenson and Motohashi show that TFP increased, and Fukao et al. show that TFP declined only slightly in the 1990s. If TFP does not decline, then labor productivity, that is GDP per working hour, does not decline much either.
Additionally, and more importantly, the point about the Great Recession is not that the growth rate of real GDP declined in the 1990s compared to the 1980s, but that the real economic growth rate declined in the 1990s compared to the first half of the 1980s. The latter half of the 1980s is a bubble period and the growth rate was high, therefore such a high growth rate in the bubble period should be excluded from the comparison. There is no study showing that TFP growth in the 1990s significantly declined from 1980 to 1985. Fukao et al. and Hayashi and Prescott compare TFP growth in 1983–91 with that in 1991–98 (or 1991–2000), that is comparing growth in the bubble period with that in the post-bubble period. It is natural that the growth rate in the bubble period should decline afterwards. This is a common phenomenon observed in countries that experienced financial crises listed in Section 1.1. Japan's problem is that the growth rate after the bubble period did not return to the normal rate seen in the early 1980s.
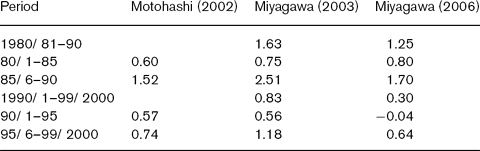
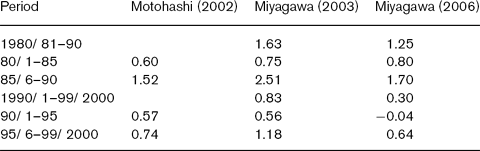
Most of the above studies do not show TFP growth over five years, but three studies do. As summarized in Table 1, Motohashi shows that TFP growth in 1980–85 was 0.60%, but in 1995–2000 was 0.74%. Miyagawa (The Lost Decade)Footnote 16 shows TFP growth in 1981–85 was 0.75%, but in 1991–99 was 0.83%. Miyagawa (Economics of Productivity)Footnote 17 also shows that TFP growth in 1980–85 was 0.80%, but in the 1990s was 0.30%. Actually, the TFP growth rate did not significantly decrease in the1990s compared to the first half of the 1980s.Footnote 18 Hence, an efficiency shock cannot be a valid factor in explaining the Great Recession.
TFP Growth Rates
Japan must have received positive efficiency shocks from the end of the 1980s to early 1990s. I do not intend to assert that the Japanese economy doesn't harbor structural problems that lower its efficiency, for it certainly does. Japan's economy is a dual economy. The export-manufacturing sector, which accounts for only about 20% of GDP, enjoys high productivity, but a feature of other sectors is low productivity. The point is that Japan had structural problems not only in the 1990s but also in the 1980s.
Additionally, Japan had already pursued very substantial structural reforms that imparted a positive efficiency shock on the Japanese economy leading up to the 1990s. Major public corporations, that is Nippon Telegraph and Telephone and Japan National Railways, were privatized in 1985 and 1987, respectively.
Moreover, income and corporate taxes were reduced dramatically before the early 1990s, while a consumption tax was introduced in 1989 and the rate increased in 1997. The ratio of income tax and corporate tax revenue to GDP was 21.9% in 1990, but 17.3% in 2000. Social security contributions increased, but overall taxation/social security contributions were reduced in the 1990s. The ratio of income tax + corporate tax + social security contributions to GDP was 30.8% in 1990, but 27.7% in 2000 (National Accounts, Economic and Social Research Institute, Cabinet Office).
If structural reform was important, tax reduction was an essential structural reform. The huge tax reduction, including the marginal tax rate cut—the maximum income tax rate was reduced from 80% (includes local tax) in 1987 to 50% in 1997, while the consumption tax rose to 5% in 1997 – should have had a big positive impact on the Japanese economy, but we have yet to see that impact.
Did insufficient fiscal stimulus cause the Great Recession?. There are some economists who assert that insufficient government expenditure impedes economic recovery. Japan expanded public investment in the early 1990s and at the end of the 1990s, but could not achieve sustainable growth. Using vector autoregression (VAR) models, KallraFootnote 19 and Ihori et al.Footnote 20 conclude that fiscal policy was ineffective in the 1990s while Kuttner and PosenFootnote 21 assert that it was effective. The results of Posen and Kuttner, however, are obtained from annual data including the bubble period, and are not applicable to the 1990s. Additionally, from 2002 to 2007, Prime Minister Koizumi's administration consistently reduced public investment, but the Japanese economy grew at 2%, the highest five-year average rate after 1990.
Still, some economistsFootnote 22 argue that depression in 1998 was caused by a fiscal contraction of 13 trillion yen (an increase in consumption tax and social security contributions, and a decrease in public investment), which is 2.6% of Japan's GDP, but 1998 saw a financial system shock (big financial companies such as Sanyo Securities, The Hokkaido Takushoku Bank, and Yamaichi Securities went bankrupt in November 1997, and the Long-Term Credit Bank of Japan and The Nippon Credit Bank went bankrupt in October and December 1998, respectively) and the Asian financial crisis (the Asian currency and financial crisis occurred in 1997 and the aftermath continued into 1998). Fiscal contraction was pursued in 1997, but real economic growth that year was 1.6%, and in 1998 minus 2.0%. The timing did not synchronize with fiscal contraction.
Additionally, MatsuokaFootnote 23 pointed out that the Bank of Japan (BOJ) made available 4 trillion yen in special loans (this is borrowed reserves) to the bankrupt financial institutions and at the same time reduced unborrowed reserves by 4 trillion yen in November 1997 by market operation. The 4 trillion yen borrowed reserves for bankrupt financial institutions do not contribute to credit creation, and actually, by doing so, BOJ decreased the ‘active’ monetary base by 4 trillion yen in the middle of the financial crisis. The recession in 1998 was caused by unintended monetary contraction.
At least, we can say that the recession in 1998 was not only caused by fiscal contraction, but also a financial system shock, the Asian currency and financial crisis, and unintended monetary shrinkage by BOJ. Thus, the fiscal factor by itself cannot be seen to be the most important factor in explaining the depression in 1998.
To the contrary, some economists argue that too much government expenditure hinders recovery though the so-called ‘non-Keynesian effect’, which asserts that government expenditure decreases private expenditure by more than government expenditure when the budget deficit is large, and that government expenditure reduces the efficiency of the Japanese economy. Most literature, however, is skeptical about the non-Keynesian effect. KamedaFootnote 24 concludes, after surveying several preceding studies, that consumption increases when large-scale budget restructuring is affected, but not when small-scale restructuring is affected. And the effect does not occur solely because of a big budget deficit or high level of government debt.
It is true that too much government expenditure reduces efficiency, but cumulative public investment increased by only 89 trillion yen from the 1990s and early 2000s. Public investment from 1991 to 2002 was larger than 1990, and after that period was smaller than in 1990. The cumulative difference from 1991 to 2002 was 89 trillion yen, but Japan's public capital stock was 316 trillion yen, and private capital stock excluding residential stock was 1,030 trillion yen, and thus totally Japan's capital stock was 1,346 trillion yen in 2000.Footnote 25 Capital stock would have decreased by only 6.6% (= 89/1346) even if the public investment of 89 trillion yen had been completely useless and all 89 trillion yen had been invested in useful private purposes, though this assumption does not seem very plausible. Thus, the real GDP level would be lower by only 2.2% in 2000.Footnote 26 That means that the 1.2% GDP growth rate in the 1990s could have been 1.4% if it were not for inefficient public expenditures. This then cannot be an important factor in explaining the Great Recession.
Did a decline in financial intermediary function significantly reduce the growth rate?. Some economists argue that the huge non-performing loans (NPLs) of Japan's banking system in the early 1990s were responsible for the Great Recession. There are two reasons. One is that NPLs eroded bank capital, and banks could not expand loans, which reduced the growth rate of the economy. I call this hypothesis the ‘credit crunch hypothesis’. The other reason is that banks continuously extended loans to the very companies that created NPLs in the hope that the problem would eventually somehow go away. This means that to extend loans to inefficient firms makes the whole economy inefficient, and may cause the Great Recession. I call this hypothesis ‘expanded loans to low-return-company hypothesis’.
With respect to the credit crunch, MiyaoFootnote 27 concludes, after surveying several studies, that in the first half of the 1990s the effect was limited with a credit crunch being seen in some sectors of the economy, and that only in 1997–98 was there a credit crunch which affected the economy overall. Woo,Footnote 28 Horie,Footnote 29 and FukaoFootnote 30 show that there was a credit crunch in 1997 and 1998. Woo points out that a credit crunch was not observed in the first half of the 1990s, only in 1997, and Horie could not find any results in data that suggested there was a credit crunch for 1992. They also found that a credit crunch might be experienced by big banks, not small ones, which suggest that the credit crunch was not serious for small and medium-sized companies that borrow from small banks.
Japan has various public financial institutions supporting small companies, such as Japan Finance Corporation for Small and Medium Enterprise and the National Life Finance Corporation (both merged to form Japan Finance Corporation in 2008), and also system infrastructure, such as credit guarantee corporations, in all prefectures, which especially extend loans to small companies in a recession when a credit crunch might occur. While these entities might make the economy inefficient in the long run, in the short run they support it and mitigate the adverse effects of recession.
On the other hand, Sakuragawa,Footnote 31 Kobayashi et al.,Footnote 32 Sugihara and Fueda,Footnote 33 Sugihara and Ota,Footnote 34 and Hosono and SakuragawaFootnote 35 show that banks expanded loans to companies with low returns, a high ratio of non-performing assets (NPAs) to total assets, and a high debt to assets ratio in the 1990s, which suggests they extended loans to non-profitable firms.
How can we gauge the impact of extending loans to non-profitable firms on the total economy? First, we would need to know the amount of loans extended to non-profitable firms, but no study provides these data though the Financial Services Agency has said that aggregate NPLs written off from 1992 to 2008 were 99 trillion yen – these were mainly created in the bubble period through the extension of loans to firms which later become unprofitable. If loans to non-profitable firms totaled 99 trillion yen and assuming that loans to non-profitable firms conducted in the 1990s were, say, one-third of the 99 trillion yen (I think most non-performing loans were created in the bubble period), then the Japanese economy lost 33 trillion yen in normal investment in the 1990s.
As I already mentioned in Section 1.4, however, Japan had total capital stock of 1,346 trillion yen in 2000. Even if the 33 trillion yen in loans had been utilized for completely useless purposes, capital stock would only have been reduced by 2.5% (= 33/1346). This means that real GDP would be lower by only 0.8%,Footnote 36 which translates into the 1.2% GDP growth rate of the 1990s being 1.3% if inefficient loans had not been the case. This also cannot be an important factor explaining the Great Recession.
Was monetary policy important?. The Great Recession occurred simultaneously with deflation since deflation causes stagnation through various channels, and is itself caused by monetary contraction. I thus think monetary policy is important in explaining the Great Recession.
Additionally, unemployment increased from 2.5% in 1990 to 5% in 2000. During this period, the labor market could not have become inefficient because nominal wage rigidity was partly destroyed at the end of the 1990s, and firms could begin to hire labor flexibly such as through temporary employment agencies or from contract agencies. Thus, the Great Recession can perhaps be explained by a decline in the utilization of then existent labor and production facilities. Monetary policy can stimulate an economy in such a situation.
There are many studies that analyze the effects of monetary policy in the 1980s, 1990s, and 2000s by using vector autoregression (VAR) models. In this method, the effect of monetary policy, fiscal policy, and decline of financial functions can be analyzed simultaneously.
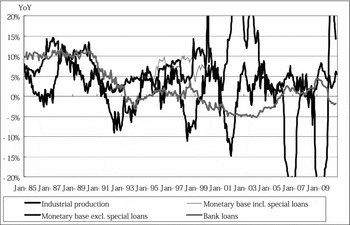
Before introducing the studies, Figure 3 shows industrial production, loans, and monetary base, which a central bank can directly control. On monetary base, the Figure shows two kinds of monetary base series. One is usual series. The other is series excluding special BOJ loans to avoid financial systemic risks based on BOJ Law Article 38 to extend assistance to bankrupt banks or those going bankrupt, because these loans do not create credit. Industrial production seems to have moved in a similar way to loans and monetary base until the end of the 1990s, but after that production diverged. Loans declined continuously, but production recovered in early 2000. Usual monetary base has not moved with production in the end of 1990s, but monetary base excluding special BOJ loans has. Of course, more careful statistical investigation is needed to identify the importance of the above factors.
Production, Monetary base, and Bank loans
Sources: Bank of Japan, Ministry of Economy, Trade and Industry.
Notes: Monetary base excl. special loans = Monetary base - BOJ loans for avoiding financial systemic risk based on Article 38 of BOJ law.
All line graphs modified by smoothing.

There are many studies on the effect of monetary policies during Japan's Great Recession using VAR models. Bayoumi,Footnote 37 Miyao,Footnote 38 Nakazawa et al.,Footnote 39 Baig,Footnote 40 and Iida and Harada,Footnote 41 using VAR models, suggest that a monetary shock might be an important factor in explaining fluctuation in the 1980s and 1990s. These studies are different in the points they emphasize.
Bayoumi stresses various factors such as fiscal policy, monetary policy, and investment during the bubble period, and decline in the financial intermediation function. He thinks that a major factor was the disruption of financial intermediation, largely operating through the impact of changes in domestic asset prices on bank lending. Miyao, Nakazawa et al., and Baig stress the importance of monetary policy. Nakazwa et al. argue that both monetary policy and bank loans affect economic stagnation.
Japanese studies using VAR models tend to stress monetary factors. It might be agreed to some extent among Japanese economists (Miyao, for example) that monetary policy caused the fluctuations at the end of the 1980s and early 1990s. However, there is not necessarily agreement that monetary factors are important in explaining economic fluctuations after the latter half of the 1990s.
Baig shows that additional injections of monetary base have positive impacts on prices and activity through stock price and increase of bank loans.
Iida and Harada focus on the latter half of the 1990s and beyond, and conclude that monetary base and real interest rates generally had a significant effect on output. Loans and prices, on the other hand, do not significantly affect output. The results on the effect of the loans are different from those of Bayoumi, which stress the impact of the financial intermediation function, but the estimation periods are 1986–98 and 1976–2000. Loans decreased from the mid-1990s to early 2000 (except 1999), during which Japan experienced three economic recoveries.
Some studies focus on dynamic stochastic general equilibrium (DSGE) models. Ahearne et al.Footnote 42 shows that BOJ was responsible for deflation by delaying monetary expansion, but Okina et al.Footnote 43 asserts that BOJ could not avoid deflation. The models do not incorporate price rigidity, financial accelerator mechanism, expectations, and non-traditional monetary policy, and the results do not necessarily reflect the real economic mechanism.
The exchange rate has not been noted as a monetary channel to explain the Great Recession except by McKinnon and Ono,Footnote 44 but recently some economists have placed considerable emphasis on the yen exchange rate as a channel of monetary policy to affect output. Hamada and Okada show that wages and prices move rigidly, but stock prices, including the exchange rate, move flexibly, and hence the exchange rate led to prolonged stagnation. HoriFootnote 45 shows that yen appreciation hinders Japan in exporting to emerging Asian countries – using macro export and import functions the work shows that Japan is losing shares not only in low value-added products but also in high value-added ones in the Asian market.
Kobayashi and InadaFootnote 46 show that increases in real wages caused by nominal wage rigidity and deflation reduced employment and growth in the 1990s. This is an important channel by which monetary policy was responsible for the Great Recession. This seems to be a reasonable channel of monetary policy considering that the unemployment rate increased from 2.5% in 1990 to 5% at the end of the 1990s.
Fukuda and OwenFootnote 47 point out other channels where demand shocks drag stagnation. Temporal demand shocks especially decrease youth employment in Japan where existent employment is protected because of the ‘Japanese employment system’, and hinder human capital accumulation in the young. This causes low economic growth for long time.
As mentioned before, there is agreement that monetary policy caused the fluctuations at the end of the 1980s and early 1990s, but there is not agreement that monetary factors are important in explaining economic fluctuations after the latter half of the 1990s, because the mechanism whereby monetary shocks affect perpetually is not clear. Kobayashi and Inada, and Fukuda and Owen might explain the mechanism, but we may conclude that BOJ repeatedly give negative shocks to the Japanese economy, judging from Figure 3.
Quantitative easing monetary policy. Thus far, I have sought to determine factors responsible for stagnation of the Japanese economy, and I show that monetary contraction indeed reduced the growth rate. However, BOJ expanded the monetary base from March 2001 to March 2006, that is it pursued a quantitative easing monetary policy (QEMP). If QEMP had been effective in stimulating the economy in the first half of the 2000s (actually the direction was the opposite), this would have been additional evidence that monetary contraction in the 1990s caused the Great Recession.
Kimura et al.,Footnote 48 Fujiwara,Footnote 49 Mihira et al.,Footnote 50 Honda et al.,Footnote 51 and Harada and MasujimaFootnote 52 analyze the effect of QEMP on output by using vector autoregressive (VAR) models.
Kimura et al. and Fujiwara deny the effect of QEMP on output using VAR models, but their studies were based on data up to the early 2000s, which was too early to conclude that QEMP was not effective on output because quantitative easing was conducted until March 2006.
To the contrary, by using data until 2006, Mihira et al., Honda et al., and Harada and Masujima show that QEMP was effective. Mihira et al. do not analyze the channels that monetary policy affects, but Honda et al., and Harada and Masujima do. Both studies conclude that the asset price channel, that is portfolio rebalancing effect, is important. Additionally, Harada and Masujima show that an improvement in bank balance sheets affects output.
As for quantitative effects, Honda et al. show that monetary policy shocks account for 41% of output volatility and 46% of stock price volatility 12 months ahead. Harada and Masujima conclude that the monetary base explains 35% of total variance in output, and more than 70% when adding the effects of the stock price, exchange rate, stock prices of banks, and prices 24 months ahead.
Additionally, most of the above studies analyze data before the period of QEMP, and almost unanimously conclude that monetary base (or reserves) affected output before 2000.
Of course, a correlation does not necessarily mean causation. Monetary fluctuation might be a result of real economic fluctuation. At least, however, in the mid-1980s, monetary policy was intentionally expansionary. From the end of the 1980s to the early 1990s, policy was also intentionally contracted in order to burst the bubble. Monetary contraction at the end of 1997 was unintentional, but exogenous as pointed out by MatsuokaFootnote 53. Monetary policy in August 2000 (termination of the zero interest rate policy) was intentionally contracted, and after March 2001 (quantitative easing policy) intentionally expansionary. Thus, the criticism that correlation does mean causation cannot be applied to the most part from the 1980s to the 2000s.
Why didn't BOJ expand money?. Then, the simple question arises as to why BOJ didn't ease monetary policy? Why didn't BOJ conduct QEMP except from 2001 to 2006? HaradaFootnote 54 and FukaoFootnote 55 point out that BOJ is afraid of increasing interest rates. Of course, in the short run, QEMP or any easing monetary policy reduces nominal interest rates, but, in the long run, raises them. QEMP stimulates the economy, leading to increases in real output and then higher prices. As a result, nominal interest rates increase because of economic recovery and rise in inflation rate (the Fisher effect). Honda et al., and Harada and Masujima show that QEMP results in raising long-term interest rates.
An increase in interest rates in the long run causes a decline in bond prices, which may negatively affect the balance sheets of banks, which hold huge amounts of bonds in the absence of borrowers. If bond prices decline, then some banks might face serious problems. Of course, if an increase in interest rates is due to a recovery from stagnation and deflation, banks can expand loans and increase interest rates on loans, thereby making a profit. Some banks, however, cannot wait, which BOJ is afraid of. The situation, however, would worsen, because such banks would buy more bonds being unable to find borrowers amid a stagnant economic situation.
Conclusions of Section 1
Japan's Great Recession is basically explained by monetary shocks. The bubble and its bursting could not alone have caused such a prolonged slump. There is also no empirical evidence to support the assertion that certain structural problems reduced the efficiency of the Japanese economy in the 1990s. TFP in the early 1990s did not decline compared to the early 1980s. And, fiscal policy and decline in financial functions can only explain the Great Recession in small part.
The absence of any real monetary policy hampered economic growth through the channels of stock prices and improvements in bank balance sheets. Using VAR models, the exchange rate is not found to be an important channel of monetary policy, though there is some evidence that it significantly affects output.
In order to escape from the Great Recession, active monetary policy was needed, but BOJ, which is afraid of any increase in interest rates and decline in bond prices, is reluctant to conduct aggressive monetary policy as counterparts in other countries have already done.
2. Why is inequality a problem?
The Japanese were previously not concerned with income distribution, because they were satisfied with Japan's relatively high growth compared with other advanced countries, and indeed believed Japan to be a middle class country. Prolonged economic stagnation, however, has changed their conception of the reality, and Japanese are now very much concerned about income distribution. While Japanese still clung to the notion that Japan was an equal society, it became an unequal society in the 1990s.
Since the end of the 1990s, many books and papers covering this subject have been published. Among them, Tachibanaki,Footnote 56 Sato,Footnote 57 Yamada,Footnote 58 Otake,Footnote 59 Ota,Footnote 60 Ota,Footnote 61 and OECDFootnote 62 were noted by the public, policy makers, or academics.
Firstly, I introduce studies explaining the reasons behind growing inequality. Among them, I will focus on those which address aging, inequality among the young, and globalization. Secondly, I discuss whether Japan was an equal country or not. Thirdly, I show the special nature of inequality in Japan and the country's income redistribution policy.
2.1 Causes of expanding inequality
Otake argues that income distribution in Japan has become unequal, but, being caused by the aging population, it is inevitable. Income distribution among the elderly is more unequal than among younger generations, because the incomes of the elderly reflect their life choices. Thus, average income distribution becomes unequal when a country's population is aging.
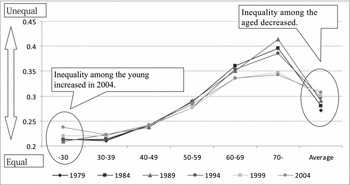
Figure 4 shows Gini coefficients by age groups. The Gini coefficient is an index, which is compiled as 0 if all income is distributed equally and as 1 if one possesses all income. According to this chart, income inequality is shrinking except for those under 30. In particular, income inequality among the 60–69 and over 70 age groups has shrunk. The reason why average inequality of income distribution has expanded while inequality of income distribution by age group has shrunk is that Japan's population has been aging.
Gini Coffecient by Age - Inequality increased by age
Source: Census and Statistics Department, “National Survey of Family Income and Expenditure”.
Notes: Household of two or more. Data of 1979, 1984, 1989, and 1994 are simple average of Gini coefficients by 5-year age groups. Data for those 60–70 in 1979 not available.
Income distribution indexes in 2009 will be published in October 2011.

OtaFootnote 63 agrees with the above argument, but points out that inequality of income distribution in the under 30-year old group has become serious since 1990. The reason is that, while some of them may be hired as regular employees, others are hired as only non-regular employees, or cannot find work at all. That is, the younger generation is divided into regular workers and part-time workers. In Japan, part-time workers are not protected by medical, employment, and pension insurance, and their wages are only one-third that of regular workers.
Some argue that the very nature of the young generation is the problem (these arguments are summarized by Honda et al.Footnote 64 They argue that the younger generations are not prepared to work, and have no sense of work ethic. The most important reason, however, is business conditions. During 2005 to 2008, the ratio of university graduates being hired as regular workers was higher than their counterparts before 2005 and after 2009, because business conditions improved. Unemployment rates for the young are higher than those for the middle-aged and older groups, but the rates move with the trend of total unemployment. To stress the difference of young people now and those in ten or twenty years seems misleading for adopting the proper means to solve the problem.
Globalization is repeatedly referred to as a reason behind rising income inequality, but in Japan there are few academic papers on the subject. OtaFootnote 65 points out that inequality among male workers shrank or was stable until 2004. OtakeFootnote 66 concludes that there was no rapid increase in wage inequality as in the US and UK. More directly, YamamotoFootnote 67 concludes that based on Basic Survey on Wage Structure (Ministry of Health, Labor and Welfare) data, international trade does not heighten wage inequality between skilled and unskilled workers, workers in large firms and those in small firms, or regular and non-regular workers in Japan.
Inequality is an emotional issue, and politicians, journalists and commentators as well as academics discuss the matter. These discussions are summarized in Toyo Keizai.Footnote 68 Among them politicians are very much interested in inequality by region, and argue reduction in public investment causes inequality. This argument is supported by politicians elected from rural constituencies, but it is impossible and much too costly to equalize the incomes of the regions, because the government has to help not only the poor but also the rich in poor areas.
Ministry of Health, Labor and WelfareFootnote 69 argues that the increase in wage inequality within regular workers and that within non-regular workers did not expand, but that wage inequality expanded because of the increase in non-regular workers, and suggests that deregulation causes the inequality. This argument, however, covers only wage inequality, but not income inequality. What will happen if non-regular workers cannot get even non-regular work jobs? The white paper points out that wage inequality shrunk in 2009, but this was caused by dismissal of non-regular workers because of the global financial crisis. The same thing will occur if jobs of non-regular workers are restricted by regulation.
Still, the left-wing view, which includes the left group of the ruling Democratic Party of Japan, supports regulating the labor market by interventions, such as limitation of non-regular work jobs or increase of minimum wages, and some economists support the arguments (for example Tachibanaki).Footnote 70 These policies, however, will not be realized for a while, because of DPJ's defeat in the election of the House of Councilors in July 2010.
2.2 Was there equality in Japan?
Japanese for long believed equality existed in Japan, but have come to change their concept of the reality. Indeed, the OECDFootnote 71 says Japan is not as equal when compared to other advanced countries. The report asserts that Japan's Gini coefficient is the fifth most unequal, and Japan's relative poverty rate the second most unequal among 14 advanced countries.
Japanese society believes that inequality only recently came to the fore. Japan was an equal country, but lately became an unequal country, and still is an equal country among OECD countries. The OECD, however, says that Japan is unequal compared with other advanced countries, which was unexpected, and some criticized the report for basing its findings on the Comprehensive Survey of Living Conditions of the People on Health and Welfare (CSLCPHW) by the Ministry of Health, Labor and Welfare. The survey was conducted through welfare offices, and samples of low income groups are captured, and there is a tendency for inequality to be exaggerated. The OECD report depends on Förster and Mira d'Ercole,Footnote 72 and their study shows that other countries use ordinary household surveys, equivalent to Japan's Family Income and Expenditure Survey (FIES) or the National Survey of Family Income and Expenditure (NSFIE) (both conducted by the Statistics Bureau, Ministry of Internal Affairs and Communications.
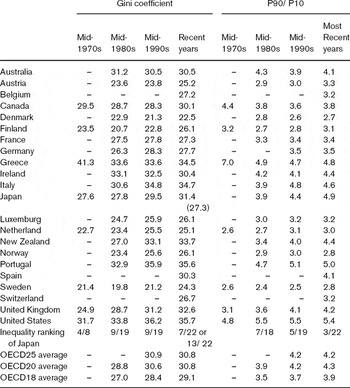
Actually, the CSLCPHW was firstly used for OECD international comparison studies in 2005, and before that the NSFIE was used. When the NSFIE was used, Japan's Gini coefficient was ninth in terms of inequality among 19 countries in the mid-1990s, and after using the CSLCPHW became the seventh among 22 countries in the mid-2000s. Japan's Statistics Bureau published Gini coefficients in 2004 calculated by the NSFIE, and Japan's coefficient became 27.3 instead of 31.4 as calculated by the NSFIE, but still Japan is thirteenth in terms of inequality among 22 countries; see Table 2 (the Gini coefficient is multiplied by 100 in the OECD report). Of course, the effect of using the CSLCPHW was recognized, but Japan was not a very equal country among advanced countries.Footnote 73 Scandinavian countries were and are more equal than Japan.
Changes in Income Inequality Indexes for OECD Countries

Source: Michael Förster and Marco Mira d'Ercole, ”Income Distribution and Poverty in OECD Countries in the Second Half of the 1990s,” OECD Social, Employment and Migration Working Paper 22, March 2005, Annex Table A.3.
Notes: Most recent year refers to year around 2000, except for Belgium and Spain (1995). For Czech Republic, Hungary and Portugal, the period labelled “Mid- 80s to mid- 90s” refers to that from “early to mid- 90s”. OECD25 average includes all countries for which data are available for mid- 90s and 2000. OECD20 average includes all countries for which data were available for mid- 80s, mid- 90s and 2000 and excludes Belgium, the Czech Republic, Hungary, Poland, Portugal, Spain and Switzerland. OECD18 average excludes, in addition, Mexicoand Turkey. OECD25 uses data for reunified Germany, OECD20 and OECD18 use data for West Germany only. Japan's data in parenthesis in recent years is feom “National Survey of Family Income and Expenditure”.
Table 2 shows not only Gini coefficients, but also the P90/P10 index of OECD countries since the 1970s. Concerning Gini coefficients, Japan was the fourth in terms of inequality among eight countries in the 1970s, and ninth among 19 in both the 1980s and 1990s.
Looking at P90/P10 index figures, Japan was seventh in terms of inequality among 18 countries in the 1980s, fifth among 19 in the 1990s, and third among 22 in the 2000s. The P90/P10 index is the ratio (of income) of the ninetieth and tenth percentiles when all in a country are divided into 100.
While Japan was neither equal, nor unequal in terms of the Gini coefficient among advanced countries, it is unequal based on P90/P10, though the figure for the 2000s is affected by using the CSLCPHW.
2.3 The meaning of Japan's high relative poverty rate
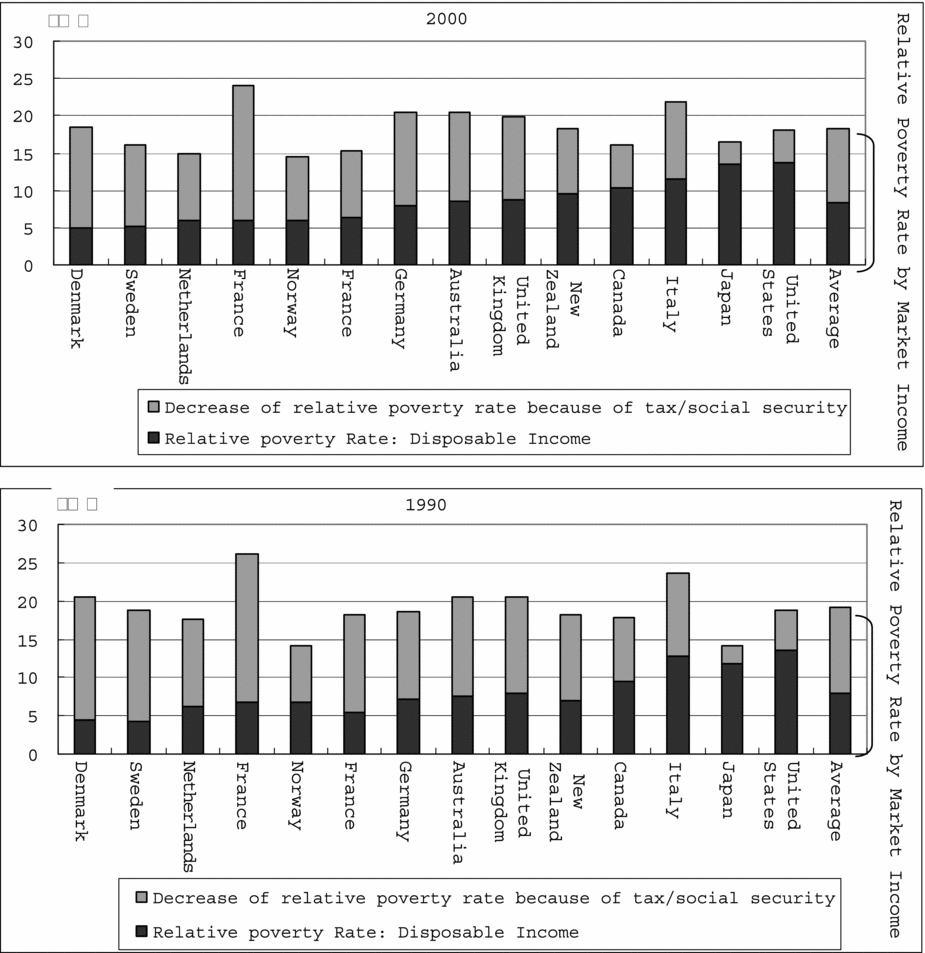
According to the OECD, as shown in Figure 5, Japan's relative poverty rate based on disposable income after tax and social security payments was the second highest after the US among 14 advanced countries in 2000, and in the mid-1990s (for the same income) was the third highest after the US and Italy. The relative poverty rate is the ratio of people with less than median income to total people in a country. This means that while the number of the extremely rich may be small, the number of poor is large in Japan.
Relative Poverty Rates of Market Incomes and Adjusted Incomes in Major Countries
Source: OECD, Economic Survey of Japan 2006, Table 4.9.
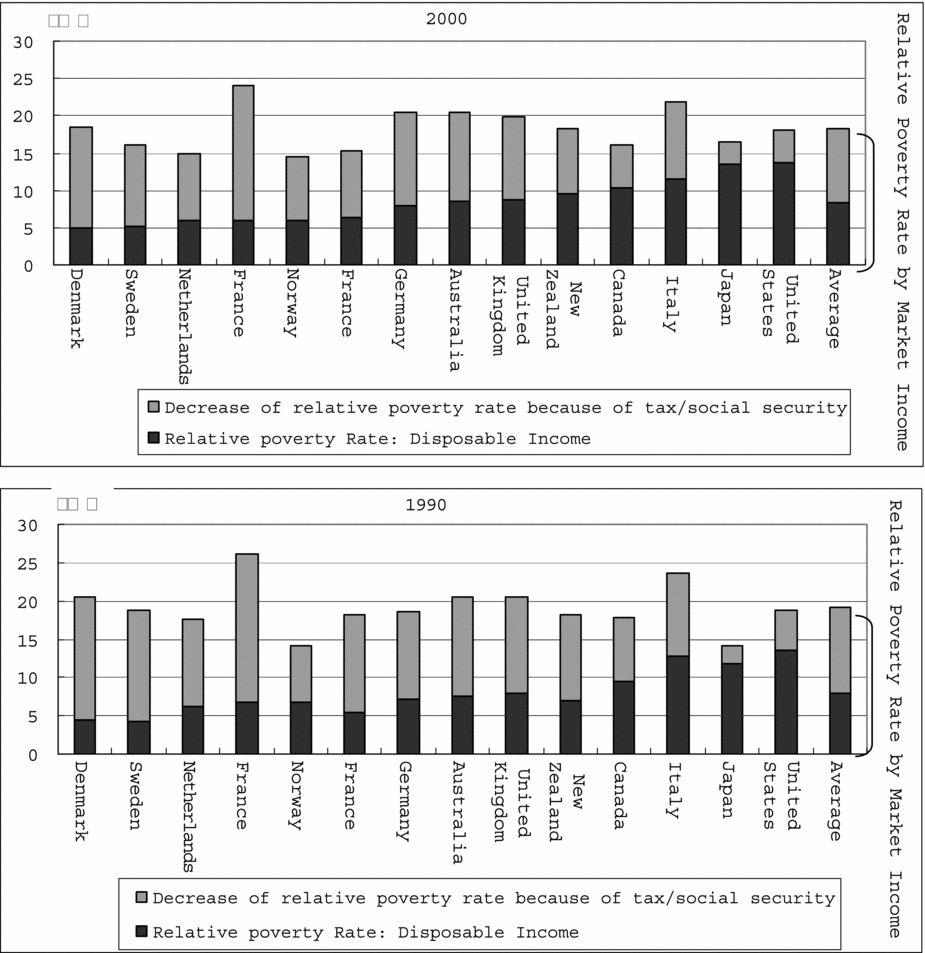
If we look at relative poverty rate in terms of market income (income before tax and social security payments), Japan's relative poverty rate was the sixth lowest after Scandinavian countries, the Netherlands, and Canada in 2000 and in the mid-1990s was the lowest among 14 advanced countries. Japan's relative poverty rate is high in terms of disposable income after tax and social security payments, but low in terms of market income. The reason is that in Japan social security payments such as child allowances, unemployment benefits, and public assistance are low.
For example, Japan's level of public assistance payments on document is as high as those of European welfare states, but Japan does not actually give assistance to the poor. TachibanakiFootnote 74 estimated that the proportion of those who subsist on lower amounts to the total population is 13%, while only 0.7% of the population actually receive public assistance. Additionally, regular workers, who are seldom fired, are heavily protected by the unemployment insurance system, but non-regular workers, who are often fired, are not. Given this strange system, it is natural that the relative poverty rate is high.
Until now, Japan's social stability has been achieved through organizations. An increase in public investment meant giving money to construction companies to hire the unemployed. This was a good idea in that it killed two birds with one stone if the construction companies built the necessary infrastructure, but, in the 1980s, ten years after the end of the high economic growth period, the Japanese government found it difficult to pinpoint suitable infrastructure projects. This became a costly way of maintaining social stability. Japan should have perhaps copied the European way of giving assistance directly to people.
Conclusions of Section 2
I have discussed several points regarding inequality, that among younger generations being particularly important since it increases inequality in the future. Japan's economy will stagnate for a long time if the young do not acquire skills.
Another important point is that Japan's system is extremely inefficient in maintaining social stability. To construct useless dams, roads, ports, and airports is extremely costly just to provide jobs for the unemployed. It would be much better to give direct assistance to the poor.
3. Budget deficit and increasing burden of an aging population
Japan has a huge budget deficit. Some economists take it seriously others not. Government bonds equal debt for the government, but assets for the people. Let's consider the problem in different way. Japanese population declines because of low birth rate. The last Japanese will be born after around 1000 years later if Japan's population decreases at its present rate and he/she will be heir to all the assets and debts of Japan. The government and citizens will be the same if there is only one citizen. The last Japanese, as the government, would have huge debts in the shape of Japanese government bonds, but, as the only citizen, huge JGB assets. The value of JGBs as debts would be exactly the same as that of JGBs as assets. Then, JGBs would be neither debts, nor assets.Footnote 75
JGBs are nothing, but social infrastructure constructed by issuing JGBs is an asset if useful. The last Japanese could not derive any benefit from idle infrastructure such as rarely used roads and bridges, ports where ships seldom dock, airports where planes hardly ever fly, and dams whose stored water is scarcely ever used. Nothing remains if the government used the money obtained from JGBs for current expenses. Useless infrastructure is exactly the same as nothing.
Then, what would happen, if, by raising taxes, and not issuing JGBs, but there is no change in the structure of government expenditures, that is constructing useless infrastructure? The point is to reduce wasteful government expenditures, but not to reduce the budget deficit by raising taxes. Therefore, we can conclude that we do not have to worry about budget deficits, but rather whether the government wisely uses tax money or not.
I do not completely believe in the above argument, and, additionally, the last Japanese would have debts if JGBs were held by foreigners. Then, it would be correct for the Japanese government to decrease the debt step by step.
3.1 Current budget deficit situation
What government figures should be used? Government is divided into central government, local government, and social security funds in the System of National Accounts (SNA). Government debts are defined according to the common definition used worldwide. Japan's social security fund has huge assets, but which it is a saving for future repayment in the form of pensions, and thus cannot really be considered assets. Then, I look at the combined deficit of central government and local governments because the central government budget system involves making huge transfer payments to local governments, controlling them, and, as a result, cannot but help bail them out if they face a budget deficit crisis.
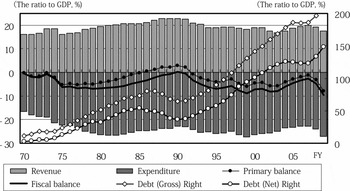
Figure 6 shows the ratio of Japan's central and local government expenditure, revenue, deficit (budget balance and primary budget balance), and debt outstanding to nominal GDP since 1970. Budget deficit was not so serious before 2008. During FY876–92 and FY06–08, budget deficit was shrinking, and debt outstanding to nominal GDP was declining or stable. The reason is simple. Expenditure was controlled, tax revenue rapidly increased during FY87–92, and gradually increased during FY06–08. Before the global financial crisis, Japan had almost succeeded in budget reconstruction. Indeed, it could have significantly reduced the ratio of government debt outstanding to nominal GDP if the government had increased tax by 1% or 2% of GDP, which is equivalent to a 2 or 4 percentage point hike in the consumption tax. Thus, Japan's budget deficit was not a serious problem before the global financial crisis. This view is supported by several works such as Broda and Weinstein,Footnote 76 and Doi.Footnote 77
Budget Deficit Trends
Source: Cabinet Occice, SNA
Notes: Special effects in 1990, 98, 05, 06, 08, 09 are excluded.

Broda and Weinstein think of Japanese government debt as net debt, which means that the government can sell assets to repay it. To the contrary, Doi reject the idea because a major portion of assets comprises pension funds to pay pensions in the future (neither are against some of the assets being used for repayment), but both conclude that Japan could stabilize the ratio of debt to GDP through a reasonable tax hike without resorting to using government assets.
The budget deficit, however, worsened because of the global financial crisis. What happened? As shown in Figure 6, the ratio of government debt (net) to GDP jumped from 123.4% in 2007 to 148.5% in 2010. Government revenue fell by 20.2 trillion yen from 2007 to 2009, and government spending increased by 11.3 trillion yen in the same period. The increase in government spending was caused by fiscal stimulus measures in response to the global financial crisis, but there is no plan to return to the normal spending level of 2007.
Concerning tax revenue, the recovery is weak, and will become weaker. BOJ's passive monetary policy has led to yen appreciation and deflation, the latter resulting in low interest rates, but interest rates cannot be negative, and the difference between interest rates and nominal GDP growth has been substantial. This has made and will continue to make Japan's budget deficit a serious problem.
Lastly and most importantly, Japan's aging population has caused a serious budget problem, which I will discuss in the next section.
3.2 How serious is Japan's aging population for its budget deficit?
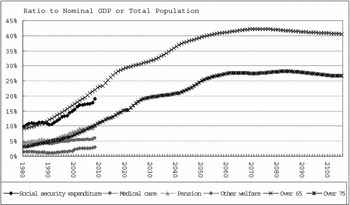
Figure 7 shows the ratio of those over 65 to total population and the ratio of social security expenditure to nominal GDP. Population is estimated until 2105, but social security expenditure until 2008 by the National Institute of Population and Social Security Research. The ratio of social security expenditure to nominal GDP moved in the same way to the ratio of those over 65 to total population until 2002, but then flattened somewhat from 2003 to 2007, but jumped in 2008.
Aging and Social security expenditure
Sources: National Institute of Population and Social Security Research, “Yearbook on Social Security”,
“Population Projection for Japan: 2006–2050” December 2006, Department of Statistics, “Estimated Population in Japan (1920–2000)”.

The increased trend in social security expenditure halted under the Koizumi administration that advocated structural reform, but this policy was abandoned and social security expenditure will increase in the same way as the ratio of those over 65 to total population. If so, the ratio of social security expenditure to nominal GDP, which is probably 23.1% in 2010, will increase to 31.8% in 2030, by which time it will be the same as the ratio of those over 65 to total population (which will have risen to 39.6% by 2050). In this case, the government has to increase the ratio by 8.7% (= 31.8–23.1) in 2030, and by 16.5% (39.6–23.1) in 2050. On the other hand, a 1% consumption tax could obtain revenue amounting to 0.5% of GDP, meaning that a 2% consumption tax would be needed to obtain revenue of 1% of GDP. In short, the Japanese government has to raise the consumption tax by 17.4% (2× [31.8–23.1]) by 2030, and 33% (2× [39.6–23.1]) by 2050.
This is not the end of the story. In the past, when the consumption tax was introduced in 1987, and the rate raised from 3% to 5%, pension payments were also raised so as to be in line with the rise in inflation. Actually, the aged did not bear consumption tax, because they were compensated for the consumption tax hike by an increase in pension payments. In this case, the necessary consumption tax hike will be 33% (2× [39.6–23.1]) in 2030, and 54.6% (33÷ [1–0.39.6]) in 2050, which, I think, are unacceptable tax rates.
Under Prime Minister Koizumi's reformist administration, the ratio of social security expenditure to nominal GDP was stable and controlled, increasing by only 0.7 percentage points from 2002 to 2007, while the proportion of those over 65 to total population increased 3 percentage points in the same period. To the contrary, the ratio of social security expenditure to nominal GDP increased 6.5 percentage points in response to the proportion of those over 65 to total population increasing by 6 percentage points from 1991 to 2002.
The ratio of social security expenditure to nominal GDP will increase by only 2.6 percentage points (0.3× [31.8–23.1]) from 2010 to 2030, while the ratio of those over 65 to total population will increase by 8.7% (31.8–23.1), if the increase trend in social security expenditure is halted as it was under the Koizumi administration. And, the ratio of social security expenditure to nominal GDP would increase only 5.0 percentage points (0.3× [39.6–23.1]) from 2010 to 2050, while the proportion of those over 65 to total population increases by 16.5% (39.6–23.1). Of course, in this case the aged bear the consumption tax. This means that the needed hike in consumption tax rate is only 10%. The increase in the aged will be slow from 2050, and the proportion of those over 65 to total population will peak at 42.2% in 2070, after which the figure will gradually decline enabling Japan to bear the burden.
It may be difficult to adopt this scenario considering that people want to see the expansion of social security expenditure. The government has to find a way to compromise the needs of social security expenditure and the need for a tax increase considering that a 59.6% (current 5% + 54.6%) consumption tax rate is not possible.
Suzuki and HaradaFootnote 78 calculate the necessary consumption tax rates by using more complicated assumptions, but the conclusion is basically the same. Japan has to increase the consumption tax rate to an unacceptable level, or cut social security expenditure per aged person.
Conclusions of Section 3
Japan's budget situation is extraordinary. Some economists argue that the budget deficit is not a serious problem – the important thing is to cut wasteful government expenditure and not raise government revenue. I admit this argument has some validity, but it is still necessary to reduce the budget deficit.
Before the global financial crisis, Japan's budget deficit was controlled, and declining, but since the crisis it has become uncontrollable. Additionally, and more importantly, an aging population requires more social security expenditure, which causes a serious budget problem, which Japan apparently is not ready to tackle.
Conclusions
This paper covers three policy issues, that is the Great Recession, inequality, and budget deficit. The budget deficit is an aging population problem.
Concerning the Great Recession (Japan's prolonged economic stagnation since 1990), many Japanese economists tend to think that it was caused by an efficiency shock, but no economist can prove this, especially since TFP (total factor productivity) in the 1990s did not decline compared to the first half of the 1980s. Instead, I showed that a monetary shock caused the Great Recession by referring to several empirical studies.
The Japanese were not concerned with income distribution when the economy was growing but came to worry about inequality as the economic slump continued. Japanese previously thought that the country was an equal society, but that it is now becoming unequal. Actually, according to the OECD, Japan historically might not have been an equal society among advanced countries. One reason is that Japan's redistribution policy is not effective. Among recent developments, the greater inequality among the young should be noted, because such inequality will increase in the future.
Japan's budget deficit was controlled before the global financial crisis, but after that became uncontrollable. Additionally, the aging population will cause a budget problem. The aged need pensions, and medical treatment and care. Japan has to find both an acceptable tax hike and acceptable cut in social security expenditure.
Finally, I would like to point out that expansionary monetary policy is useful to alleviate some of these problems. Monetary policy can stimulate an economy without increasing the budget deficit; a stimulated economy can absorb unemployed young people, and reduce inequality among the younger generations. Economic recovery through expansionary monetary policy increases tax revenue, and provides social security expenditure without raising the burden on young and middle-aged generations, although such an increase in tax revenue is clearly not enough.
The selection of the topics depends on my observations of Japanese journalism, and does not depend on an objective approach. I, however, believe that the issues, which I selected here, are reflected in Japanese concerns now. Japanese academic circles do not necessarily respond to the interests of society, however I selected academic papers on the topics where possible, but I could not help selecting some from research institutes of government ministries and Bank of Japan.
Appendix 1: Major journals (in English and in local languages)
Journal of the Japanese and International Economies
Japan and the World Economy
The Japanese Economic Review
The Japanese Economy
Japan Echo
Kinyuuu Keizai Kenkyuu (Review of Monetary and Financial Studies)
Nihon Keizai Kenkyuu (Studies in Japanese Economy)
Seisaku Bunseki (The Quarterly Journal of Policy Analysis)
Journal of Economic Policy Studies (Journal in Japanese)
Shakai Seisaku (Social Policy)
Chuou Kouron
Voice (Journal in Japanese)
The Keizai Seminar (Journal in Japanese)
Keizai Bnseki (The Economic Analysis), Economic and Social Research Institute, Cabinet Office
Financial Review (Journal in Japanese), (English version, Public Policy Review), Policy Research Institute, Ministry of Finance
Kinyuu Kenkyuu (Journal in Japanese), (English Version, Monetary and Economic Studies), Institute of Monetary and Economic Studies, Bank of Japan
ESRI Discussion Paper Series, Economic and Social Research Institute, Cabinet Office
RIETI Discussion Paper Series, Research Institute of Economy, Trade and Industry, Ministry of Economy, Trade and Industry,
IMES Discussion Paper Series, Institute of Monetary and Economic Studies, Bank of Japan
Appendix 2: Academic associations in terms of size and sub-specialization
The Japanese Economic Association (Number of Members: 3296)
Japan Society of Monetary Economics (1275)
Japanese Economic Policy Association (1266)
Society for the Study of Social Policy (1126)
Network for Policy Analysis (450)
Appendix 3: International and transnational links
The Japanese Economic Association
Japan Society of Monetary Economics
Japanese Economic Policy Association
Society for the Study of Social Policy
Network for Policy Analysis
Japan Center for Economic Research
Economic and Social Research Institute, Cabinet Office
Policy Research Institute, Ministry of Finance
Research Institute of Economy, Trade and Industry, Ministry of Economy, Trade and Industry,
Institute of Monetary and Economic Studies, Bank of Japan
About the author
After graduation from University of Tokyo in 1974, Yutaka Harada joined Economic Planning Agency, the Government of Japan. He got M.A. in Economics from University of Hawaii in 1979. He worked as Directors of Overseas Research Division and Social Research Division, Economic Planning Agency, and Vice President, Policy Research Institute, Ministry of Finance, and others.
His books are Studies on the Showa Depression (with Kikuo Iwata, and others) awarded Nikkei Prize for Excellent Books in Economic Science, and Theory and Empirical Studies on Prolonged Stagnation (with Koichi Hamada and others),Why are There Many Poor People in Japan, Synchronous Crises in the World Economies (co-authorship), Principles of Japan awarded Ishibashi Tanzan Prize, Don't Be Afraid of Population Declining Society (co-authorship), Why Is Deflation Scary?, Japan's Lost Decade, A Search for Charm of Cities, Economic History of Japan–US Economic Relations and others.