Introduction
The term “unawareness of deficits” describes the inability to recognize the presence or appreciate the severity of deficits in sensory, perceptual, motor, affective, or cognitive functioning (McGlynn and Schacter, Reference McGlynn and Schacter1989). It is common in dementia of Alzheimer's disease (AD) and tends to become more pronounced as the disease progresses (McDaniel et al., Reference McDaniel, Edland and Heyman1995; Zanetti et al., Reference Zanetti1999). Patients with unawareness of deficits have a lower level of cognitive and daily functioning (Migliorelli et al., Reference Migliorelli1995) and often ignore warnings that can lead to accidents, increasing the burden on caregivers (Thompson and Spilsbury, Reference Thompson and Spilsbury1998).
Besides psychosocial factors, biological factors have been proposed to play an important role in unawareness of deficits. Studies showed that patients with AD who had more severe unawareness of deficits had poorer performance on various neurocognitive tests, including the Wisconsin Card Sorting Test, verbal fluency (Michon et al., Reference Michon, Deweer, Pillon, Agid and Dubois1994), memory test (Reed et al., Reference Reed, Jagust and Coulter1993), continuous performance test, and visual reproduction test (Mangone et al., Reference Mangone1991). This suggests that unawareness of deficits is associated with neurocognitive function, predominantly with frontal/executive function and memory, and also with visuospatial function. Neuroimaging studies using functional magnetic resonance imaging (fMRI), such as positron emission tomography (PET) or single photon emission computed tomography (SPECT), have shown unawareness of deficits to be associated with brain structural and functional abnormalities (Vogel et al., Reference Vogel, Hasselbalch, Gade, Ziebell and Waldemar2005; Salmon et al., Reference Salmon2006; Mimura, Reference Mimura2008; Shibata et al., Reference Shibata, Narumoto, Kitabayashi, Ushijima and Fukui2008). Various parts of the brain have been implicated in unawareness of deficits in AD, predominantly in the frontal area, including the right orbitofrontal lobe (Vogel et al., Reference Vogel, Hasselbalch, Gade, Ziebell and Waldemar2005; Salmon et al., Reference Salmon2006; Shibata et al., Reference Shibata, Narumoto, Kitabayashi, Ushijima and Fukui2008), right dorsolateral frontal cortex (Reed et al., Reference Reed, Jagust and Coulter1993), posterior dorsomedial frontal cortex (Mimura, Reference Mimura2008), and cingulate cortex (Hanyu et al., Reference Hanyu2008; Amanzio et al., Reference Amanzio2011). Other neuroimaging findings, including reduced activity in the right post-central gyrus, the right parietotemporal-occipital junction, and the left temporal gyrus on fMRI (Amanzio et al., Reference Amanzio2011), and reduced activity in the medial temporal cortex, temporal-parietal cortex, and orbital prefrontal cortex on FDG-PET, have also been reported (Salmon et al., Reference Salmon2006).
These findings highlight the brain pathologies in unawareness of deficits; however, there are no in vivo human biochemical data addressing the neurochemical changes. Magnetic resonance spectroscopy (MRS) allows accurate and non-invasive measurement of metabolites in the human brain. The major brain metabolites that can be detected from voxels include N-acetyl-aspartate (NAA), phosphocreatine plus creatine (Cr), choline-containing compounds (choline), and myo-inositol (mI). NAA is an amino acid found exclusively in neurons and is a marker of neuronal viability. Pathologies leading to axonal injury or neuronal loss will decrease NAA concentrations (Urenjak et al., Reference Urenjak, Williams, Gadian and Noble1993; Moffett et al., Reference Moffett, Ross, Arun, Madhavarao and Namboodiri2007). Choline is an indicator of cell density and cell wall turnover (Ross et al., Reference Ross, Kreis and Ernst1992). Cr is both the substrate and product of creatine kinase, which is related to cell energy (Kato et al., Reference Kato, Inubushi and Kato1998). mI is regarded as a marker of astrocytes and is a possible marker for intracellular osmotic integrity (Ross, Reference Ross1991). Many studies have reported alterations of various neurochemical metabolites, such as decreased NAA and increased mI in the occipital, temporal, parietal, and frontal regions in AD patients (Klunk et al., Reference Klunk, Panchalingam, Moossy, McClure and Pettegrew1992; Miller et al., Reference Miller, Moats, Shonk, Ernst, Woolley and Ross1993; Pfefferbaum et al., Reference Pfefferbaum, Adalsteinsson, Spielman, Sullivan and Lim1999; Valenzuela and Sachdev, Reference Valenzuela and Sachdev2001); however, there has been no study investigating unawareness of deficits in AD using MRS.
In this study, we aimed to investigate the association between unawareness of deficits and frontal neurobiochemical metabolites among patients with AD using MRS. Because most studies showed unawareness of deficits in AD was associated with the right frontal area and cingulate cortex, we selected the right-side orbitofrontal area and anterior cingulate area for investigation, based on the most likely areas of interest presented in the literature. We hypothesized that certain changes in neurobiochemical metabolites would be associated with unawareness of deficits in patients with AD.
Methods
Subjects
Study participants were recruited from among patients with AD who were seen at an outpatient unit of a teaching hospital. The presence of a caregiver to serve as an informant was required. The diagnosis of AD was based on the Diagnostic and Statistical Manual of Mental Disorders, Fourth Edition, Text Revision (DSM-IV-TR; American Psychiatric Association, 2000), and probable AD on the National Institute of Neurological and Communicative Disorders and Stroke and the Alzheimer's Disease and Related Disorders Association (NINCDS-ADRDA) criteria. All patients were right-handed. Patients with AD who were comorbid with stroke, Parkinson's disease, epilepsy, and traumatic head injury, or who were too frail to complete all assessments were excluded. The protocol was approved by the Institutional Review Board of Kaohsiung Medical University. Informed consent was obtained from all subjects prior to interview.
Assessments
Unawareness of deficits was assessed using the Dementia Deficit Scale (DDS), which was developed by Snow et al. (Snow et al., Reference Snow, Norris, Doody, Molinari, Orengo and Kunik2004). The DDS addresses three major domains of awareness: cognition, emotion/behavior, and daily function. Three parallel forms of the DDS have been developed, one for self-reporting by the patients themselves (DDS-patient), one for informant rating of the patients’ deficits (DDS-informant), and one for clinician rating (DDS-clinician). The DDS yields two measures of deficit awareness: the discrepancy between clinician and patient assessments of the patient's deficits, and the discrepancy between informant and patient assessments. Both have good validity and reliability for awareness of deficits evaluations of patients with AD (Snow et al., Reference Snow, Norris, Doody, Molinari, Orengo and Kunik2004). For this study, we adopted the measurement of the discrepancy between clinician and patient assessments, defined as the Clinician Awareness Score (CAS), based on the assumption that the clinician's rating was the “gold standard.” The DDS-patient and DDS-clinician were independently completed by the patient and the clinician. A research assistant read to the patients and helped them complete the questionnaire, if necessary. In Snow's study, pilot testing revealed that using specific examples of difficulties in the different cognitive domains was necessary for the patients to answer the questions accurately, whereas using more general medical terminology was the best method for eliciting information from the clinicians. Therefore, the DDS-clinician contained only one general item assessing a particular area, whereas the DDS-patient contained two items assessing example difficulties from that area, which led to a different number of items between the DDS-clinician and DDS-patient in the final version. So in the guidance of the DDS, the DDS-clinician and DDS-patient scores must be transformed to z-scores and CAS was calculated as a DDS-clinician z-score minus a DDS-patient z-score (Snow et al., Reference Snow, Norris, Doody, Molinari, Orengo and Kunik2004). Higher scores on the CAS indicated more severe unawareness of deficits. We also evaluated depression using the Cornell Scale for Depression in Dementia (CSDD; Alexopoulos, Reference Alexopoulos2002) and dementia severity using the Clinical Dementia Rating Scale (CDR; Morris, Reference Morris1993) as covariates.
Image acquisition and analysis
Proton magnetic resonance spectroscopy (1H MRS) was performed with a 3-T MR system (GE Medical Systems, Milwaukee, WI, USA). The head coil was used for both imaging and spectroscopy. Conventional MRI, consisting of axial fluid-attenuated inversion recovery (FLAIR) spin echo T1-weighted images (repetition time [TR] = 1,800 ms, echo time [TE] = 10 ms, field of view [FOV] = 24 cm, 320 × 192 matrix, 5-mm sections, 1 average, scanning time = 2 min 21 sec), axial FLAIR T2-weighted images (TR = 8,625 ms, TE = 150 ms, inversion time = 2,250 ms, FOV = 24 cm, 256 × 224 matrix, 5-mm section, 1 average, scanning time = 3 min 27 sec), and transverse fast spin echo T2-weighted images (TR = 4,000 ms, TE = 102 ms, FOV = 24 cm, 256 × 224 matrix, 5-mm sections, 2 averages, scanning time = 1 min 28 sec) were obtained for anatomic registration of the spectroscopic data.
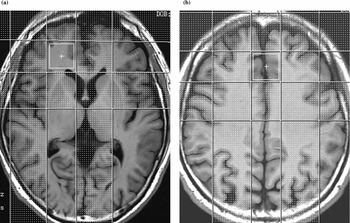
Single-voxel spectra were obtained using point-resolved spectroscopy (PRESS). Water suppression was performed by three preceding chemical-shift-selective saturation (CHESS) pulses (bandwidth = 60 Hz). Water signal was observed to automatically optimize the field homogeneity over the selected voxel of interest (VOI). Acquisition parameters were TR = 1,500 ms, TE = 30 ms, 256 acquisitions, four dummy scans, spectral width = 2,500 Hz, and 2,048 data points. A total of 16 additional acquisitions were performed without water suppression in the sequence for phase correction of metabolite spectra. The acquisition time for each set of MRS data collected was 6 min 54 sec. Once selected, the voxel sizes for the anterior cingulate area and right orbitofrontal area were 2 × 2 × 2 cm3 and 2 × 2 × 1 cm3, respectively. Examples of these two voxel locations and corresponding spectra are presented in Figure 1.
Representation of the position of the VOI in T2-weighted 1H MRS image: (A) right orbitofrontal area; (B) anterior cingulate area.

Determination of metabolite concentrations was carried out by water scaling, in which the resonance area of the unsuppressed water signals was used as an internal reference. Linear Combination of Model Spectra (LCModel), a user-independent frequency domain spectral fitting program, was used. Estimated uncertainties by Cramer-Rao lower bounds served as the main guidelines for judging the spectra of metabolite concentrations. Spectra with a full width at half-maximum (FWHM) >0.070 ppm were not included in the study. Absolute values of NAA, creatine, choline, and mI were reported in mM uncorrected for T1 and T2 saturation. Each spectroscopy voxel was then localized to the subject's segmented tissue map to derive the volume. Percentage of parenchyma and CSF in the spectroscopy voxel and the data were used for partial volume correction of the spectroscopy data. We also calculated the ratio of NAA, choline, and mI relative to creatine level because this pattern has been widely reported in previous publications on the subject.
Statistics
SPSS 13.0 (Chicago, IL, USA) statistical software was used for data analyses. Pearson correlation coefficients were calculated between the CAS and all brain biochemical profiles on MRS, CSDD, and the educational level. We also examined the relationship between unawareness of deficits and CDR using Student's t-tests. Any variable having a significant univariate test at a p-value cut-off point of 0.1 was selected as a candidate for multivariate linear regression analysis with adjustment for age and sex. A p value of less than 0.05 was considered statistically significant.
Results
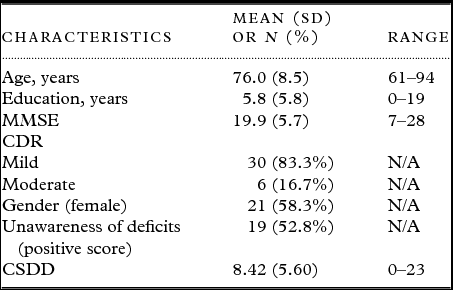
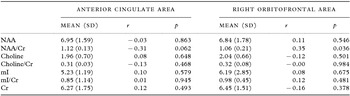
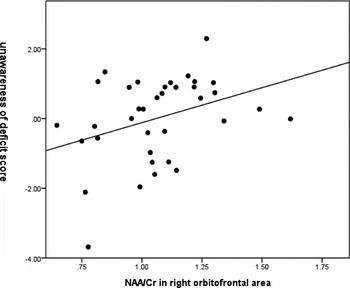
Thirty-six patients with AD were recruited. Characteristics of the study participants are presented in Table 1. The mean patient age was 76.0 ± 8.5 years and the educational level was 5.8 ± 5.8 years; 58.3% of the patients were female and 83.3% had mild dementia (CDR = 1). The mean Mini-Mental State Examination (MMSE) score was 19.9 ± 5.7. The mean CAS score, which indicated the unawareness of deficits score, was 0.01 ± 1.21 (range: −3.68~2.29); 19 patients (52.8%) had positive scores. There was no significant correlation between the CAS and CSDD scores or educational level (r = –0.21, p = 0.219 and r = 0.01, p = 0.953, respectively). A higher CAS score was associated with a lower MMSE score, controlling for age, sex, and education (β = −0.43, p = 0.009). The results of the correlation tests between MRS neurometabolites and the CAS are presented in Table 2. The correlation coefficient (r) of the CAS with a NAA/Cr ratio in the anterior cingulate area was −0.31 (p = 0.062), and with a NAA/Cr ratio in the right orbitofrontal area, 0.35 (p = 0.036). We further examined the correlates of the CAS by conducting multiple regression modeling with the covariates of the NAA/Cr ratio in the anterior cingulate area, NAA/Cr ratio in the right orbitofrontal area, CDR, age, and sex. The results revealed that CAS was negatively correlated with NAA/Cr in the anterior cingulate area (β = −0.36, p = 0.025) and positively correlated with NAA/Cr in the right orbitofrontal area (β = 0.41, p = 0.009; Table 3). The regression scatterplots of the CAS and NAA/Cr in the anterior cingulate area and the right orbitofrontal area are shown in Figures 2 and 3, respectively.
Background characteristics of the participants (N = 36)

Note: SD = standard deviation; MMSE = Mini-Mental State Examination; CDR = Clinical Dementia Rating Scale; CSDD = Cornell Scale for Depression in Dementia; N/A: not applicable.
Pearson correlation between unawareness of deficits score and various metabolite levels in magnetic resonance spectroscopy (N = 36)

Note: SD = standard deviation; NAA = N-acetyl-aspartate; Choline = choline-containing compounds; mI = myo-inositol; Cr = phosphocreatine plus creatine.
Linear regression analysis for variables predicting unawareness of deficits in AD* (N = 36)

*Adjusting for age and sex.
Note: df = 5, 30. CI = confidence interval; NAA = N-acetyl-aspartate; Cr = phosphocreatine plus creatine; CDR = Clinical Dementia Rating Scale.
Regression scatterplot of unawareness of deficits score and NAA/Cr in the anterior cingulate area in Alzheimer's disease (N = 36).

Regression scatterplot of unawareness of deficits score and NAA/Cr in the right orbitofrontal area in Alzheimer's disease (N = 36).

Discussion
In this study, we found over half of the patients with AD had positive CAS scores. Furthermore, the CAS scores were associated with neurobiochemical metabolites on 1H MRS, including a lower NAA/Cr in the cingulate area and higher NAA/Cr in the right orbitofrontal area.
Our results showed that the CAS mean score, representing unawareness of deficits in AD, was 0.01±1.21 (range −3.68~2.29). Over half of the patients (52.8%) had positive scores on the CAS, indicating the patients had relatively less awareness of deficits than the clinician. The rate found in our study was similar to that of previous studies and approached the middle value of previous reports demonstrating a rate of unawareness of deficits ranging from 23% to 75% (Antoine et al., Reference Antoine, Antoine, Guermonprez and Frigard2004). The severity of dementia and co-existing depression have been reported to influence the unawareness of deficits in AD (McDaniel et al., Reference McDaniel, Edland and Heyman1995; Zanetti et al., Reference Zanetti1999; Nakaaki et al., Reference Nakaaki2008); however, our study did not find a similar association between unawareness of deficits and dementia severity and depression in AD. We speculated that this may have been due to the limited number of study participants in the current neuroimaging study.
We also found that unawareness of deficits correlated with a lower NAA/Cr ratio in the anterior cingulate area and a higher NAA/Cr in the right orbitofrontal area. NAA is synthesized in mitochondria and has been implicated in many processes of the nervous system (Bates et al., Reference Bates, Strangward, Keelan, Davey, Munro and Clark1996). It may be involved in the regulation of neuronal protein synthesis, myelin production, or the metabolism of several neurotransmitters such as aspartate or N-acetyl-aspartyl-glutamate (Birken and Oldendorf, Reference Birken and Oldendorf1989). The NAA level corresponds to neuronal integrity and is considered a marker of healthy, normally functioning neurons (Cheng et al., Reference Cheng, Newell, Mallory, Hyman and Gonzalez2002). A lower NAA/Cr level may be due to a decreased NAA level or elevated Cr level. Since Cr is typically used as an internal reference to control for variability in measurement because it remains unchanged in AD (Valenzuela and Sachdev, Reference Valenzuela and Sachdev2001; Kantarci, Reference Kantarci2007), the NAA/Cr ratio may reflect the status of NAA and be considered as an indicator of neuronal functional deficits. In 1992, Klunk et al. demonstrated a decrease in the neuronal metabolite NAA on MRS of autopsy brain samples of patients with AD compared to controls. The lower NAA level was correlated with the amount of plaque and tangle pathology (Klunk et al., Reference Klunk, Panchalingam, Moossy, McClure and Pettegrew1992). Since our study showed the unawareness of deficits was associated with a lower NAA/Cr ratio in the anterior cingulate area and that it tends to become more pronounced as the AD progresses (McDaniel et al., Reference McDaniel, Edland and Heyman1995; Zanetti et al., Reference Zanetti1999), it is possible that unawareness of deficits may be associated with the pathology of plaques and tangles. Our finding suggesting that unawareness of deficits was correlated with lower neuron integrity in the anterior cingulate area is compatible with other functional MRI (Amanzio et al., Reference Amanzio2011) and SPECT (Hanyu et al., Reference Hanyu2008) neuroimaging findings. Clinical studies have found the coexistence of unawareness of deficits, apathy, and disinhibition (Starkstein et al., Reference Starkstein, Sabe, Chemerinski, Jason and Leiguarda1996; Derouesne et al., Reference Derouesne, Thibault, Lagha-Pierucci, Baudouin-Madec, Ancri and Lacomblez1999; Amanzio et al., Reference Amanzio2011). Combining clinical and neuroimaging studies, including ours, the three clinical features share a similar neuroanatomic substrate in the anterior cingulate area (Casey et al., Reference Casey1997; Braver et al., Reference Braver, Barch, Gray, Molfese and Snyder2001; Migneco et al., Reference Migneco2001; Marshall et al., Reference Marshall, Monserratt, Harwood, Mandelkern, Cummings and Sultzer2007). The anterior cingulate area is involved in appraisal of self-relevant information and error detection (Bush et al., Reference Bush, Luu and Posner2000; Johnson et al., Reference Johnson, Baxter, Wilder, Pipe, Heiserman and Prigatano2002; Schmitz et al., Reference Schmitz, Rowley, Kawahara and Johnson2006; Ries et al., Reference Ries2007), and plays an important role in monitoring for conflicts in information processing and action outcomes, and in the subsequent guidance of decision making (Botvinick, Reference Botvinick2007). If the anterior cingulate area is not functioning correctly, patients may fail to detect formless deficits and to register them against templates of past experience. Therefore, patients may be unable to judge it as an unusual experience, which is the basic process of unawareness of deficits.
Another explanation of unawareness of deficits is based on defense and denial mechanisms (Howorth and Saper, Reference Howorth and Saper2003). Patients may deny minimizing or normalizing their problems or difficulties (Howorth and Saper, Reference Howorth and Saper2003; Trouillet et al., Reference Trouillet, Gely-Nargeot and Derouesne2003; MacQuarrie, Reference MacQuarrie2005). The orbitofrontal lobe has been implicated to play a role in cognitively guided defense, such as intellectualization, rationalization, reaction formation, and deception (Northoff et al., Reference Northoff, Bermpohl, Schoeneich and Boeker2007; Lissek et al., Reference Lissek2008). In our study, we found an association between higher NAA/Cr in the right orbitofrontal area and unawareness of deficits in patients with AD, which may suggest that patients with better neuronal integrity in the right orbitofrontal area can put forth more effort to defend or deny their deficits related to dementia. The findings of previous studies support this notion. For instance, structural MRI showed that pathological liars had a widespread increase in the white matter of the orbitofrontal gyri compared to normal controls (Yang et al., Reference Yang2007). Furthermore, functional imaging studies including fMRI and PET showed increased activity in the orbitofrontal area during deceptive behavior (Abe et al., Reference Abe, Suzuki, Mori, Itoh and Fujii2007; Harada et al., Reference Harada2009; Ito et al., Reference Ito2011). Thus, we speculated that, in our study, patients with better neuronal function in the right orbitofrontal area might have a better ability to defend and deny the deficits. However, the differential composition of the MRS voxels of the anterior cingulate area, which has predominantly gray matter, and the right orbitofrontal area, which has predominantly white matter, may also contribute to the opposite results.
To the best of our knowledge, this is the first study using MRS to investigate the association between neuro-metabolites and unawareness of deficits in AD. MRS, different from structural MRI or functional PET/SPECT, can be used to investigate the biochemical change inside neurons and provide a more comprehensive view of the pathology of unawareness of deficits in AD. MRS has also shown superior sensitivity to traditional MRI and could detect small alterations, even without clinical symptoms (Chan et al., Reference Chan, Shungu, Douglas-Akinwande, Lange and Rowland1999). In addition to serving as a marker of preclinical disease, studies have shown that NAA/Cr levels could predict cognitive decline in AD (Adalsteinsson et al., Reference Adalsteinsson, Sullivan, Kleinhans, Spielman and Pfefferbaum2000; Jessen et al., Reference Jessen2001; Kantarci et al., Reference Kantarci2007), and that they improved after cholinesterase inhibitor treatment (Krishnan et al., Reference Krishnan2003; Modrego et al., Reference Modrego, Pina, Fayed and Diaz2006).
Some methodological caveats warrant mention. First, the cross-sectional study design hindered the ability to make causal inferences. In addition, as our study sample was limited to patients with AD recruited from one teaching hospital with a majority of mild dementia patients, the generalizability of the results to all community subjects with AD and other diseases is limited. Further, studies with larger sample sizes from the community and from subjects with other neurocognitive disorders also with unawareness of deficits, such as frontotemporal dementia, vascular dementia, or other kinds of dementia, are needed. Second, the measurement of unawareness of deficits in our study was based on the DDS and the discrepancy between patient self-reports and clinician ratings. Three other approaches to awareness of deficits in the literature were clinician global rating, discrepancy between the patient's self-report and the report of a caregiver, and discrepancy between subjective ratings and neuropsychological performance. All four approaches display inherent limitations in assessment (Clare et al., Reference Clare, Wilson, Carter, Roth and Hodges2002), but clinician assessment has been suggested to be superior to others (Okonkwo et al., Reference Okonkwo, Spitznagel, Alosco and Tremont2010). We used the valid and reliable DDS, which was specifically designed for assessment of unawareness of deficits (Snow et al., Reference Snow, Norris, Doody, Molinari, Orengo and Kunik2004). Third, the metabolite levels in MRS can be quantified in numerous ways, including absolute concentrations and relative levels to creatine or water. Although the method of absolute quantification benefits from unambiguous interpretation (Jansen et al., Reference Jansen, Backes, Nicolay and Kooi2006), our results did not support the association of absolute values of metabolites with unawareness. Instead, the ratio values showed statistical significance. A recent study demonstrating the correlations of antemortem 1H MRS metabolite ratios with postmortem AD neuropathologies supported the clinical significance of MRS metabolite ratios (Kantarci et al., Reference Kantarci2008). Fourth, since unawareness of deficits was reported to be correlated with various neurocognitive tests, the use of neuropsychological tests evaluating various cognitive functions, especially frontal and executive functions, are needed in future studies.
In conclusion, the study findings suggested the involvement of the anterior cingulated cortex and the right orbitofrontal area in unawareness of deficits in AD. The negative association of NAA/Cr with unawareness of deficits in the anterior cingulate area and the positive association in the right orbitofrontal area suggested the two regions had opposite neuronal functions in unawareness of deficits. However, the differential composition of the MRS voxels of the anterior cingulate area and the right orbitofrontal area may also contribute to the opposing results. Further studies with a larger sample size and more precise measurement of MRS are needed.
Conflict of interest
None
Description of authors’ roles
Yi-Chun Yeh designed the study, carried out the statistical analysis, and wrote the paper; Cheng-Fang Yen was responsible for the study and statistical design; Chun-Wei Li, Yu-Ting Kuo, Chia-Hui Chen, Chen-Chang Lee, and Gin-Chung Liu were responsible for imaging methodology design and carrying out the magnetic resonance spectroscopy exam; and Mei-Feng Huang, Tai-Ling Liu, and Cheng-Sheng Chen collected the data and assisted with writing the paper.
Acknowledgments
This work was supported by the Kaohsiung Medical University Hospital, Taiwan (KMUH97–7R20).