INTRODUCTION
The present paper evaluates the mathematical heat balance model described in Thompson et al. (in press). The heat balance model predicts body and skin temperatures and physiological responses such as sweating and respiration rates based on the breed and body characteristics of the animal and climate factors. Since this is the first heat balance model for cattle which is both dynamic and mechanistic, it can be useful in determining heat stress in livestock as well as guiding research in heat stress. A mechanistic model should account for all the major physiological processes related to thermoregulation and for the differences between species. Therefore, livestock producers and researchers can use the model to plan research, and to determine and then mitigate the detrimental effects of heat stress.
A thorough evaluation of a functional heat balance model requires a sensitivity analysis and a comparison against independent data. A sensitivity analysis quantifies the sensitivity of model outputs to its internal parameters. The technique is useful for ranking the importance of model parameters and their contribution to the behaviour and variation of model outputs (Saltelli et al. Reference Saltelli, Ratto, Andres, Campolongo, Cariboni, Gatelli, Saisana and Tarantola2008). In addition, the results of the sensitivity analysis can be used as a decision-making tool to guide future experiments, by identifying which measurements would be most helpful for both estimating heat balance in the animal and evaluating the predictive ability of the model. The current study evaluates the Thompson model (in press) with the use of three different sensitivity analyses and by testing model predictions against independent datasets from Allen (Reference Allen1962), Brown-Brandl et al. (Reference Brown-Brandl, Nienaber, Eigenberg, Hahn and Freetly2003, Reference Brown-Brandl, Eigenberg, Nienaber and Hahn2005) and Finch (Reference Finch1985).
MATERIALS AND METHODS
Model description
The model equations and methods for simulation are detailed in Thompson et al. (in press). The Thompson model is a heat balance model for growing and mature cattle, and is comprised of three state variables that represent the heat content in the body-core layer, the skin layer and the coat layer (J). The body core loses heat directly through the lungs (both sensible and latent heat loss) and it exchanges heat with the skin layer (all heat exchange variables are in W; W=J/s). The skin layer exchanges heat with the body-core and coat layers and it loses heat directly through cutaneous evaporation. The coat layer exchanges heat with the skin layer and with the environment, the latter being through convection, solar radiation and long-wave radiation (McArthur Reference McArthur1987).
In the Thompson model, as cattle experience heat stress, three physiological processes are implemented to decrease body temperature: vasodilation, and increased respiration and sweating rates. These processes increase heat loss over all state variables (body core, skin and coat).
The environmental inputs into the Thompson model are air temperature, wind speed, humidity and solar radiation. The Thompson model has parameter-specific inputs/values for B. indicus and B. taurus. The current paper evaluates the Thompson model across both species through a sensitivity analysis and a prediction evaluation against independent datasets.
Sensitivity analysis
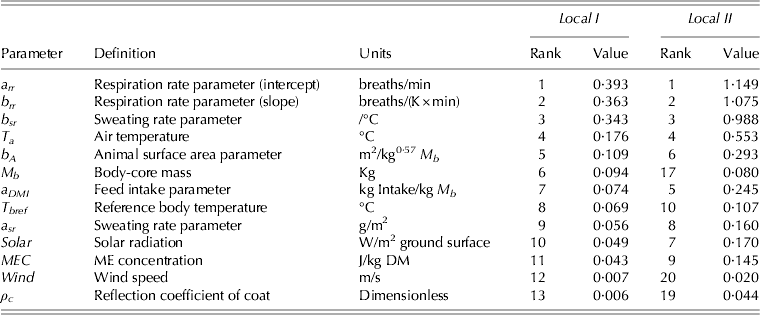
The sensitivity analysis consisted of measuring the sensitivity of the model outputs on 24 model parameters. The sensitivity is a dimensionless variable that can be defined as the change in model outputs with respect to the change in model parameters. Theoretically, the absolute value of sensitivity ranges from zero to infinity, but for practical purposes, a value approaching 1·0 or greater is considered sensitive. Thus, a high sensitivity indicates that a specific model parameter is influential. Three forms of sensitivity analysis were conducted on the Thompson heat balance model: two local sensitivity analyses (Local I and Local II) and one global sensitivity analysis (Global). Global was run under parameter changes ranging from 1 to 10%, which resulted in ±3% being the most realistic range of body temperature. The local analyses were then run at the same change, ±3%, in parameter values. The local sensitivity analyses consist of an evaluation of the effect of each of the parameters on the state variables either at steady state (Local I) or dynamically (Local II). The Local I involves constant climate inputs while the Local II involves the daily fluctuations in the climate variables: temperature, wind speed, humidity and solar radiation. All sensitivity analyses use the climate input information from weather stations in Davis, CA, in the year 2006, Julian day 172 (which represents ‘hot’ climate conditions), where air temperature ranged from 17·7 to 37·2 °C, solar radiation reached 973 W/m2, relative humidity ranged from 14 to 49% and wind speed ranged from 2·3 to 5·6 m/s. All 24 parameters in the model were run through the sensitivity analyses, and the 13 most sensitive are defined in Table 1. All sensitivity analyses were conducted with body temperature (T b, K), calculated from body-core heat content, as the response variable because it has a much greater pool of heat in comparison to skin heat content.
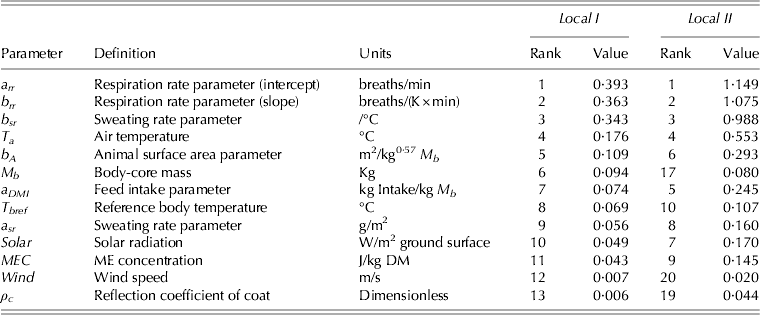
The sensitivity values of parameters evaluated with Local I and Local II for Bos taurus under hot conditions at 14·00 h
Local I
In the Local I analysis, all input parameters and climate variables are set to predefined values; one parameter is adjusted and then the model is rerun. The resulting change in the response variable, ∂T b, can then be used to calculate the sensitivity (S, dimensionless) of the changed parameter as follows:
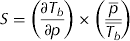 $$S = \left( {\displaystyle{{\partial T_b} \over {\partial p}}} \right) \times \left( {\displaystyle{{\overline p} \over {\overline {T_b}}}} \right)$$
where  $\overline {T_b} $ and
 $\bar p$ are the original (mean) values for the output and the parameter, respectively (the parameter of interest can be any one of the 24 parameters included in the model), S is the sensitivity of T b to the parameter (p). The percent change in the parameter (∂p, %), was set to ±3% for Local I to correspond with the value determined through Global and after the determination that below this value the sensitivity of T b remained linearly related to changes in the parameter. In order to run Local I, climate inputs were set to constant values which referred to a set point in time, e.g. the climate set at 01·30 h, and the model run until T b reached steady state. Once steady state was reached, the value of T b was input into Eqn (1) (as
 $\overline {T_b} $), and the model was rerun with a parameter adjusted by ±3%, to calculate both ∂T b and the sensitivity of T b (S) for each p. This process was implemented at all of the time points from midnight to midnight in 30-min increments, calculating the change in sensitivity throughout the day. All model parameters were tested in the current analysis.
Local II
Local II is a common local sensitivity analysis in which one parameter is changed and the model then runs dynamically for 24 h (due to varying climate inputs) (Turanyi Reference Turanyi1990). With the use of Eqn (1), the difference between the output variable calculated with the original parameter value and that calculated with the adjusted parameter value (parameter ±3%) was calculated continuously over the 24-h run time. Local II differs from Local I in that Local II, the change in T b at any given time point, is a function of both the adjusted parameter value and the value of T b from the previous time step. As in Local I, Local II was run for all model parameters.
Global
Global was conducted using the method described by Saltelli et al. (Reference Saltelli, Ratto, Andres, Campolongo, Cariboni, Gatelli, Saisana and Tarantola2008). Twenty four parameters were included in Global, and a parameter matrix (x ij; i=1,…,10 000 and j=1,…,24) was constructed with each column representing a parameter and each row representing a draw from uniform distributions. The values for each parameter were drawn from 24 uniform distributions, one for each parameter, with upper and lower bounds given as ±3% of the original value. Hence, 10 000 simulations were performed, with the parameter inputs for each simulation being given by a row from the parameter matrix. The T b outputs were saved from each run and stored in a model output matrix (y ik; i=1,…,10 000 and k=1,…,96), with the rows being simulation outputs and the columns a time point from the model (0–24 h) in increments of 15 min. Ninety-five percent confidence intervals were calculated for each column of y with the use of the ‘quantile’ function in R (R Development Core Team 2010).
Standardization takes place in the form of a transformation by the ratio of the standard deviation of a parameter to its mean. The effect of the standardization is to remove the influence of units and place all parameters on an equal level. In a standardized regression setting, the total variation in the data equals 1·0 and each regression parameter squared describes a specific fraction of the model variance that is accounted for by variation in each structural parameter in the dynamic model. The R 2, the coefficient of determination, from the standardized regression will be close to 1·0 if the model is linear in its parameters. The x and y matrices (X ij and Y ik, respectively) were normalized column-wise (thus, each column has a mean of zero and a variance of 1), with the use of the following equation:
 $$X_{ij} = \displaystyle{{x_{ij} - \overline {x_j}} \over {\sigma _{x_j}}} \quad {\rm and}\quad Y_{ik} = \displaystyle{{y_{ik} - \overline {y_k}} \over {\sigma _{y_k}}}. $$
where  $\overline {x_j} $ and
 $\overline {y_k} $ are the jth and kth column-wise mean values of parameter and model outputs, respectively;
 $\sigma _{x_j} $ and
 $\sigma _{y_k} $ are the jth and kth column-wise standard deviations of the parameter and model outputs, respectively; and X ij and Y ik are the normalized parameter and output values, respectively.
The kth set of model outputs (Y i(k)) were regressed on the X ij where the superscript k is used to indicate the kth (k=1,…, 96) regression model, which is given below and fitted using ordinary least square as follows:
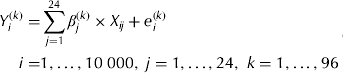 $$\eqalign{Y_i ^{(k)} = & \mathop \sum \limits_{\,j = 1}^{24} \beta _j ^{(k)} \times X_{ij} + e_i ^{(k)}\hskip-10pt \cr i = & 1, \ldots, 10\;000,\; \; \;j = 1, \ldots, 24,\; \; \; k = 1, \ldots, 96}\hskip-10pt $$
where i is the number of model runs, j indexes the parameters and e i(k) is the error term in the kth regression model. The betas,  $\beta _j ^{(k)} $, represent the change in model output standard deviation per one unit change in parameter standard deviation, which is estimated at the kth time point. In the standardized regression setting, the model output variance at the kth time point is given by linear relationships in the parameters and can be calculated as
 $\sum\nolimits_{\,j = 1}^{24} {\beta _j ^{(k)}} $. This is equal to R 2 and hence the quantity 1–R 2 is the fraction of the model variance at the kth time point that is not explained by linear relationships between parameters. This fraction can be interpreted as the degree of nonlinearity in model output caused by interactions between model parameters.
 $\beta _j^2 $ is the change in variance of the model output given one unit change in variance of the parameter. If R 2>0·8 then
 $\beta _j^2 $ is an approximation of the first-order sensitivity indices as given by the modified Sobol method (Saltelli et al. Reference Saltelli, Ratto, Andres, Campolongo, Cariboni, Gatelli, Saisana and Tarantola2008).
Global was run for each species under hot, mild and cold conditions (days 31, 124 and 172). The model was deemed sensitive to a parameter if the square of  $\beta _j ^{(k)} $ from the regression was greater than 0·04 at any given point throughout the day.
All sensitivity-related calculations were performed in R, whereas the Thompson Heat Balance model was run in Matlab (Matlab 2010; R Development Core Team 2010).
Prediction evaluation
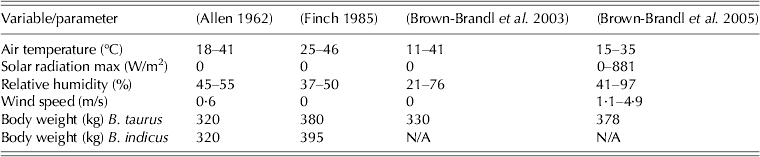
Four datasets were used to evaluate the predictive abilities of the model, including Allen (Reference Allen1962), Brown-Brandl et al. (Reference Brown-Brandl, Nienaber, Eigenberg, Hahn and Freetly2003, Reference Brown-Brandl, Eigenberg, Nienaber and Hahn2005) and Finch (Reference Finch1985). The Allen (Reference Allen1962) and Brown-Brandl et al. (Reference Brown-Brandl, Nienaber, Eigenberg, Hahn and Freetly2003) datasets were used because they contained sweating rates and/or respiration rates. The Brown-Brandl et al. (Reference Brown-Brandl, Eigenberg, Nienaber and Hahn2005) dataset was used for fitting the respiration rate equations within the model, but was further implemented in testing the model because it provided solar radiation data, which allowed the testing of the solar radiation portion of the model. The Finch (Reference Finch1985) dataset was used because it reported values for the two state variables (body and skin heat content) and the environmental inputs.
Air temperature and humidity inputs were available for all datasets. Unless otherwise noted, wind speed was assumed to be zero in climate chambers. The radiant temperature of the surroundings was set equal to the air temperature in the climate chambers, and solar radiation was set to zero. The methods section in the Allen (Reference Allen1962) article states that animals were kept in chambers at a specific temperature for 30–40 min, then measurements were taken and the temperature was raised to the next level. Neither the time it took to raise the chamber temperature nor the time to make the measurements was included in the description. Therefore, to test this dataset, the air temperature input into the model was assumed to remain constant for 35 min and the time that it took to be raised to the next temperature level was assumed to be 10 min.
Another assumption made for the datasets involved the method for modelling heat production from feed intake. Most datasets measured feed intake (all except Allen Reference Allen1962), but the metabolizable energy (ME) of the feed was not provided in any dataset. In addition, all of the experiments included ad libitum feeding immediately prior to the heat stress trials without measuring intake, which was measured only during the trials. A drop in heat production as a result of a drop in feed intake is a delayed effect; thus, because all the experiments were short in duration (max length of 24 h), heat production was assumed to be ad libitum heat production. Ad libitum feed intake was not measured in the experiments; therefore, heat production was calculated with intake being 0·02 kg/kg M b and ME being 10·42×106 J/kg DM.
The statistics implemented to evaluate model prediction v. the experimental results, for the output variables T b, skin temperature (T s), respiration rate and sweating rate, are the Mean bias (°C), the root-mean-square error of prediction (RMSEP, °C) and the errors due to Bias, Slope and Random (dimensionless), as presented by Bibby & Toutenburg (Reference Bibby and Toutenburg1977). Mean bias demonstrates whether the model is over- or under-predicting, whereas RMSEP yields the amount of error of the model predictions. The statistics Bias, Slope and Random are the proportions of error (which sum to 1·0) due to each of those statistics.
RESULTS AND DISCUSSION
Sensitivity analysis
The most sensitive parameters are presented below and in Table 1, which includes the most sensitive parameters from Local I and the corresponding values for Local II for B. taurus. The sensitivity analyses were conducted for both B. indicus and B. taurus under hot, mild and cold conditions, but due to space limitations only the results for B. taurus under the hot conditions, which show the greatest variation in the sensitivities and model behaviour, are presented for each analysis.
Local analyses
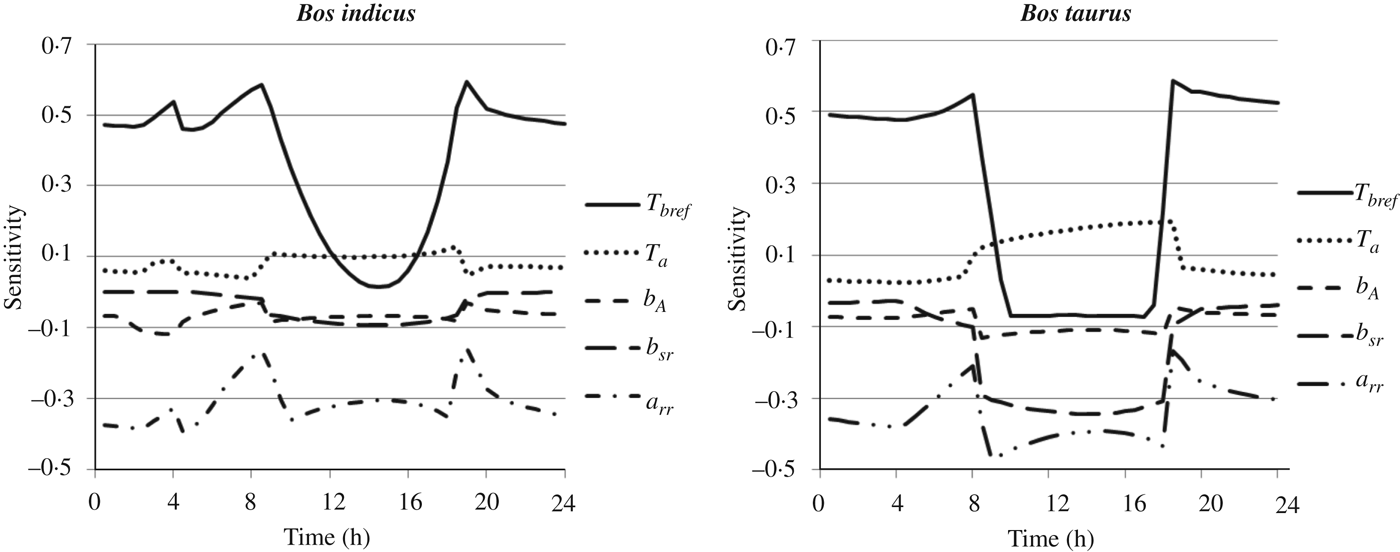
Figure 1 shows the sensitivities of T b for the five most sensitive parameters calculated with Local I for both B. taurus and B. indicus under hot climate conditions. Across all climate conditions, the T b for B. indicus exhibited a greater sensitivity to T bref than did the T b for B. taurus. Under hot conditions, the T b for B. taurus and B. indicus were most sensitive to respiration rate parameters (a rr and b rr, which are the slope and intercept for respiration rate v. body temperature, respectively, although only a rr is shown in Fig. 1 as the pattern for both is similar), sweating rate parameter (b sr; g sweat/m2 of skin area per hour), animal surface area parameter (b A), air temperature (T a) and reference body temperature (T bref) parameters. The parameters a rr, brr and b sr were originally predicted in Thompson et al. (Reference Thompson, Fadel and Sainz2011). Under mild conditions for both species, body-core mass (M b) and a feed intake parameter (a DMI) were more influential than were T a and b sr. In general, as the climate cooled, most parameters decreased in sensitivity whereas T bref increased in sensitivity. The parameters with the highest sensitivity are shown with their respective rankings in Table 1 for B. taurus and B. indicus.
Sensitivity of the most sensitive parameters on predicted body temperature (T b) for Bos indicus and Bos taurus under hot climate conditions using Local I, as described in the methods. The parameters are as follows: T bref is reference body temperature (a vasodilation/vasoconstriction parameter), a rr is a respiration rate parameter, b sr sweat is a sweating rate parameter, T a is air temperature, and b A is an animal surface area parameter.
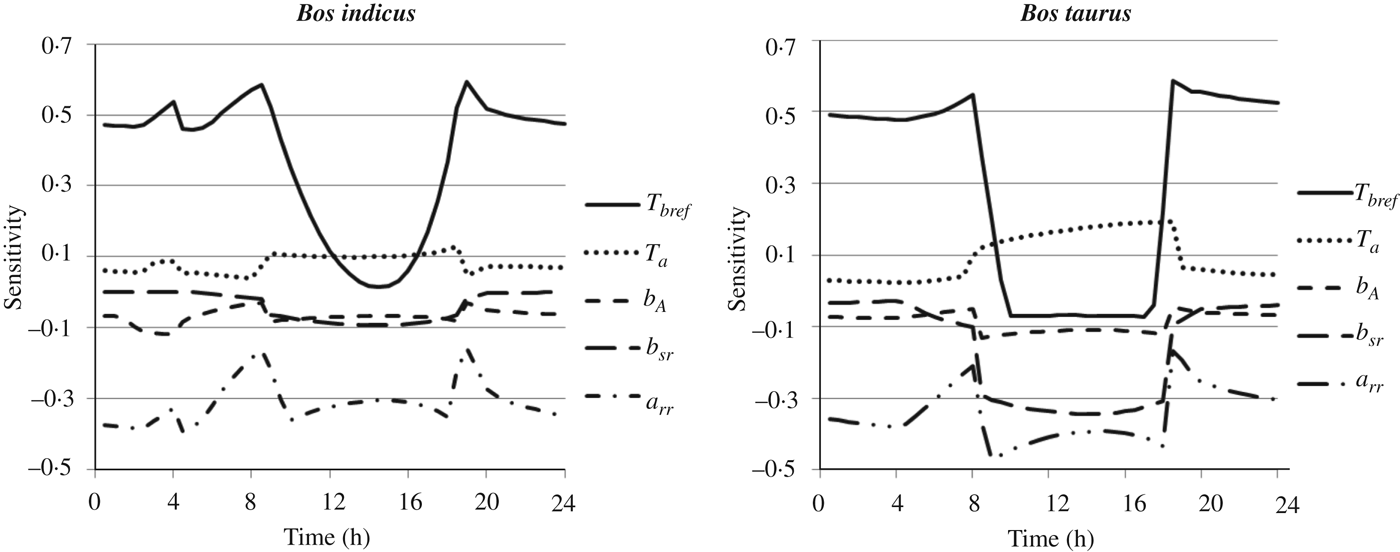
Figure 1 shows sharp changes in the sensitivity of T b for the all of the parameters, except T bref, after sunrise and around sunset (08·00 and 18·00 h, respectively) with the inverse occurring for T bref. These sudden changes result from a maximum function in the body tissue resistance (r s, s/m) equation (Eqn (1.2) in Thompson et al., in press). Body tissue resistance (r s) reached a minimum, representing the maximum amount of vasodilation. Thus, a further increase in the rate of heat loss from the body resulted from increased respiration, causing a sharp increase in the sensitivity of the respiration rate parameter, a rr. At high temperatures, a rr is one of the most important limiting parameters of heat loss.
Changes in body heat are calculated using three variables: heat production, heat flow to the skin and heat loss through respiration (Eqns (1.10), (1.1) and (1.3), respectively in Thompson et al., in press). Heat loss from the body is impacted by the limit in heat flow to the skin (a flow driven by r s), increasing the impact of the other variables on body temperature. Respiration losses compensate for the minimum value reached in r s; therefore, the sensitivity of T bref, a parameter which drives r s, inversely correlates with the sensitivity of the respiration rate parameters. The sensitivity of T bref does not decrease to zero as r s reaches a minimum because it is also an input for heat production (as a basis in the maintenance requirement calculation; Eqn (1.11) in Thompson et al., in press), although the effect of T bref on heat production is small compared with that on heat flow to skin. The sharp increases in the respiration rate parameters cause the sudden changes in sensitivity seen in the other parameters (Fig. 1).
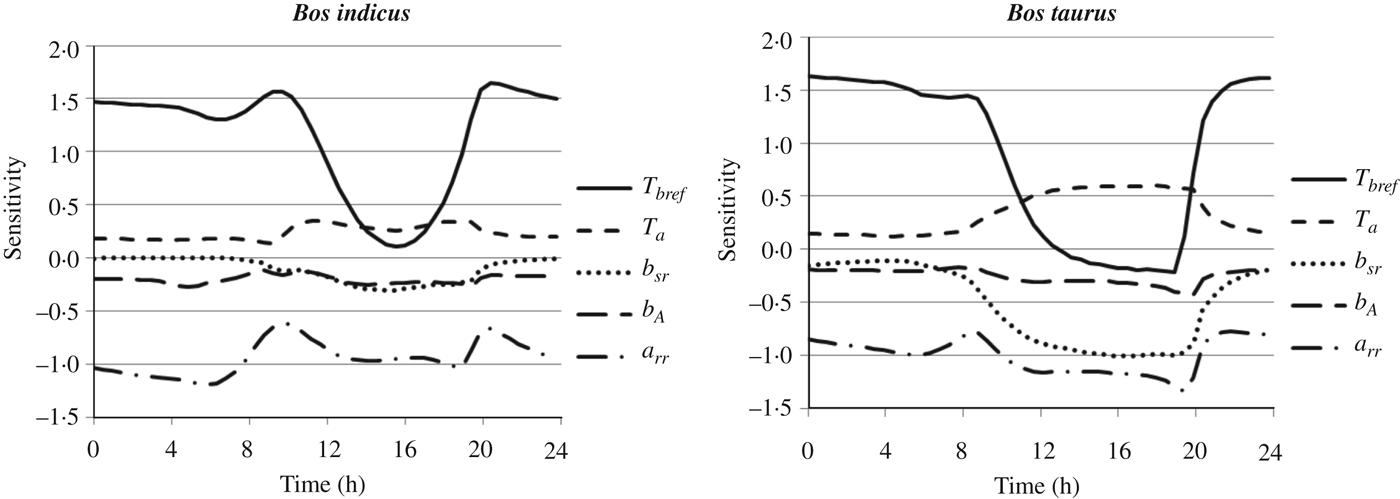
Figure 2 shows the effect of the most sensitive parameters, a rr, Tbref, bsr, bA and T a, on T b for B. taurus and B. indicus under hot conditions calculated with Local II. The parameters a rr and b rr most strongly affected body temperature during the day for both species, but due to the great extent of the overlap, only a rr is shown in Fig. 2. T bref, exhibits the greatest effect on T b at night for both species. The T b of B. taurus was more sensitive to the parameters b A, Ta and b sr than was that of B. indicus although both species had relatively low sensitivities to these parameters compared with T bref and a rr. The T b of both B. taurus and B. indicus were less sensitive to all model parameters under cold conditions. The parameters b A and M b were more important than were respiration rate parameters for B. indicus under cold conditions (results under cold conditions are not shown).
Local II sensitivity analysis for Bos indicus and Boss taurus under hot climate conditions. The figures are the sensitivity of the model parameters on body temperature (T b) where T bref is the reference body temperature (a vasodilation/vasoconstriction parameter), T a is the air temperature, b sr is a sweating rate parameter, b A is an animal surface area parameter and a rr is a respiration rate parameter (intercept).
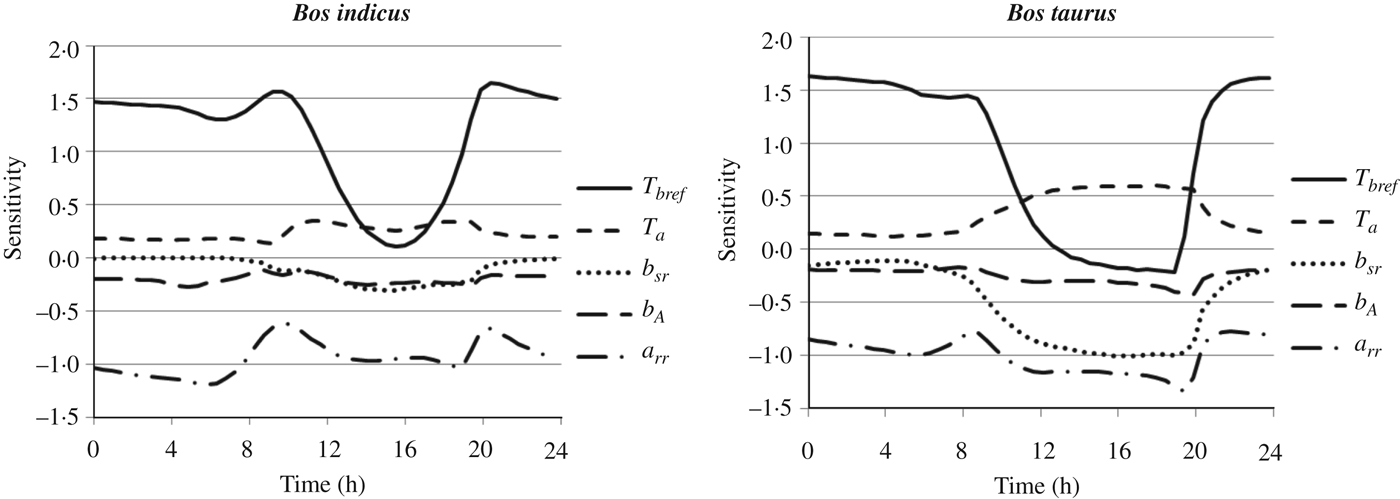
Table 1 shows the top 13 most sensitive parameters analysed with Local I and the rank of those parameters analysed with Local II. The top four ranked parameters for both analyses are identical in order, although their sensitivity values are different, where Local II in general has higher sensitivity values than Local I. Reference body temperature is not among the top ranking parameters because the time point for the table is 14·00 h, at which the model has a low sensitivity to T bref (Figs 1 and 2). The ranks of the next eight parameters are not as closely aligned between Local I and Local II, but these parameters have low sensitivity and little impact on the model outputs. Thus, both analyses yield similar information about the model parameters, which demonstrates that either analysis may be sufficient.
Local II is more commonly used than is Local I for dynamic models. With Local II, the change in a response variable, such as T b, is dependent on the change of not only a parameter, but also the value of the response variable from the previous time step, as illustrated by the reflection coefficient of the coat, ρ c. For example, there is zero sensitivity of the model outputs to ρ c before sunrise when both Local II and Local I are run (this example is for explanatory purposes; results not shown). At sunrise, sensitivity to ρ c enters into the model, and theoretically it should leave at sunset, but such is not the case in Local II, as T b does not quite return to the original value. Local I does not depend on the previous time step and the sensitivity of T b on ρ c does return to zero. This independence from the previous time step can be seen as strength of Local I, as it helps in the understanding of the model equations and behaviour at a fixed point in time. On the other hand, Local II better describes the effect of a change in a parameter on the output over time by accounting for the previous time step, i.e. it smoothes model variance. Moreover, model dynamics depend on the previous time steps because the rate is a function of state, i.e. rate-state-formalism.
The T bref and respiration rate parameters were found to be the most sensitive in the model with the use of either Local II or Local I. Local I was more sensitive to the conditional statements (if/then and max and min functions) in the model. Both analyses appear to be useful, but Local I may be a better means of understanding the equations and their functional relationship with the parameters, whereas Local II may be a better means of understanding the effect of the parameters on model behaviour. Both analyses yield similar results; thus, Local II may be more appropriate with less computation time for dynamic models because it is easier to implement and it will output dynamic sensitivities.
Global
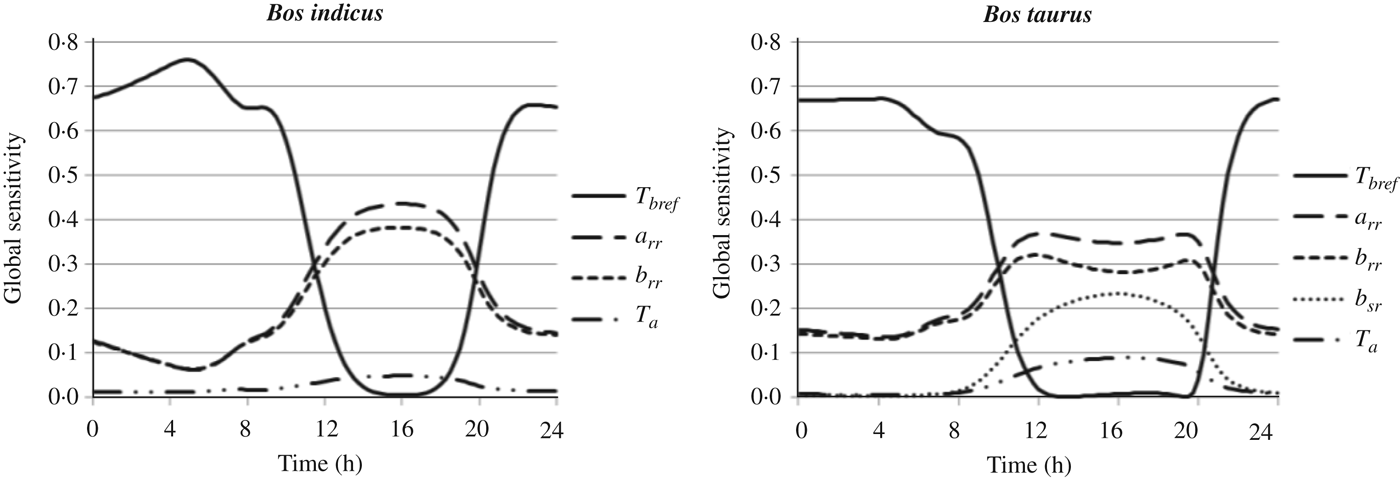
The high Global R 2 value ranging from 90·4 to 95·4 (using the most sensitive parameters, for B. indicus and B. taurus, respectively), demonstrates that the model is linear in its parameters (Saltelli et al. Reference Saltelli, Ratto, Andres, Campolongo, Cariboni, Gatelli, Saisana and Tarantola2008). Figure 3 presents sensitivity ( $\beta _j^2 $) for the selected model parameters plotted against time for both cattle species under hot conditions, where the parameters T bref, arr, brr, bsr, Ta and b A were most sensitive. The R 2 quantifies the proportion of the total model variance that is explained by linear combinations of the parameters. For B. taurus, the most important parameters (sensitivity indices >0·04) explained 0·88–0·99 of the model variation (Fig. 3). The proportion of the variation accounted for by the parameters increased from 0·94 to 1·00 when all of the parameters were included. Therefore, most of the model variation can be accounted for by just a few parameters (T bref, arr, brr, bsr and T a). The parameters T bref, arr, brr and b sr were the only ones contributing 10% or more to the model variation under hot conditions. Given this outcome, the future experiments can focus on measurements of only the most important parameters as long as the other parameters have been adequately described. The Thompson model is a relatively complex mechanistic model, but its use in a specific situation requires fitting of only the three to five parameters to which the model outputs are most sensitive. The estimates for the other parameters are sufficient and do not have to be estimated specifically because their sensitivity is relatively low.
Sensitivity indices for body temperature (T b) from Global for Bos indicus and Bos taurus under hot conditions plotted over 24 h. The parameters included are those whose sensitivity indices are greater than 0·04 at any given time point throughout the day. Here T bref is a vasodilation parameter, a rr and b rr are the respiration rate parameters, b sr is a sweating rate parameter and T a is air temperature. Some of these lines overlap. These sensitivities represent the proportion of total variation in the model accounted for by each parameter.
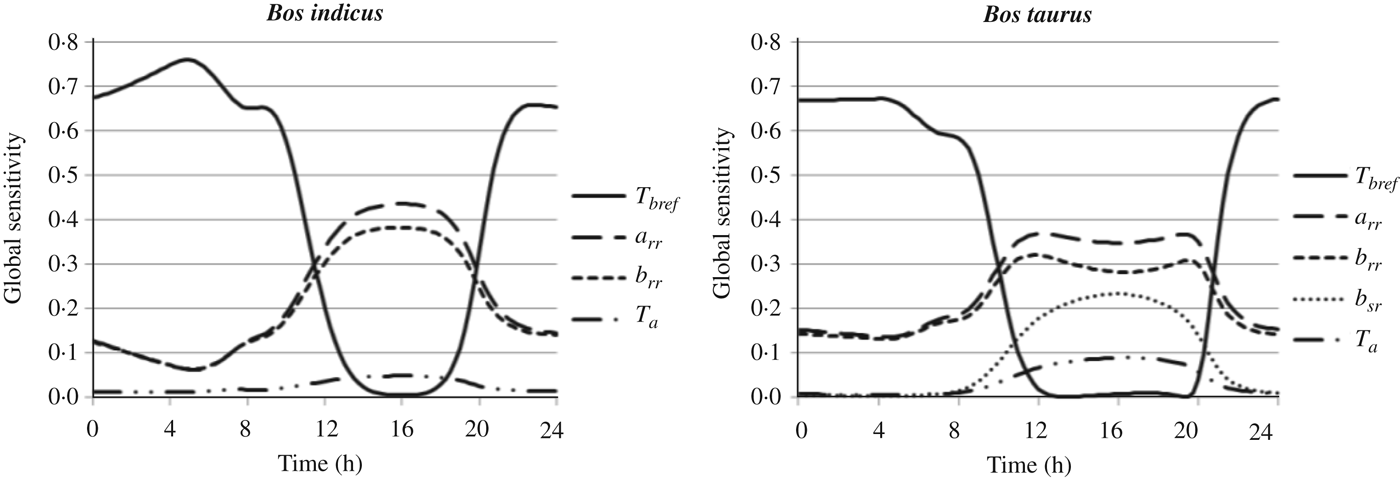
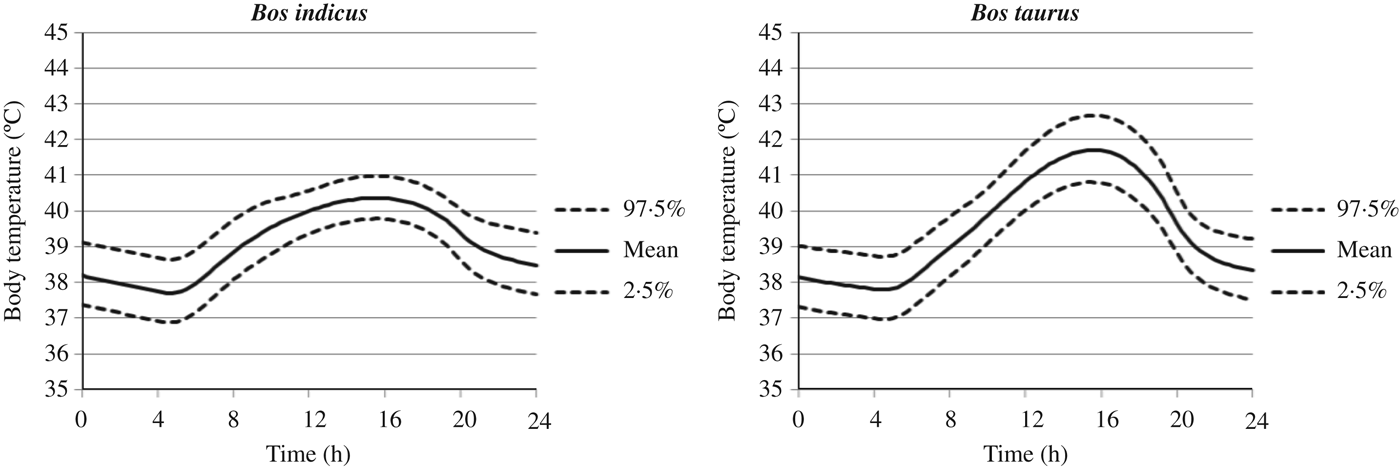
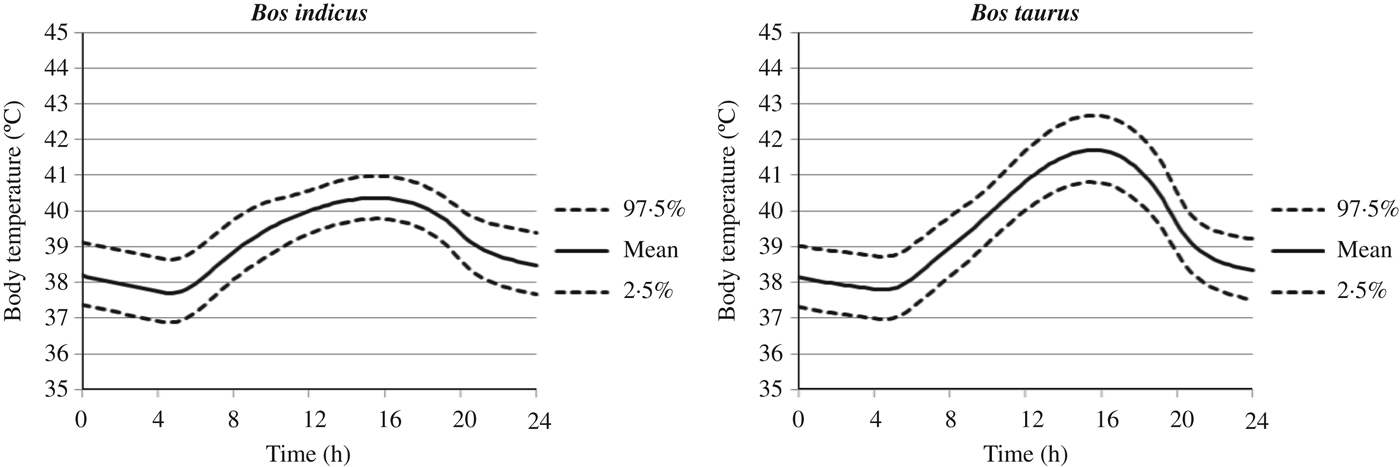
Figure 4 shows T b over time for both B. indicus and B. taurus under hot conditions. The confidence intervals are constant over time, except those for B. indicus. The symmetry of the confidence intervals demonstrates that the model variation is independent of time, meaning sensitivity to variation in model parameters over time remains of similar magnitude. Figure 3 helps to explain the narrowing of the confidence intervals during the day for B. indicus under hot conditions. For B. indicus, only the two respiration rate parameters greatly increase in sensitivity during the day, while that of T bref is small. For B. taurus, the sensitivity of four parameters increases during the day followed by a concomitant decrease in the sensitivity of T bref; thus, the confidence interval for them does not decrease.
Predicted mean body temperature (solid line) and upper (97·5%) and lower (2·5%) confidence intervals (dashed lines) for Bos indicus and Bos taurus under hot conditions. The uncertainty around the predicted mean body temperature is due to ±3% uncertainty implemented in the structural parameters of the heat balance model as described in the methods.
The variation in the model that is not accounted for by a linear relationship with parameters (0·001–0·062) is accounted for by non-linear relationships, which are the interactions between the parameters (Saltelli et al. Reference Saltelli, Ratto, Andres, Campolongo, Cariboni, Gatelli, Saisana and Tarantola2008). A great deal of computing time (>375 h, using 20+ parameters in Matlab) is required for calculating these interactions. As the relative contribution of the interaction to model variance was small, these calculations were not performed. The information about model variance and the contribution of the different parameters given by Global cannot be obtained through a local sensitivity analysis, thus making Global a vital addition to model evaluation (Figs 3 and 4). In addition, Global can be used as a guide to data collection in experiments and as a means for further development of mathematical models.
Prediction evaluation
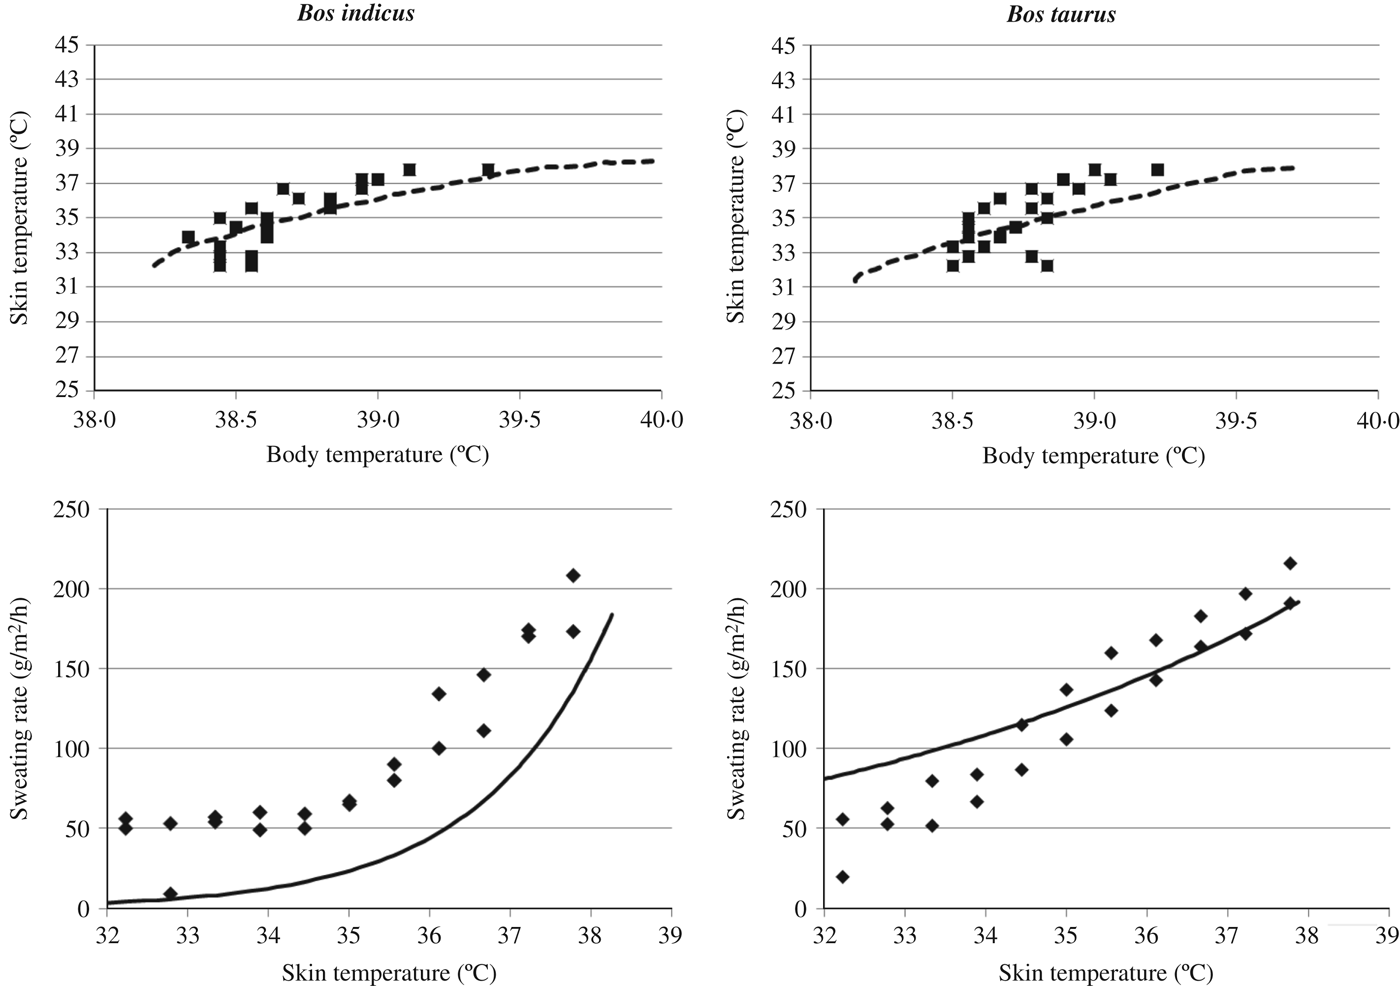
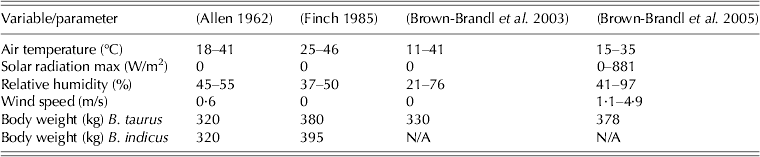
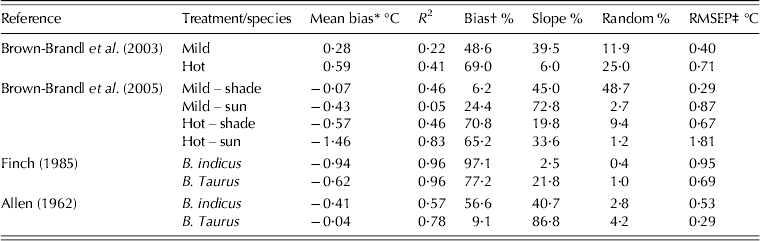
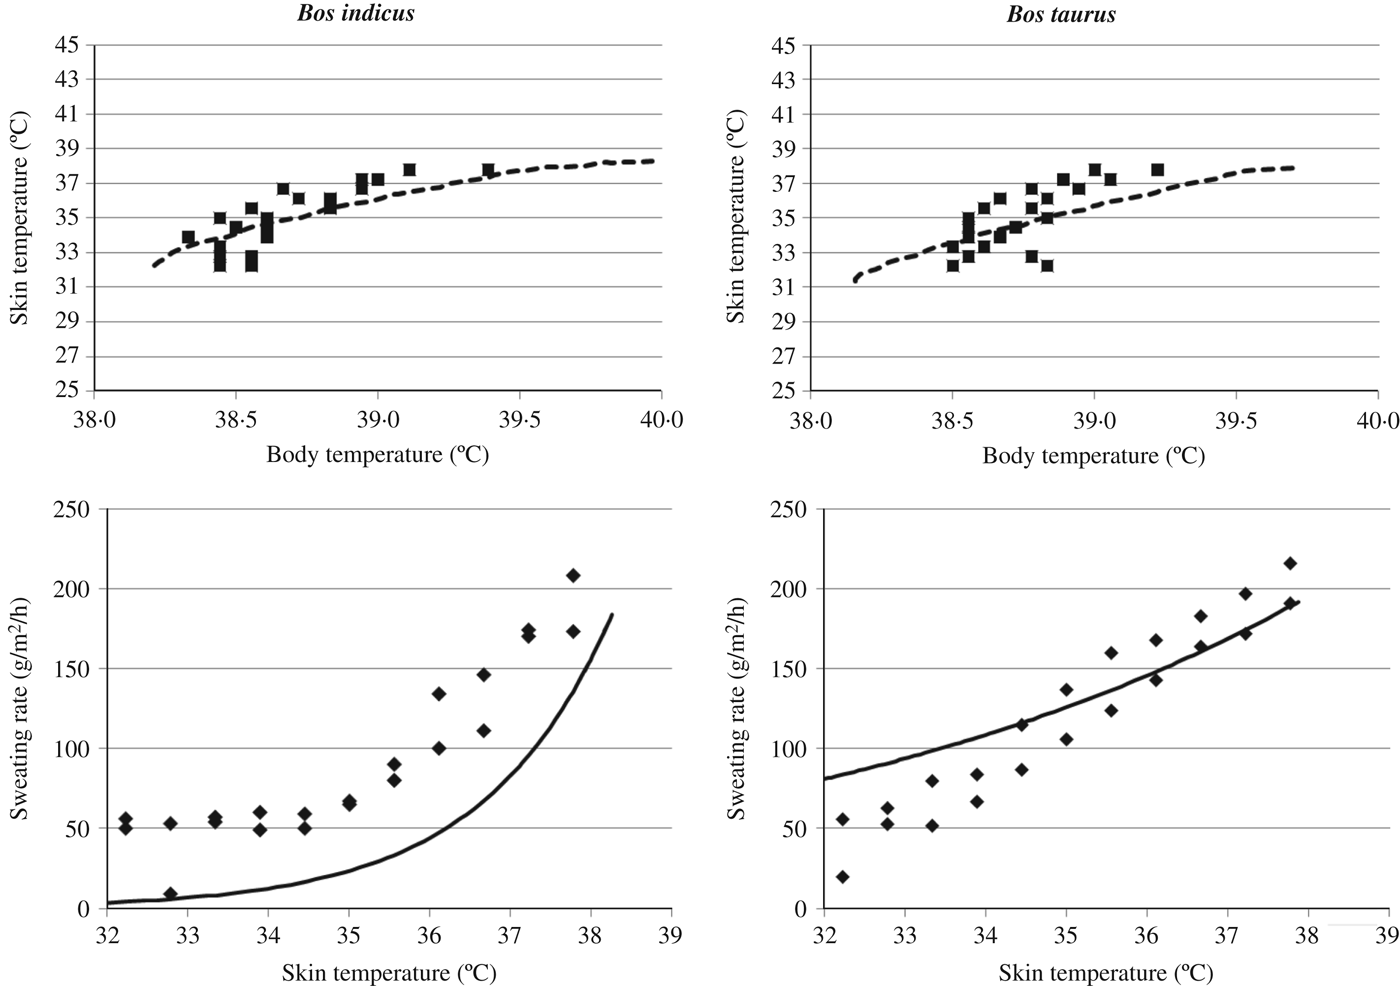
The species and climate inputs used to evaluate the model against the datasets are shown in Table 2. Figure 5 shows the reported values for skin v. body temperatures and sweating rates v. skin temperature from the Allen (Reference Allen1962) dataset and the predicted values from the model for B. indicus and B. taurus cattle, respectively, the statistical calculations for which can be seen in Tables 3 and 4. The statistical calculations are the results of the predicted and experimental data for both skin v. body temperature and for skin v. air temperature. The skin v. body temperature plots show that the model accurately predicts this relationship for both species, although the model does not contain stochastic variables and, therefore, does not account for random variation. Sweating rates for B. indicus are predicted with a low Bias and Slope; however, the rates have a low Bias for B. taurus, but a large Slope.
Model predictions of the relationship between skin and body temperature (°C) and between sweating rate (g/m2/h) and skin temperature compared with the Allen (Reference Allen1962) dataset for Bos indicus and Bos taurus. All lines are simulated data (solid lines are sweating rate and dashed lines are skin temperature), whereas the points are experimental data (squares are skin temperature and diamonds are sweating rate).
Model inputs used from evaluation datasets
Results of statistical analysis of model predicted skin and body temperature compared with experimental data of skin and body temperature (°C)

* Mean bias is observed minus predicted.
† Bias, slope and random are percentage of mean-square error of prediction.
‡ Root-mean-square error of prediction.
Results of statistical analysis of model predicted body temperature (°C) compared with experimental data, given air temperature (°C)
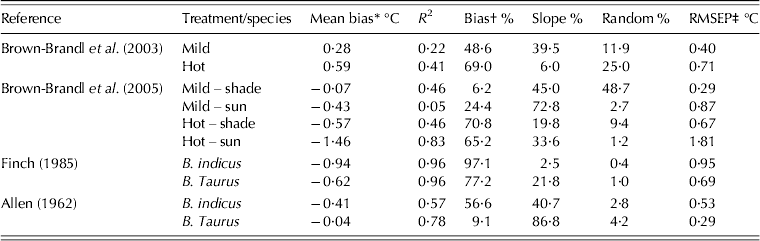
* Mean bias is observed minus predicted.
† Bias, slope and random are percentage of mean-square error of prediction.
‡ Root-mean-square error of prediction.
The comparison of the model predicted body temperature with reported body temperature, for the given air temperature (Table 4), shows that Bias and Slope combined for both species are responsible for the majority of the error, perhaps because of the timing of the rise in room temperature. The Allen (Reference Allen1962) article does not provide the time it took for the room temperature to increase or the time it took for measurements to be taken. Therefore, estimates of the timing of those events were made, which impact both the slope and the shape of the simulated body temperature curve (Table 4).
The R 2 for the sweating and respiration rate predictions (0·80–0·98 and 0·79–0·93, respectively) of the Allen (Reference Allen1962) dataset for both species are higher than those for the T b and T s predictions (0·51–0·84) (results not shown). Random is responsible for the majority of the error (0·36–0·76) for the T sv. Tb predictions for all the treatments except for one Jersey treatment. A large Random indicates that the model's predictions do not exhibit a large Bias or Slope, and thus the fit cannot be further improved with the given model (Table 3).
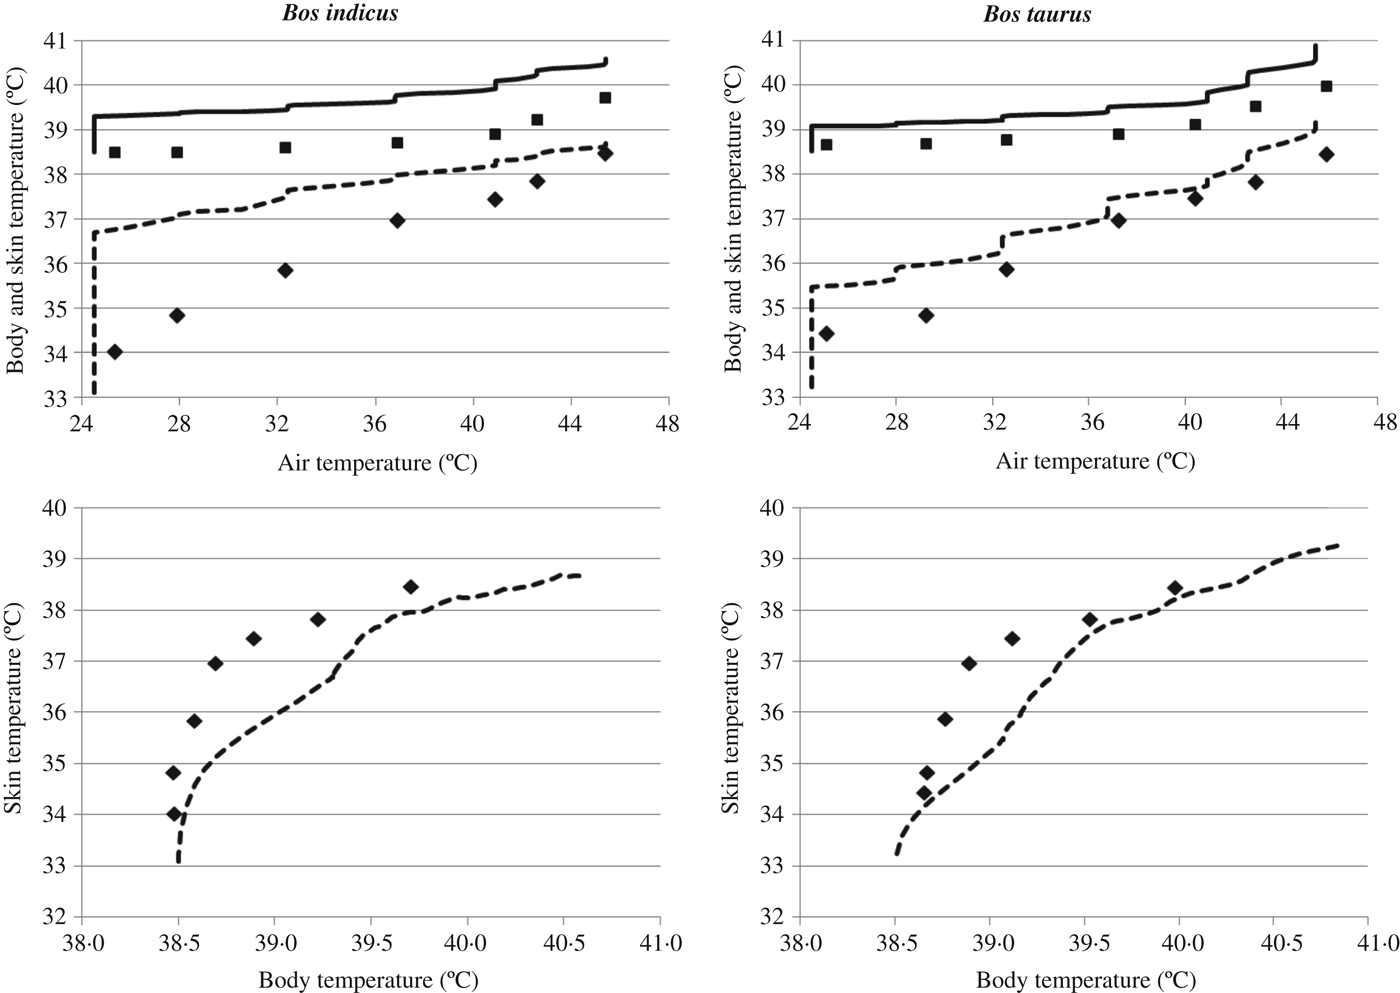
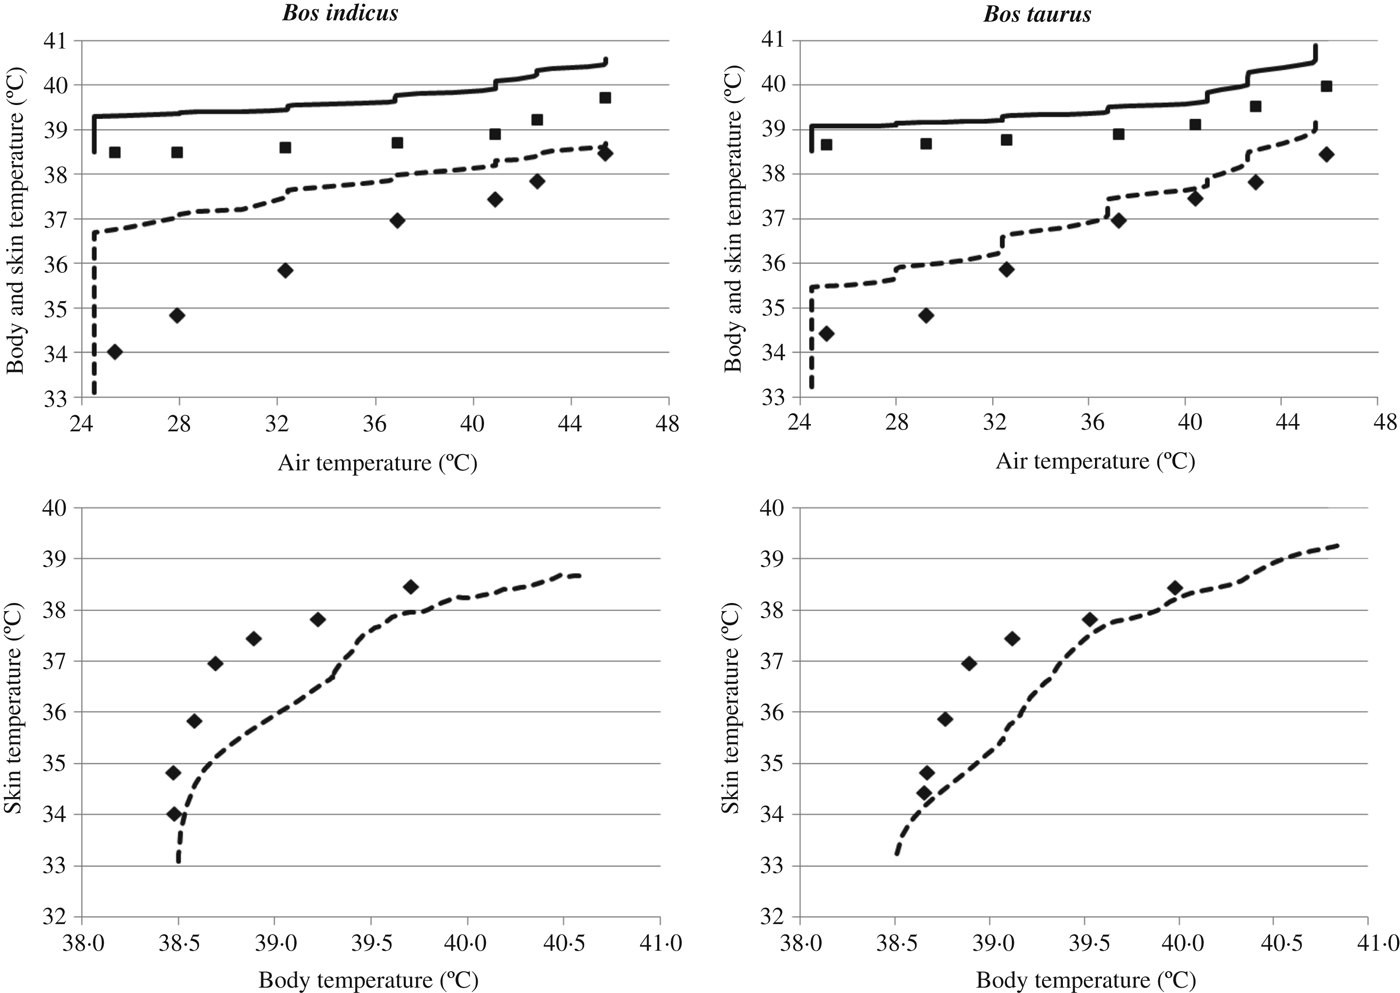
The Thompson model (Thompson et al., in press) predictions for body and skin temperatures v. air temperatures and skin v. body temperatures for the Finch (Reference Finch1985) dataset are shown in Fig. 6, the statistical calculations for which are in Tables 3 and 4. The model predictions for B. taurus (Shorthorn) body and skin temperatures more closely aligned with the Finch dataset than did the predictions for B. indicus (Brahman) body and skin temperatures, although temperatures were overpredicted for both species. The model under-predicted skin temperature compared with body temperature as body temperature neared 39 °C, but otherwise predicted the skin v. body temperature relationship accurately for both species (lower two graphs in Fig. 6). The R 2 for body v. air temperature and skin v. body temperature for both species ranged from 0·79 to 0·96, with Bias contributing the majority of error (0·61–0·96) (Tables 3 and 4). More information from the experiments, such as sweating and respiration rates would allow for a better understanding of the Bias component. The overprediction in the B. indicus data can be attributed to the overestimation of heat production. Heat production is difficult to estimate accurately due to the lack of feed intake information, such as the ME of the feed and intake levels immediately prior to the experiment.
Model predictions of the relationships among body temperature, skin temperature and air temperature (°C) compared with the Finch (Reference Finch1985) dataset for Bos indicus and Bos taurus. All lines are simulated data (solid lines are body temperature and dashed lines are skin temperature), whereas the points are experimental data (squares are body temperature and diamonds are skin temperature).
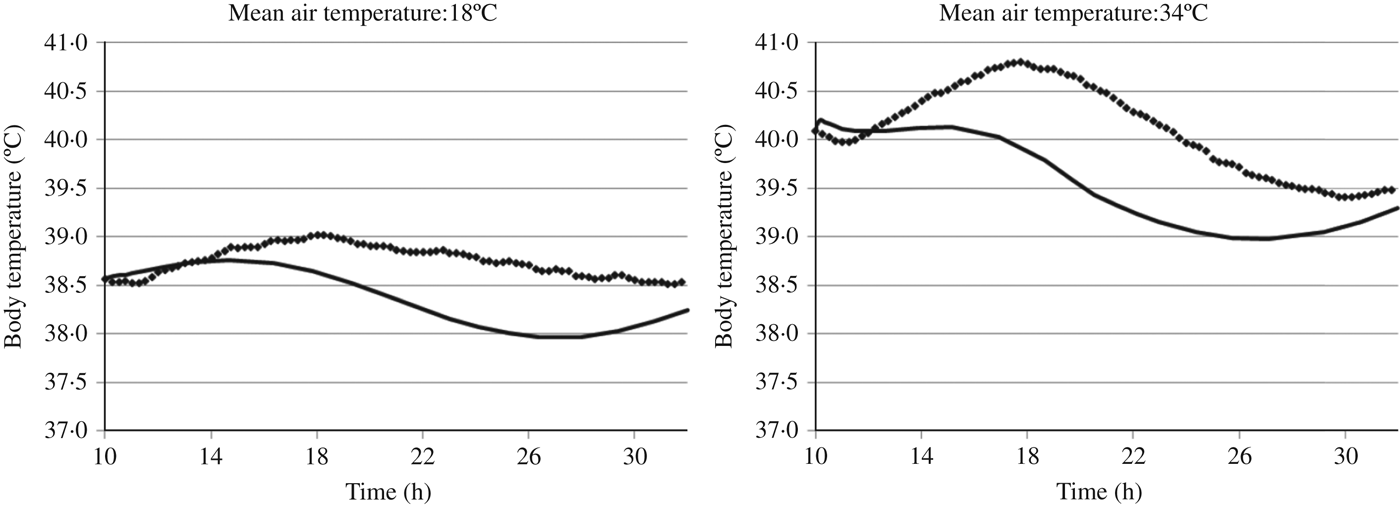
The Brown-Brandl et al. (Reference Brown-Brandl, Nienaber, Eigenberg, Hahn and Freetly2003) dataset and predictions are shown in Fig. 7, and the statistical calculations are presented in Table 4. The model underpredicted T b at an increasing rate as air temperature increased from a treatment average of 18–34 °C. The maximum underprediction of body temperature occurred in the time range of 20·00–22·00 h (underprediction of 1·1 °C in the 34 °C treatment). The Brown-Brandl et al. (Reference Brown-Brandl, Nienaber, Eigenberg, Hahn and Freetly2003) dataset showed that the maximum body temperature occurred 4 h after the maximum air temperature was reached, whereas the model found that the maximum body temperature occurred 1·25–2 h after the maximum air temperature was reached.
Model predictions of body temperature (°C) compared with the Brown-Brandl et al. (Reference Brown-Brandl, Nienaber, Eigenberg, Hahn and Freetly2003) dataset for Bos taurus cattle. All lines are simulated data, whereas the points are experimental data. The mean air temperatures are 18 and 34 °C, whereas the daily fluctuations are ±7 °C from the mean.
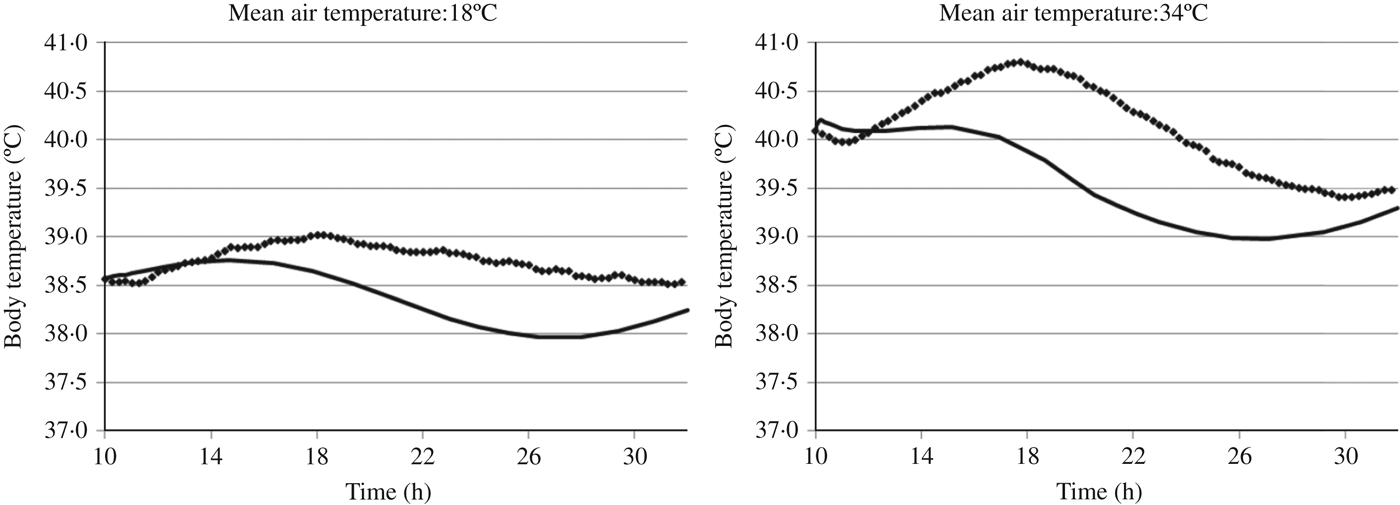
The underestimation of body temperature in the Brown-Brandl et al. (Reference Brown-Brandl, Nienaber, Eigenberg, Hahn and Freetly2003) dataset can be attributed to evaporative losses (Fig. 7). The model overpredicted evaporative losses by 189 kJ/kg0·75 in the 34 °C treatment and by 210 kJ/kg0·75 in the 30 °C treatment. The predicted evaporative loss estimates were 48 and 65% above the observed values for the 34 and 30 °C treatments, respectively. Evaporative losses accounted for 0·78–0·95 of total heat losses for the 34 and 30 °C treatment groups; thus, a large error in this estimate led to a large error in body temperature. Kibler & Yeck (Reference Kibler and Yeck1959) found evaporative heat losses to reach 458 kJ/kg0·75 under similarly heat stressed conditions for shorthorn beef cattle, which was above that measured by Brown-Brandl et al. (Reference Brown-Brandl, Nienaber, Eigenberg, Hahn and Freetly2003) (390 kJ/kg0·75) but below the predicted evaporative heat loss of 579 kJ/kg0·75. The large overestimation of evaporative heat loss alone would cause a greater disparity between measured and simulated body temperatures. However, the large predicted evaporative losses compensated for the higher predicted heat production compared to the observed heat production (725 v. 540 kJ/kg0·75, respectively). The lower value for measured heat production can be attributed to decreased feed intake. When the model predicted the data based on the lower intake, heat production was greatly underestimated. In the experiments, the decrease in heat production was gradual as the animals shifted from eating ad libitum to a reduced feed intake; thus, the measured heat production was a function of both the decreased and the ad libitum intake, with the actual heat production falling between the decreased and the ad libitum intake at steady state. The experiments did not include a delay in measuring heat production after the animals were subjected to heat stress and began to decrease intake. Therefore, heat production was calculated based on ad libitum feed intake.
The model does not account for heat increment of feeding and, instead, assumes constant heat production throughout the day. Sprinkle et al. (Reference Sprinkle, Holloway, Warrington, Ellis, Stuth, Forbes and Greene2000) has shown that the heat increment of feeding is dependent on the species as well as the feed energy due to differing rates of passage of feed. The assumption of constant heat production contributes to the differences in the predictions of the Brown-Brandl et al. (Reference Brown-Brandl, Nienaber, Eigenberg, Hahn and Freetly2003) dataset, in which the model consistently underpredicted body temperature. The cattle decreased their feed intake as body temperature rose, whereas the predictions were made under the assumption of a constant feed intake. Decrease in heat production lags after decrease in feed intake, but models that demonstrate this lag are scarce; thus, a constant value for intake is used (McGovern & Bruce Reference McGovern and Bruce2000; Turnpenny et al. Reference Turnpenny, McArthur, Clark and Wathes2000). In addition, the cattle ate less as body temperature rose, yet only an average daily intake is given in the Brown-Brandl et al. (Reference Brown-Brandl, Nienaber, Eigenberg, Hahn and Freetly2003) dataset; thus, even if heat increment were implemented in the model, the decline in intake would still have to be estimated, which would have contributed to the error component.
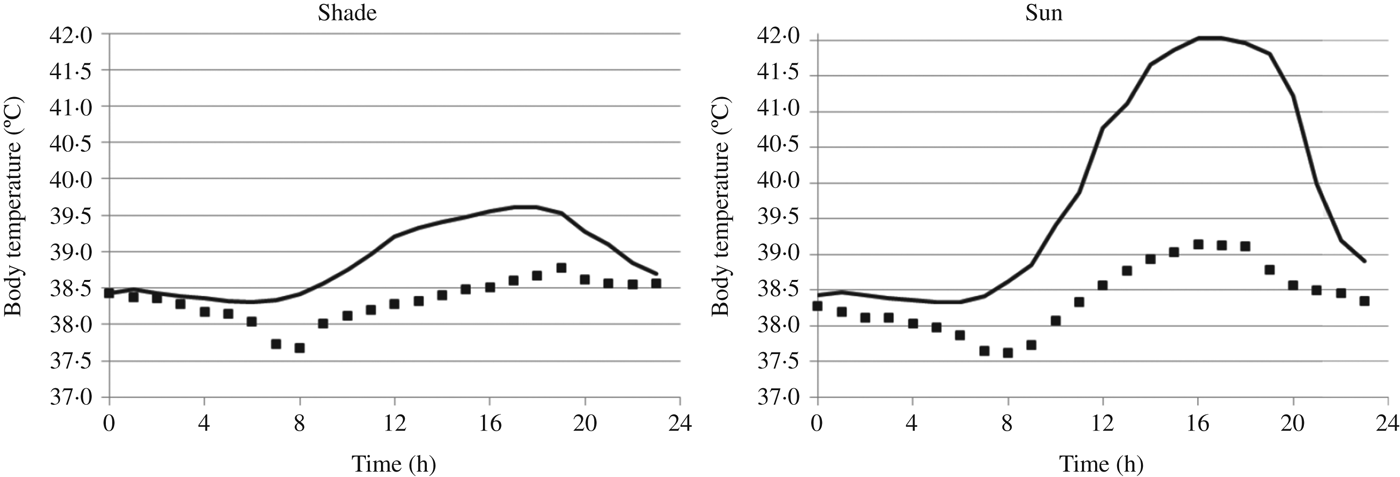
The Thompson model (Thompson et al., in press) demonstrated a prediction trend with the Brown-Brandl et al. (Reference Brown-Brandl, Eigenberg, Nienaber and Hahn2005) dataset similar to that with the Allen (Reference Allen1962) dataset, in which the accuracy of the model decreased as heat stress increased. The model overpredicted T b as T a increased, with a greater overprediction for cattle under solar radiation (Fig. 8). The statistics for the Brown-Brandl et al. (Reference Brown-Brandl, Eigenberg, Nienaber and Hahn2005) predictions are shown in Table 4. The maximum overprediction for the solar radiation treatments occurred during daylight hours, whereas the model more accurately predicted body temperature during the night. Determining the reason for overprediction under solar radiation requires more information to compare the calculation of exchange of thermal radiation with the actual exchange experienced by the animals. Few experiments have measured or calculated solar radiation absorption, leading to the use of theoretical relationships in the model in the place of empirical relationships, which may not correctly represent the system.
Model predictions of body temperature (°C) compared with the Brown-Brandl et al. (Reference Brown-Brandl, Eigenberg, Nienaber and Hahn2005) dataset for Bos taurus cattle in the shade and sun. All lines are simulated data, whereas the points are experimental data.
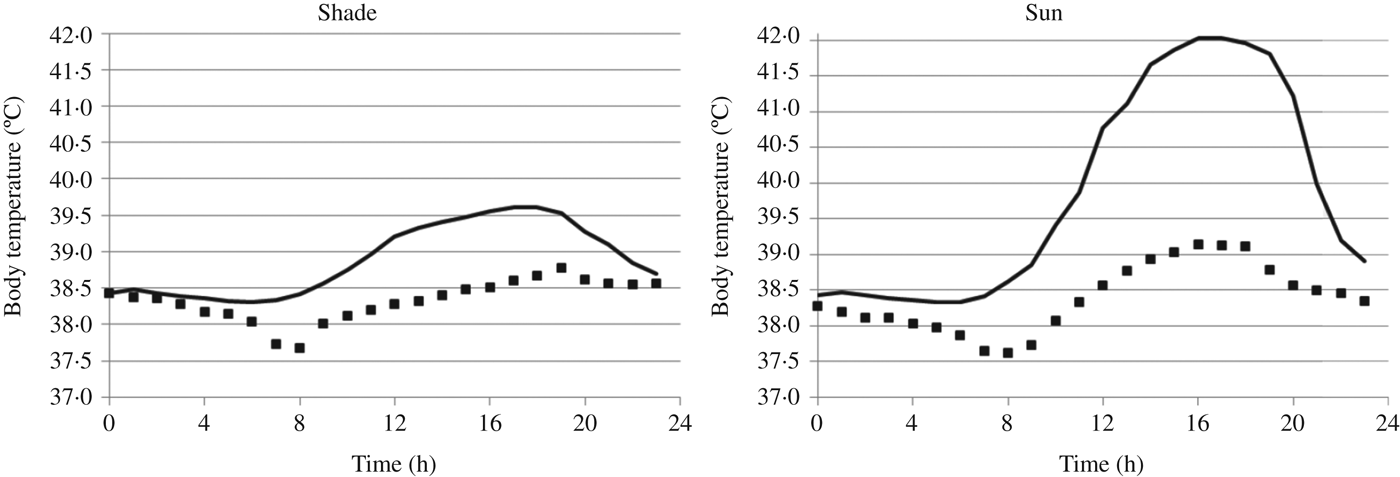
Some of the differences between the experimental results and model predictions across all datasets can be attributed to the delay in T b increase compared with the rise in T a. Predicted T b declined more at low T a than was demonstrated by the Allen (Reference Allen1962) dataset and, likewise, increased more rapidly than the dataset at high T a, meaning that the predicted T b was more sensitive to T a than was the T b for cattle in the experiment (results not shown). The predicted peak body temperature occurred at the same time as the observed data (Brown-Brandl et al. Reference Brown-Brandl, Eigenberg, Nienaber and Hahn2005) in Fig. 8, whereas in Fig. 7 the predicted peak body temperature occurred 2–3 h prior to the observed data (Brown-Brandl et al. Reference Brown-Brandl, Nienaber, Eigenberg, Hahn and Freetly2003). The delay in the body temperature rise in the observed data is a delayed response to rising T a. Finch (Reference Finch1986) found a similar delay in both sweating and respiration rate as T a increased, leading to a delayed rise in T b. The sun treatments of the Brown-Brandl et al. (Reference Brown-Brandl, Eigenberg, Nienaber and Hahn2005) dataset exhibited the same pattern as did the predictions, which can be attributed to the solar radiation overpowering the effect of T a. Both the rise in solar radiation and T b have equivalent delays in relation to the rise in T a. The data show that the maximum solar radiation and the maximum T b occur at the same time whereas the maximum T a occurs later in the day.
CONCLUSION
The sensitivity analyses showed that Thompson model is primarily linear in its parameters (although highly nonlinear in time), which results in a few interactions between parameters. In addition, only the respiration rate parameters, reference body temperature, sweating rate parameters, air temperature and the surface area of animals were important in the model, given the circumstances tested. The remaining parameters can be reasonably estimated, but do not require the attention or precision that must be given to the important parameters. Both B. indicus and B. taurus had similar patterns in the sensitivity analyses, although B. indicus were less sensitive due to their greater tolerance for heat stress.
Some problems exist in the prediction of body temperature and improvement requires a more complete dataset, which will provide a better understanding of the contribution of the thermal flows both within the animal and between the animal and its environment. A helpful experiment to estimate the sensitive parameters and test the main heat flows in the model would be one in which skin and body temperatures are measured, in addition to sweating and respiration rates, respiratory evaporation losses and long wave radiation fluxes. An updated experiment on heat flow from the body to the skin (vasodilation) would allow for estimation of reference body temperature. This experiment should include both B. indicus and B. taurus under a wide range of temperature conditions, from heat to cold stress. Finally, an experiment should measure the effect of solar radiation, measuring the radiation intercepted and absorbed by the animal and measuring its effect on both skin and body temperature. The experiments would also need animal inputs, such as species, M b, intake and ME content of the feed.
The heat balance model is an adaptable, mechanistic model which can evaluate and help explain the specific physiological effects of heat stress on the animal. This model can be a useful tool for designing experiments, improving animal welfare, mitigating the detrimental effects of heat stress and improving animal performance.
Research was supported by the Lyons Fellowship, the Jastro Shields Award (V.A.T.) and the W. K. Kellogg Endowment, USDA NIFA Multistate Research Project NC-1040. We gratefully acknowledge the infrastructure support of the Department of Animal Science, College of Agricultural and Environmental Sciences, the California Agricultural Experiment Station of the University of California, Davis and Embrapa Cerrados, Planaltina, Brazil.