


Introduction
The over importance of thought is one of the key cognitions in Obsessive-Compulsive Disorder (OCD) (OCCWG, 1997, 2001, 2003, 2005) and is the belief that the mere presence of a thought indicates it is important (OCCWG, 1997). It encompasses thought-action fusion (TAF), superstitious and magical thinking (Freeston, Rhėaume and Ladouceur, Reference Freeston, Rhéaume and Ladouceur1996). Shafran, Thordarson and Rachman (Reference Shafran, Thordarson and Rachman1996) propose two forms of TAF. These are TAF likelihood, which refers to belief that having an intrusive thought increases the probability of the event occurring, and TAF moral, which is belief that having the intrusive thought is the moral equivalent of carrying out the thought. Magical thinking may underlie the more specific distortion of TAF and superstitious thinking seen in OCD (Einstein and Menzies, Reference Einstein and Menzies2004a, Reference Einstein and Menziesb, Reference Evans, Milanak, Medeiros and Ross2006). It has been suggested that TAF is a specific form of magical thinking (Amir, Freshman, Ramsey, Neary and Brigidi, Reference Amir, Freshman, Ramsey, Neary and Brigidi2001). We argue there are problems with existing measures of magical thinking and the aim of the study was to develop a valid measure of it.
Eckblad and Chapman's (Reference Eckblad and Chapman1983) 30-item Magical Ideation Scale (MIS) is the most widely used measure of magical thinking, which they define as “belief in forms of causation that are inconsistent with conventional standards” (p. 215). Magical thinking encompasses a wide range of paranormal phenomena, superstitions and even religious beliefs (Tobacyk and Milford, Reference Tobacyk and Milford1983; Zusne and Jones, Reference Zusne and Jones1989). Items on the MIS cover superstitions, TAF and a range of magical phenomena, such as beliefs in reincarnation and telepathy. Whilst some items, e.g. “Some people can make me aware of them just by thinking about me”, measure general magical thinking, a problem with the MIS is that it also contains a number of items describing psychotic symptoms, e.g. “I have felt that there were messages for me in the way things were arranged, like in a store window”. An assumption underlying the MIS is that magical ideation is prominent in schizophrenia-prone persons (Chapman, Chapman and Miller, Reference Chapman, Chapman and Miller1982; Eckblad and Chapman, Reference Eckblad and Chapman1983) and some items assess ideas of reference. We argue that the inclusion of items that assess psychotic symptoms in the MIS is a problem because these symptoms are not relevant to understanding the link between magical thinking and OCD, and that a pure measure of magical thinking is required.
The PBS (Tobacyk and Milford, Reference Tobacyk and Milford1983) is a 25-item measure of paranormal beliefs that was revised (Revised Paranormal Belief Scale; RPBS; Tobacyk, Reference Tobacyk2004). The scale assesses beliefs in clairvoyance, precognition, telepathy, psychokinesis, witchcraft, superstitions, extra-terrestrial life forms and Christian religious beliefs. A number of studies have criticized the stability and construct validity of the scale (e.g. Lawrence, Reference Lawrence1995a, Reference Lawrenceb; Lawrence and De Cicco, Reference Lawrence and De Cicco1997; Lawrence, Roe and Williams, Reference Lawrence, Roe and Williams1997; see Tobacyk, Reference Tobacyk1995a, Reference Tobacykb for a reply).
A number of measures of superstitions have been developed including the Superstitiousness Questionnaire (Zebb and Moore, Reference Zebb and Moore2003) and the Lucky Beliefs and Behaviours Scales (LBBS; Frost et al., Reference Frost, Krause, McMahon, Peppe, Evans and McPhee1993). The LBBS correlated strongly with checking but not cleaning or washing subscales of the Maudsley Obssessive-Compulsive Inventory (MOCI; Hodgson and Rachman, Reference Hodgson and Rachman1977). Frost and colleagues (Reference Frost, Krause, McMahon, Peppe, Evans and McPhee1993) concluded that checking is more relevant to superstitious beliefs and behaviours. Zebb and Moore (Reference Zebb and Moore2003) also found a significant relationship between the LBBS and the checking and mental control subscales of the Padua Inventory (PI; Sanavio, Reference Sanavio1988).
Shafran et al. (Reference Shafran, Thordarson and Rachman1996) developed the TAF Scale to investigate whether individuals with OCD have higher levels of TAF compared to the normal population. In a clinical OCD sample the TAF Scale yielded two subscales: TAF Likelihood and TAF Moral. However, in a normal sample, TAF Likelihood split into two further subscales: TAF Likelihood-for-Others and TAF Likelihood-for-Self. Items on the TAF Likelihood-for-Self subscale refer to events occurring to oneself, e.g. “If I think of myself being in a car accident, this increases the risk that I will have a car accident”. TAF Likelihood-for-Others items refer to events occurring to others, e.g. “If I think of a relative/friend being in a car accident, this increases the risk that he/she will have a car accident”. The same factor structures have been replicated (e.g. Rassin, Merckelbach, Muris and Schmidt, Reference Rassin, Merckelbach, Muris and Schmidt2001). Shafran et al. (Reference Shafran, Thordarson and Rachman1996) interpreted the difference in factor structures as meaning that individuals with OCD are less able to distinguish between the real world influence of their thoughts over their own behaviour and the behaviour of others. Individuals with OCD had higher TAF scores than students and controls. In particular, individuals with OCD had significantly higher TAF Likelihood-for-Others scores than student and normal samples but not TAF Moral. Rassin et al. (Reference Rassin, Merckelbach, Muris and Schmidt2001) view the predictive value of TAF Likelihood-for-Others beliefs as a form of magical thinking.
Until recently, studies into magical thinking in OCD tended to focus on the specific constructs of superstition and TAF. However, Einstein and Menzies (Reference Einstein and Menzies2004a, Reference Einstein and Menziesb, Reference Evans, Milanak, Medeiros and Ross2006) explored the broader construct of magical thinking captured by the MIS. These studies note the essence of magical thinking is beliefs that defy scientific or culturally accepted laws of causality (Einstein and Menzies, Reference Einstein and Menzies2006). Einstein and Menzies (Reference Einstein and Menzies2004a) examined the relationship between the MIS, TAF Scale and the LBBS in a sample of undergraduate students. The MIS correlated significantly with the TAF Scale, except for TAF Moral, and the LBBS. The MIS had the strongest significant relationship with the MOCI and PI after partialling out the other measures. In particular, the MIS correlated significantly with the impaired control over mental activities subscale of the PI and the checking subscale of the MOCI. In contrast, the correlations with the washing subscale of the PI and the contamination subscale of the MOCI were not significant. Einstein and Menzies (Reference Einstein and Menzies2004a) interpreted this to mean that magical thinking on the MIS is strongly related to OCD, more so than TAF or superstitious thinking. As such, they concluded that TAF and superstition are “derivatives” of magical thinking. The authors suggest that individuals with tendencies towards magical thinking are likely to display a degree of obsessive-compulsive behaviour and that these are more likely to be checking than cleaning behaviours.
Einstein and Menzies (Reference Einstein and Menzies2004b) extended this work by examining the relationship between magical thinking and OCD in a clinical sample. Consistent with their previous study, the MIS, TAF Scale and LBBS were highly correlated. Once again, the MIS had the strongest relationship with the OCI-R and PI. Significant correlations were found between the MIS and the hoarding, neutralizing and obsessing subscales of the OCI-R. However, unlike their previous study, significant correlations were not found for the checking subscale of the OCI-R, although checking behaviours did reach significance on the PI. The MIS also had strong significant correlations with the impaired control over mental activities and urges and worries over losing control over motor behaviours subscales of the PI. Neither the washing nor ordering subscales of the OCI-R or the contamination subscale of the PI correlated significantly with the MIS.
In a further study, Einstein and Menzies (Reference Einstein and Menzies2006) used a matched group design to investigate differences in magical thinking between OCD, panic disorder and non-OCD controls. The OCD group had significantly higher MIS scores than controls. Einstein and Menzies (Reference Einstein and Menzies2006) argue this is evidence magical ideation distinguishes individuals with OCD from controls. The OCD group had significantly higher magical ideation scores than the panic disorder group, leading the authors to conclude that magical thinking is not a key feature of other anxiety disorders. Unexpectedly, OCD individuals classified as “cleaners” on the OCI-R had higher magical ideation scores than those classified as “checkers”. This finding is contrary to their previous studies that found that washing was not significantly associated with magical thinking.
Limitations of existing measures of magical thinking
There are problems with existing measures of magical thinking. Einstein and Menzies (Reference Einstein and Menzies2004a, Reference Einstein and Menziesb, Reference Evans, Milanak, Medeiros and Ross2006) argue the TAF Scale is too specific a measure of magical thinking as it measures only a discrete type involving the omnipotence of thoughts. Bocci and Gordon (Reference Bocci and Gordon2007) state that magical thinking should not be limited to TAF but should include harm avoidance behaviours, such as the neutralizing rituals found in OCD that have a magical quality and, like superstitions, act to offer protection against a feared event. The LBBS deals only with superstitions, which are not reflective of the broader construct of magical thinking. The PBS/RPBS has been criticized over its construct validity and factor stability. Further, the item content focuses solely on specific types of paranormal phenomena. The MIS was not designed to measure magical thinking in the general population; it was designed to identify individuals at risk for psychosis (Eckblad and Chapman, Reference Eckblad and Chapman1983). A number of MIS items measure delusions and ideas of reference and it correlates significantly with measures of schizophrenia (Kelly and Coursey, Reference Kelly and Coursey1992).
Given the MIS has construct validity as a measure of schizotypy, its suitability for use as a general measure of magical thinking is questionable. There is no evidence that magical thinking in schizotypy is the same as magical thinking in the general population or in OCD. While there is some superficial similarity between obsessions and delusions (de Silva and Rachman, Reference de Silva and Rachman1992; Garety and Hemsley, Reference Garety and Hemsley1994), a hallmark of OCD is that its symptoms are ego-dystonic with insight into the irrationality of the obsessions. In contrast, psychotic delusions are not accompanied by insight. Consequently, a new measure to capture the construct of magical thinking without items referring to psychosis is required.
The present study aimed to develop a new measure of magical thinking that is appropriate for use in the general population. According to the continuum view of OCD, one needs to understand magical thinking from what is characteristic of the general population, and the seminal research of Rachman and de Silva (Reference Rachman and de Silva1978) clearly shows the importance of understanding obsessive compulsive symptomatology in a non-clinical population. Therefore, a non-clinical sample was utilized in this study. The primary aim was to develop a measure of the broad construct of magical thinking but one that also encompasses the specific beliefs of superstition and TAF, which are also clearly relevant to OCD. The second aim of the study was to determine if the new measure of magical thinking is associated with OCD symptoms, and we predicted that there would be a positive correlation.
Method
Scale construction
An initial 40-item pool was generated based on existing instruments and the second and third authors who are experienced in the cognitive behavioural treatment of OCD generated new items. Thirteen items were reverse scored. Items were developed to reflect (a) the notion that certain events happen because of magic and are beyond scientific explanation; (b) belief in a higher power or guiding spirit or force; (c) belief in the power of thoughts, feelings or dreams in predicting events; and (d) general magical beliefs, e.g. superstitions, psychics, horoscopes. Small-scale pilot testing with a convenience sample was carried out to verify that items were understandable. Items that were rated as being difficult to understand were re-worded.
Participants
A total of 1194 people took part in the study, of whom 447 participants from the community were recruited to test the factor structure and validity of the IBI. The community sample consisted of 61% females, mean age = 35.2 years (SD = 10.6), the majority of whom were working full-time (72%), were not studying (84%), and lived in Australia (81%), the UK (7%) and US (6%). The recruitment of the community sample involved a mixture of convenience and snowball sampling via the Internet. Personal contacts of the researchers were invited by e-mail to participate in the study, and were asked to forward the e-mail or website link to the online survey to family, friends and co-workers.
A further 747 participants were recruited from a sceptic society that promotes critical thinking into the paranormal, pseudoscientific and supernatural. The recruitment of the sceptic sample was achieved by posting the website link to the research on a sceptic interest group website. The rationale for including a sceptic sample was that we hypothesized that individuals belonging to this interest group may be likely to have lower magical beliefs (for example, belief in telepathy, clairvoyance) and thus could provide a useful test of the divergent validity of the IBI. The sceptic sample consisted of 86% males, mean age of 42.2 years (SD = 12.1), the majority of whom were working full-time (75%), were not studying (87%), and lived in the US (52%), UK (15%) and Australia (12%).
Measures
Magical Ideation Scale (MIS; Eckblad and Chapman, Reference Eckblad and Chapman1983) The MIS is a 30-item true-false measure that was used to establish convergent validity. It is a measure of psychosis proneness but has items relevant to magical thinking. It has good internal reliability, alpha = .82 for males and .85 for females. In the current study, alpha = .83. Chapman et al. (Reference Chapman, Chapman and Miller1982) demonstrated good test-retest reliability (r = .80 - .82).
Rational-Experiential Inventory (REI; Pacini and Epstein, Reference Pacini and Epstein1999). The REI is a 40-item measure of rational and experiential thinking. Items are rated on a 5-point Likert scale from 1 (definitely not true of myself) to 5 (definitely true of myself). It comprises two scales: the Rationality scale, and the Experientiality scale that has been replicated (Marks, Hine, Blore and Phillips, Reference Marks, Hine, Blore and Phillips2008). The Rationality scale of the REI was chosen as a measure of discriminant validity as it was hypothesized that rational thinking is the opposite of magical thinking. The Rationality scale has excellent internal consistency (α = .90) (Pacini and Epstein, Reference Pacini and Epstein1999).
Obsessive-Compulsive Inventory – Revised (OCI-R; Foa et al., Reference Foa, Huppert, Leiberg, Langer, Kichic and Hajcak2002). The OCI-R is an 18-item measure of OCD symptoms answered on a 5-point Likert scale from 0 (not at all) to 4 (extremely). The OCI-R has six sub-scales: Washing, Obsessing, Hoarding, Ordering, Checking, and Neutralizing. It has convergent validity with the MOCI (r = .85) and good internal consistency in a clinical (α = .81) and non-clinical sample (α = .76 - .84, with the exception of Hoarding (α = .61) and Neutralizing (α = .61) (Foa et al., Reference Foa, Huppert, Leiberg, Langer, Kichic and Hajcak2002; Hajcak, Huppert, Simons and Foa, Reference Hajcak, Huppert, Simons and Foa2004). In the current study, alpha for the total scale was .88 and ranged from .75 to .88 for the subscales, with the exception of Neutralizing (α = .52).
Procedure
Ethics approval for the study was obtained from Curtin University ethics committee prior to contacting participants. Participants in both Sample 1 and Sample 2 completed the measures via an online survey hosted on Question Pro (www.questionpro.com).
Results
All analyses were conducted on the primary sample of interest, the community sample (n = 447), with the exception of the final analysis in regards to divergent validity, when the community sample was compared to the sceptic sample (n = 747). Therefore the following presentation of results of factor analysis, internal consistency, and concurrent validity is presented based on only the community sample (Sample 1).
Exploratory factor analysis
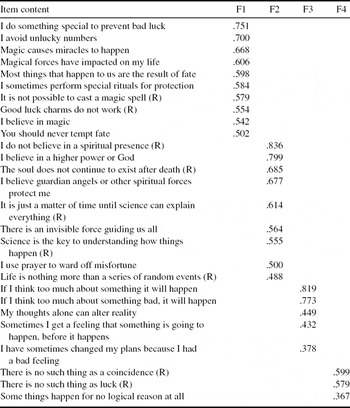
Exploratory factor analysis (EFA) was carried out on data from Sample 1 with the 40 items. Principal components extraction revealed nine factors with Eigenvalues greater than 1 (Kaiser's criterion), accounting for 59.72% of the variance. Parallel analysis was used to iterate the solution while holding the number of factors constant (Comrey, Reference Comrey1988). A comparison of Eigenvalues revealed four factors for extraction. Principal axis factoring (PAF) on a 4-factor solution was performed, which was subject to Promax oblique rotation. Examination of the 4-factor solution revealed a number of items with low communalities. Although variables with loadings of .32 and above are usually interpreted (Tabachnick and Fidell, Reference Tabachnick and Fidell2007), this identified only five items for exclusion. Thus loadings in excess of .42 were selected, identifying a further six items for exclusion. In addition, two items were discarded, as they had strong loadings on multiple factors. Consequently, this initial EFA reduced the items from 40 to 27. A second PAF analysis was conducted on the remaining 27 items. Parallel analysis suggested a 4-factor solution, which accounted for 50.96% of the total variance. Factor 1 accounted for 31.35% of the variance, Factor 2, 8.71%, Factor 3, 5.88%, and Factor 4, 5.01%, as seen in Table 1.
Promax rotated factor structure of the IBI in the community sample (N = 447)
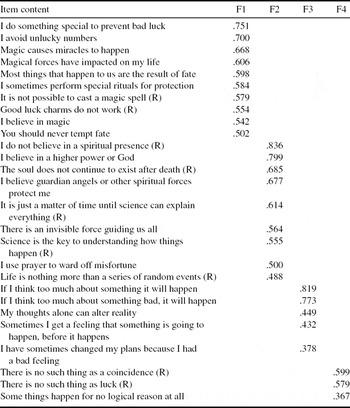
Note: F1 = Factor 1; F2 = Factor 2; F3 = Factor 3; F4 = Factor 4. R = Reverse scored
Internal consistency reliability
Confirmatory factor analysis of the 4-factor solution using LISREL confirmed it was appropriate to combine subscales into a single overall score. The IBI total scale demonstrated excellent internal consistency (α = .93). There was acceptable internal consistency for Factor 1 (α = .84), Factor 2 (α = .87) and Factor 3 (α = .75), but unacceptable reliability for Factor 4 (α = .49). The corrected item-total correlations from the internal consistency reliability analysis of the total IBI-27 were inspected to check the correlations between the items on Factor 4 (items numbered 15, 29 and 31 from the original IBI-40 item pool) and the total score from the IBI-27. This revealed that two items loading on Factor 4 (items 29 and 31) had correlations less than .30, suggesting these items should be removed as they are measuring something different to the scale as a whole (de Vaus, 2004; Pallant, Reference Pallant2001), and Cronbach's alpha would remain stable or slightly increase if these items were removed. It was decided that it was appropriate to discard items 29 and 31 loading on Factor 4 from further analysis. This left one item loading on Factor 4 (original IBI-40 item number 15), which also had a low corrected-item total correlation (r = .380). It was therefore decided to drop the entire Factor 4 from further analyses. Confirmatory factor analysis testing a 3-factor model was then carried out to determine whether this improved the model fit. As seen in Table 2, a 3-factor model produced a better fit than the 4-factor model: Comparative Fit Index (.94), Non-normed Fit Index (.94), Expected Cross-Validation Index (3.09) and Root Mean Square Residual (.07).
Comparative fit indices for the IBI-27 and IBI-24 hierarchical structure analysis in the community sample (N = 447)

Note: RMSEA = root mean square error of approximation; ECVI = expected cross-validation index; CFI = comparative fit index; NNFI = non-normed fit index; RMR = root mean square residual; AGFI = adjusted goodness of fit index.
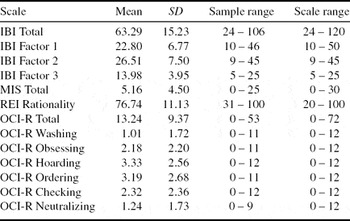
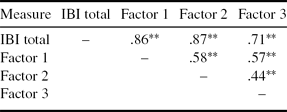
The means and standard deviations for Sample 1 are shown in Table 3. As Factor 4 was dropped from subsequent analyses, the 24 item IBI scores can range from a minimum of 24 to a maximum of 120. It can be seen in Table 4 that there was a significant correlation between each of the factors.
Means, standard deviations and ranges of the measures in the community sample (N = 447)
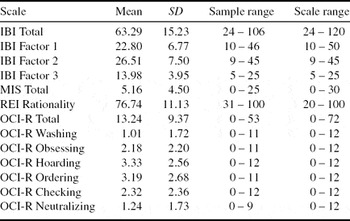
Note: IBI = Illusory Beliefs Inventory; MIS = Magical Ideation Scale; REI = Rational-Experiential Inventory; OCI-R = Obsessive-Compulsive Inventory – Revised.
Spearman Correlations between the IBI-24, MIS, REI, OCI-R in the community sample (N = 447)

Note: MIS = Magical Ideation Scale; REI = Rational-Experiential Inventory; OCI-R = Obsessive-Compulsive Inventory – Revised;
*p < .05 (1-tailed). **p < .01 (1-tailed)
Construct and criterion-related concurrent validity
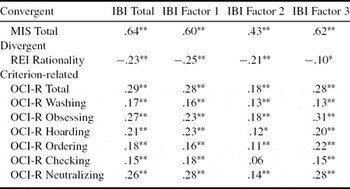
The correlations between the IBI and other measures can be seen in Table 5. Convergent validity was demonstrated with a significant correlation with the MIS (r = .64, p < .01). Discriminant validity was demonstrated via a significant negative correlation with the REI (r = −.23, p < .01). Criterion-related concurrent validity was demonstrated as the IBI had a positive correlation with the OCI-R (r = .29, p < .01).
Spearman correlations between the IBI-24 total scale and subscales in the community sample (N = 447)

* p <.01 level (2-tailed)
Divergent validity – sceptic sample comparison
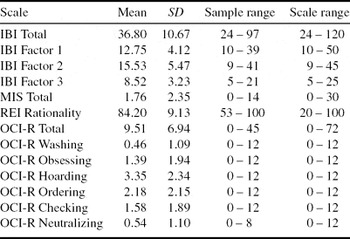
The means and standard deviations for the sceptic sample are shown in Table 6. Mann Whitney U Tests were used to compare the IBI total scores in the general sample with the sceptic sample. The general population sample (n = 447) had significantly higher total IBI scores (M = 63.29, SD = 15.23) than the sceptic sample (n = 747) (M = 36.80, SD = 10.67), (z = −24.03, p < .001).
Means, standard deviations and ranges of the measures in the sceptic sample (N = 747)

Note: IBI = Illusory Beliefs Inventory; MIS = Magical Ideation Scale; REI = Rational-Experiential Inventory; OCI-R = Obsessive-Compulsive Inventory – Revised.
Discussion
This study reported on a new 24-item measure of magical thinking. Three factors were identified, which we labelled as magical beliefs, spirituality and internal state and thought fusion.
Factor 1: magical beliefs
The items loading on Factor 1 encompass a range of beliefs related to magic in general, e.g. “I believe in magic”, as well as superstitions, e.g. “I do something special to prevent bad luck”. However, other items loading on this factor relate to broader beliefs regarding the existence of fate, e.g. “Most things that happen to us are the result of fate”. To date, measures of magical thinking included concrete examples of superstitions or magical beliefs. In contrast, the IBI appears to tap into an underlying view that there is a fixed order to the universe where unseen forces determine events or outcomes. Keinan (Reference Keinan2002) found that superstitious behaviours increased during a stress induction task in individuals with a high desire for control and interpreted this as evidence that magical rituals function to provide control over threat. It makes sense that fate, magical beliefs and superstitious beliefs and behaviours loaded together on one factor. Belief in magic underlies the items loading on this factor – from belief in magic itself to magic being the cause or result of beliefs and actions.
Factor 2: spirituality
The items loading on Factor 2 have religious beliefs as a central theme, including beliefs in a spiritual presence or higher power, that guardian angels or other forces protect the individual, and that prayer can be used to ward off misfortune. In contrast, the items that are reverse scored advocate scientific explanations of the world. According to Tobacyk (Reference Tobacyk1995a) religious beliefs are akin to superstitions and fall within the definition of paranormal. The content of traditional religious beliefs (e.g. resurrections and miracles) is similar to superstitions as they both rely on processes that defy scientific explanation. For this reason, Tobacyk and Milford (Reference Tobacyk and Milford1983) included a number of items relating to traditional Christian religious beliefs in the PBS. However, Factor 2 taps into beliefs that are broader than traditional Christian religious beliefs and represents items that might be supported by a number of religious philosophies. The items are consistent with previous research. Irwin (Reference Irwin1993) reviewed the positive relationship between paranormal beliefs and religiosity. Rachman (Reference Rachman1997) emphasized that highly religious persons are vulnerable to developing OCD. Steketee, Quay and White (Reference Steketee, Quay and White1991) found that individuals with OCD who were religious reported significantly more religious obsessions. Sica, Novara and Sanavio (Reference Sica, Novara and Sanavio2002) found that the cognitive domains of control of thoughts and over importance of thoughts were related to OCD symptoms in individuals with a high or medium involvement in religion.
Factor 3: internal state and Thought Action Fusion
Factor 3 is closely aligned with TAF, e.g. “If I think too much about something bad, it will happen”. However, closer inspection indicates that it is broader than TAF alone, e.g. “I have sometimes changed my plans because I had a bad feeling”, which represents a cognitive appraisal in regards to intuitive or feeling states. Another item alludes to the experience of premonition. The concept of TAF has been expanded, for example Shafran, Teachman, Kerry, and Rachman (Reference Shafran, Teachman, Kerry and Rachman1999) demonstrated that “thought-shape fusion” has a role in eating disorder psychopathology. Thought-shape fusion is comparable to TAF but includes beliefs that result in perceptual distortions, called “thought-shape fusion feeling”, for example, thinking about eating a forbidden food makes an individual feel fat. Meta-cognitive beliefs about the meaning or consequences of having a thought have also been identified as having a role in OCD (Gwilliam, Wells and Cartwright-Hatton, Reference Gwilliam, Wells and Cartwright-Hatton2004). These include thought-event fusion (i.e. the belief that a thought alone can cause a negative external event) and thought-object fusion (i.e. the belief that thoughts and feelings can be transferred into objects) (Gwilliam et al., Reference Gwilliam, Wells and Cartwright-Hatton2004). Expanding TAF to include cognitive appraisals in regards to feeling and “intuitive” states in Factor 3 is consistent with these recent studies.
Reliability and validity of the IBI
The IBI total score and subscales had acceptable reliability. Evidence of convergent validity was shown with a significant positive correlation with the MIS. According to some standards, the magnitude of the relationship between the IBI and MIS is not sufficient evidence of construct validity. For example, Kline (Reference Kline1998) recommends a correlation of at least 0.8 for convergent validity. However, we argue that the MIS is not a valid measure of magical thinking as it taps into schizophrenia symptoms that are outside the scope of magical thinking. As such, it was expected that the measures would not correlate too highly.
The rationality scale of the REI had a small but significant negative correlation with the IBI. This should not be viewed as a failure to establish evidence of the discriminant validity as, given the large sample size, the finding of a statistically significant small correlation is unsurprising. These results demonstrate that individuals with higher magical thinking scores had lower rational thinking scores. This is consistent with King, Burton, Hicks and Drigotas (Reference King, Burton, Hicks and Drigotas2007), where higher REI rationality scores were associated with lower superstitious beliefs.
The IBI demonstrated criterion-related validity as a significant, small positive relationship between the total and subscales of the IBI and OCI-R confirms that magical thinking and OCD symptoms are related in the general population. Furthermore, it confirms our prediction that magical thinking would be related to higher OCD symptomatology. The pattern of correlations suggests that symptoms of neutralizing, obsessing and hoarding are particularly relevant to the Magical Beliefs and Internal State and Thought Action Fusion subscales of the IBI. The largest correlation for the Spirituality subscale was also with the OCI-R Obsessing subscale. This is consistent with Bocci and Gordon's (Reference Bocci and Gordon2007) findings that magical thinking was associated with harm avoidance behaviours. This suggests that individuals with high magical thinking and TAF are more likely to engage in neutralizing activities. The relationship between the OCI-R Obsessing subscale and the Internal State and Thought Action Fusion subscale might be explained by an individual believing that thoughts or feelings can harm others, thus one needs to control unpleasant intrusive thoughts from occurring. Further, the observed relationship between OCI-R Obsessing and the Spirituality subscale is supported by evidence that religious individuals endorse more dysfunctional beliefs regarding the need to control thoughts (Sica et al., Reference Sica, Novara and Sanavio2002). There is also evidence that superstitious behaviours are closely associated with obsessional thoughts (Frost et al., Reference Frost, Krause, McMahon, Peppe, Evans and McPhee1993; Zebb and Moore, Reference Zebb and Moore2003). This would account for the relationship between the Magical Beliefs subscale and the OCI-R Obsessing subscale.
Finally, the magnitude of the relationship between the OCI-R Hoarding subscale was most prominent for the Magical Beliefs subscale. This finding is consistent with research showing that hoarders displayed more magical thinking than non-hoarders (Storch et al., Reference Storch, Lack, Merlo, Geffken, Jacob and Murphy2007). Frost and Hartl's (Reference Frost and Hartl1996) cognitive-behavioural model suggests that hoarded possessions are often associated with comfort and safety. Given the evidence that magical beliefs, particularly superstitions, function to provide a sense of control over danger (e.g. Keinan, Reference Keinan2002), it is not surprising the two constructs are related.
Divergent validity
This study used an extreme group approach to establish divergent validity by comparing the general population with sceptics. As predicted, sceptics were lower on magical thinking than the general population, and this is not surprising because they are known to openly question the credibility of magical thinking, such as beliefs relating to paranormal phenomena.
Limitations of the study and implications of this new measure of magical thinking
There is little agreement in the literature as to the parameters of the construct “magical thinking” with some authors preferring a broad view and others a more narrow view. As such, one potential limitation is that there is no way of knowing whether the present IBI covers all possible styles of magical thinking. However, by carrying out a wide-ranging review of existing literature, we have sought to consolidate the state of evidence by identifying the range of existing measures that tap into the construct of “magical thinking”. Through critical assessment of these measures and systematic review of the various items, we have aimed to create a new measure that covers the construct of magical thinking as comprehensively as possible.
Furthermore, the results of this study are promising. The sample was reasonably large, covered a wide age range and was comprised of individuals from the general population, as opposed to students. However, some self-selection bias might have been introduced through the use of an Internet-based survey (Krant et al., Reference Krant, Olson, Banaji, Bruckman, Cohen and Couper2004).
The next step is to investigate the IBI in a clinical OCD sample. If individuals with OCD endorse significantly higher magical beliefs compared to individuals with other anxiety disorders and the general population, it would confirm the relevance of magical thinking in OCD. This has important implications for clinical practice. The IBI could be used to indicate when it is necessary to focus on magical thinking in treatment. To decrease magical thinking, it would be important to challenge the relative importance ascribed to thoughts, and studies have found that TAF can be modified by demystifying the nature of intrusive thoughts (Zucker, Craske, Barrios and Holguin, Reference Zucker, Craske, Barrios and Holguin2002).
Another implication is to conduct longitudinal studies with children. Magical thinking is a normal developmental phase in childhood. However, some studies have linked magical beliefs with OCD in children (Bolton, Dearsley, Madronal-Luque and Baron-Cohen, Reference Bolton, Dearsley, Madronal-Luque and Baron-Cohen2002; Evans, Milanak, Medeiros and Ross, Reference Evans, Milanak, Medeiros and Ross2002). Research into the psychometric properties of the IBI with children is required to determine whether magical thinking predisposes individuals to OCD.
Future studies using the IBI are required to investigate the stability of the 3-factor model in new samples including clinical OCD. A limitation of this study is that test-retest reliability was not determined. There is limited evidence that TAF is not a stable characteristic (Berle and Starcevic, Reference Berle and Starcevic2005). Thus, future research should examine if magical thinking is consistent or if it is affected by mood. Given the cross-sectional nature of this study, a limitation is the inability to determine the causal relations between magical thinking and OCD, and future research should investigate this.




Comments
No Comments have been published for this article.