I. INTRODUCTION
Nanostructures of metal oxides (MOxs) are attractive for physics, chemistry, material science, and engineeringReference Fierro1–Reference José and Marcos4 and represent a category of materials with diversified properties covering practically all aspects of material science and physics in areas including superconductivity and magnetism. Ionic oxides may have many different electronic structures, resulting in metallic, semiconducting, even insulating behavior. This versatility has opened up the way to numerous applications, such as microelectronic circuits,5 piezoelectric devices,Reference Jeong, Song, Min, Lee and Park6 fuel cells,Reference Reddy, Gowda, Shaijumon and Ajayan7 catalysts,Reference Kolmakov and Moskovits8 and obviously sensors.Reference Comini, Baratto, Faglia, Ferroni, Vomiero and Sberveglieri9
MOxs are already established in the field of gas sensing, where the variation of the electrical resistance upon absorption, chemisorption, or physisorption of a gas molecule is the basis of the sensing mechanism.Reference Korotcenkov10,Reference Janata and Janata11 Most of the fabrication techniques for solid-state sensors result in fabrication of either thin- or thick-film sensitive layers. Nanotechnology is in continuous evolution leading to production of quasi-one-dimensional (Q1D) structures in a variety of morphologies: nanowires (NWs), nanotubes, nanobelts, nanorods, nanorings, hierarchical structures. MOx NWs are very promising materials for sensing as they are expected to overcome the instabilities and drift in electrical properties suffered from their polycrystalline counterpart, which are related to grain coalescence. MOx NWs are crystalline structures with definite surface termination, chemical composition, and almost dislocation and defect-free structures.Reference Wang12 Due to their nanosized dimensions, the specific surface magnifies surface effects and enhances the surface-related properties, such as catalytic activity or surface adsorption, key properties for solid-state gas sensors.Reference Patzke, Krumeich and Nesper13,Reference Carpenter, Mathur and Kolmakov14 MOx NWs demonstrated some advantages with respect to thin- and thick-film layers arising from the size of the surface charge region, which can span to the entire width of the NW. In addition, an effective surface functionalization could be obtained through catalyst deposition or chemical treatments.Reference Kolmakov15 Moreover, in the field-effect transistor (FET) configuration, the gate-modulated conduction tunes sensitivity and selectivity.Reference Law, Hannes, Messer, Kim and Yang16 The gas experiments confirm the promising sensing properties; nonetheless selectivity remains an issue for MOx-based gas sensor. In this review paper, the bottom-up fabrication techniques currently used to obtain MOx nanostructures and for integration in functional devices for gas sensing will be summarized, with emphasis to the working principles and to the most recent achievements.
II. MOx NANOSTRUCTURES
MOx nanostructures may be classified into different categories depending on how many dimensions are lower than 100 nm. As a rule, clusters are considered zero-dimensional nanostructures, NWs, nanobelts, nanorods, mono-dimensional and two-dimensional films. MOxs in particular have been extensively studied and prepared in zero-, one-, and two-dimensional nanostructures; their features differ significantly from their bulk counterpart. Composition, morphology, and functional properties may be tailored to different applications, e.g., the electrical properties may vary from insulators to quasi-metallic. Bottom-up synthetic routes have widespread in the last few years compared to top-down fabrication methods (beside some of these structures could not have been created easily or economically using top-down technologies).
There is no consensus for the nomenclature used for these peculiar structures; different names have been used, like nanotubules, nanotubes, nanocastles, whiskers, fibers, fibrils, nanocables, etc. Crucial requirements for the fabrication of one-dimensional nanostructures are the control of dimensions, shape and crystalline properties, the uniformity of deposition over the substrate, and the mechanical and chemical stability.
The preparation of MOxs in form of one-dimensional structures requires preferential growth direction in a particular direction. The number of synthesis techniques is continuously increasing over the years; researchers are putting efforts in proposing cheap, simple, and reliable preparation procedures.
A. Synthesis techniques
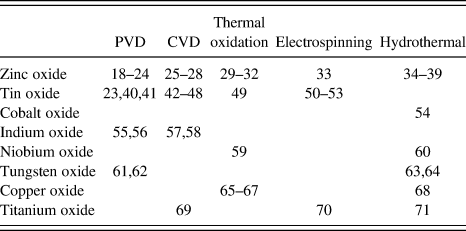
In literature are reported many different synthesis techniques specifically developed to the fabrication of MOx nanostructures, and in particular, 1D NWs. These techniques may be classified into two categories: (i) physical-based methods and (ii) chemical-based methods. In physical-based methods, MOx nanostructures grow along a preferential direction, thanks to internal or external physical forces. In chemical-based ones, instead, chemical reactions are dominating the growth process. Hereinafter are reported some bottom-up techniques largely used in the last couple of years to synthetize MOx NWs. Other techniques have also been proposed, although in less extent, such as for example pulsed laser depositionReference Marcu, Trupina, Zamani, Arbiol, Grigoriu and Morante17 or sol–gel synthesis. Table I reports some recent works on the preparation of NWs divided by preparation methodology.
Literature reference of most-studied MOx NWs between 2011 and 2013 and the synthesis technique used in the fabrication process.

1. Physical vapor deposition
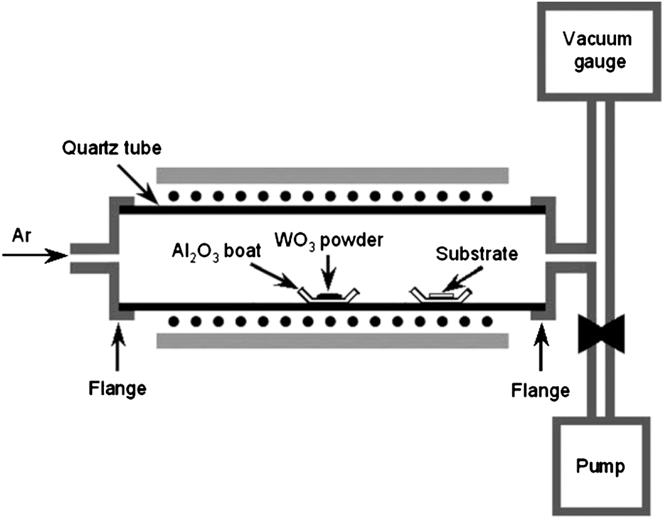
Physical vapor deposition (PVD) is probably one of the most important techniques used for the preparation of MOx NWs, together with chemical vapor deposition (CVD), mostly by thermal evaporation–condensation process. MOx powder is evaporated in a furnace at very high temperatures, in vacuum or at ambient pressure (Fig. 1). A carrier gas (like nitrogen, argon, or oxygen, for example) is used as gas carrier to assist the mass transport from the evaporation region toward the substrates. In general, a catalyst (Pt, Pd, or Au, for example) is deposited on the substrates to promote the nucleation of nanostructures (vapor–liquid–solid process).
Schematic diagram of the apparatus for the synthesis of WO3 NWs via PVD. Reprinted with permission from Ref. Reference Meng, Shaalan, Yamazaki and Kikuta61. Copyright 2012 Elsevier.
Using this technique, a lot of MOx nanostructures have been prepared, both binary or ternary/doped. SnO2,Reference Sun, Choi, Jung, Katoch and Kim40,Reference Lin, Hsueh, Lee, Wang, Wu, Perng and Shih41 ZnO,Reference Gupta, Kim, Edwards, Brantley and Ruffin18–Reference Na, Woo, Kim and Lee22 In2O3,Reference Singh, Ponzoni, Comini and Lee55,Reference Singh, Gupta and Lee56 WO3,Reference Meng, Shaalan, Yamazaki and Kikuta61 and W18O39Reference Zhu, She, Luo, Deng, Chen, Ji and Xu62 NWs have been successfully prepared for various applications. Moreover, SnO2–ZnO heterojunctionsReference Kim, Choi, Na, Kwak, Kwon and Kim23 were obtained using two different vapor-phase-based methods. Sometimes NWs have been surface-coated with organic molecules, like for ZnO,Reference Waclawik, Chang, Ponzoni, Concina, Zappa, Comini, Motta, Faglia and Sberveglieri24 to enhance the chemical sensing performance.
2. Chemical vapor deposition
CVD technique consists in the reaction of volatile precursors flowing in the chamber for the production of MOx compounds on the substrates. The deposition procedure may be very similar to the one reported in Fig. 2, which reports a typical sketch of the deposition procedure. The solid precursors are placed in the high-temperature zone of the furnace to promote evaporation. Then an inert gas carrier or a vacuum gradient transports the volatile compound toward the substrates placed in a colder region. Precursors may be metal powders, a reduced oxide powder, or an organic compound specifically tailored for the reaction. In some cases, substrates are catalyzed with noble metal particles. The energy necessary to induce the reaction is provided in many different ways, for example, microwave plasma or hot filament. NWs of ZnO,Reference Lupan, Emelchenko, Ursaki, Chai, Redkin, Gruzintsev, Tiginyanu, Chow, Ono, Cuenya, Heinrich and Yakimov25,Reference Calestani, Zha, Zanotti, Villani and Zappettini26 In2O3,Reference Qurashi, El-Maghraby, Yamazaki and Kikuta57,Reference Lim, Lee, Meyyappan and Ju58 TiO2,Reference Shi, Sun, Starr and Wang69 and SnO2Reference Tonezzer and Hieu42–Reference Dattoli, Davydov and Benkstein48 or heterostructures, like Cr2O3–ZnO core–shell,Reference Woo, Na, Kim and Lee27 metal-doped ZnOReference Hu, Han, Zhang, Ho and Chen28 may be prepared by CVD.
Experimental set-up of a possible CVD reactor for the growth of ZnO NWs on a Si substrate: (1) flowing quartz reactor, (2) Zn source, (3) internal quartz retort, (4) substrates, and (5) electric heaters. Reprinted with permission from Ref. Reference Lupan, Emelchenko, Ursaki, Chai, Redkin, Gruzintsev, Tiginyanu, Chow, Ono, Cuenya, Heinrich and Yakimov25. Copyright 2010 Elsevier.
3. Thermal oxidation
Thermal oxidation is a very simple technique for the preparation of MOx nanostructures. It mainly consists in a thermally assisted oxidation of a metal layer or stub in an oxidizing atmosphere. A metallic stub is placed in a furnace, heated at the required temperature in an oxidizing atmosphere, usually a mixture of oxygen and an inert gas (like argon or nitrogen), to promote the oxidation process. The mechanical stress produced by the temperature gradient and the lattice mismatch between the oxide and the metal layer promotes the formation of MOx NWs on its surfaceReference Mema, Yuan, Du, Wang and Zhou65 (Fig. 3).
Schematic showing the effect of surface stresses on the microstructure of the oxide layers and the subsequent oxide NW growth for copper oxide: (a) tensile stress and (b) compressive stress or stress-free. Reprinted with permission from Ref. Reference Mema, Yuan, Du, Wang and Zhou65. Copyright 2011 Elsevier.
Thermal oxidation was used to prepare MOx NW of ZnO for photoReference Campos, Guimaraes, Goncalves, de Oliveira and Lacerda29 and conductometric chemical device Reference Tonezzer and Lacerda30,Reference Le Hung, Ahn, Park, Jung, Kim, Hong, Kim and Hwang31 at atmospheric pressure, without the need of vacuum equipment, even on flexible substrates.Reference Tonezzer and Lacerda32 The same technique was also used to prepare Nb2O5 NWs for hydrogen sensing,Reference Wang, Hu, Wang, Zhang, Wang, Tian, Wang, Guan and Gu59 using lower pressures to slow down the oxidation process. Copper Reference Mema, Yuan, Du, Wang and Zhou65–Reference Zappa, Comini, Zamani, Arbiol, Morante and Sberveglieri67 and tin oxide NWs were also synthetized by thermally oxidizing the corresponding metal NWs.Reference Li, Gu, Cho, Sun and Kurup49
4. Electrospinning
Electrospinning technique uses an electrical charge to fabricate very fine wires from a liquid. A liquid precursor is loaded in a syringe closely mounted on top of a substrate. A strong electric voltage is applied between the syringe and the substrate, when it is high enough, a stream of liquid erupts from the tip. The jet is elongated by a whipping process caused by electrostatic repulsion initiated at small bends in the fiber, until it is finally deposited on the grounded collector (substrate). The elongation and thinning of the fiber, resulting from this bending instability, leads to the formation of uniform fibers with nanometer-scale diameters.
The precursor is a liquid solution, indeed melted solids could also be used. As a rule, high temperature is not required to produce the nanostructures and thus is a very attractive synthesis method at low fabricating temperature. In the past couple of years, metal-doped SnO2 nanofibers Reference Liu, Guo, Li, Wang, Dong and Li50–Reference Xu, Sun, Zhang, Wang, Dong, Jiang, Wang, Li and Wang52 and heterojunctions,Reference Wang, Li, Sun, Zhang, Wang, Zheng and Wang53 together with TiO2 NWsReference Feng, Huang and Wang70 and ZnO NWs,Reference Baranowska-Korczyc, Fronc, Klopotowski, Reszka, Sobczak, Paszkowicz, Dybko, Dluzewski, Kowalski and Elbaum33 have been prepared using this technique.
5. Hydro- and solvo-thermal
Hydrothermal synthesis is a wet chemical method to prepare single crystal materials, starting from high-temperature aqueous solution at high vapor pressure. Nanostructure growth is performed inside an autoclave, made by a proper material (usually stainless steel), in which a chemical seed solution (the nutrient) is placed together with the water source (Fig. 4). The applied temperature increases the pressure inside the sealed autoclave, promoting the formation of nanostructures. In literature, different MOx NWs have been synthetized using this technique: ZnO NWsReference Li, Yang, Yu, Wang, Zhang, Chen and Yang34–Reference Guha, Santra, Covington, Udrea and Gardner37 (even on textileReference Lim, Chia, Kevin, Wong and Ho38), Co3O4 NWs,Reference Zhao, Pang, Wu, Liu, Zhang, Ma, Sun, Zhang and Chen54 TiO2,Reference Wang, Chen and Jen71 Nb2O5,Reference Fang, Hu, Huo, Gao, Zhao, Liao, Chu, Bando and Golberg60 and CuO/Cu2O,Reference Kevin, Ong, Lee and Ho68 for example. Sometimes the hydrothermal technique was used in cooperation with other techniques, such as CVD.Reference Wang, Zhang, Liao, Yu, Shen, Li, Huang and Zhang39
Schematic diagram of hydro- and solvothermal autoclave. In the solution (in blue), we have the formation of the nanostructures, under certain conditions of pressure and temperature (in red, external heating).
The solvothermal technique is closely related to the hydrothermal technique. The difference between the two techniques is in the precursors solution placed in the autoclave. While an aqueous precursor is the base for hydrothermal, a nonaqueous precursor is the one for solvothermal. In the last couple of years, the solvothermal technique was used for the synthesis of WO3Reference Hoa and El-Safty63,Reference Qin, Shen, Li and Hu64 NWs, for instance.
B. Fundamental characterization
The description and the modeling of low-dimensional nanostructures as well as the capability to design and fabricate novel functional devices are based on the knowledge of the basic structural features such as lattice arrangement, defects, crystal shape, local chemical composition, and homogeneity. Ultimately, the microstructural characterization addresses the compelling physical properties starting from the measurement of atom positions and distances between them. Also defects, dopants, and interfaces play a significant role in determining the electrical and sensing properties.
The techniques used for characterization are thus requested to guarantee high sensitivity and spatial resolution to investigate such a small sample as a NW. Electron microscopy, scanning probe microscopy, and, recently, atom probe tomography are effective and largely used.
Transmission electron microscopy merges the highest attainable spatial resolution with the potential to extract information from a tiny fraction of the material (of the order of 10−24 kg) owing to the larger electron-matter cross section if compared to the one for x-rays.Reference Urban72,Reference Urban73 The scanning transmission imaging mode in the TEM (STEM) is one of the techniques of choice for NW characterization, which takes advantage of a finely focused electron beam. The electron beam forms a probe with subnanometric size and is used to raster the thin sample.Reference Thomas and Midgley74 The signal from forward scattered electrons and from the visible and high frequency electromagnetic radiation generated by the beam–specimen interaction can be collected to measure the composition and the electronic configuration within a single atomic column. Electron detectors measure the intensity of the forward scattered beam (high-angle annular dark field) to provide a z-contrast image of the sample at atomic resolution, whereas cathodoluminescence, x-rays, and spectrometers for electron energy loss can simultaneously acquire the corresponding signals. In addition, nanoprobe electron diffraction experiments can be performed. It is thus possible to determine the chemical composition, the atomic structure, the bonding, and the valence state for the atoms within the specimen.Reference Jia, Mi, Urban, Vrejoiu, Alexe and Hesse75,Reference Muller76 The implementation of electron holography and electron tomography allows one to retrieve the complete exit wave for electrons and to reconstruct the three-dimensional arrangement of atoms in the specimen. A complete knowledge of the sample and the mapping of the inner electrostatic potential is therefore possible with these techniques and extremely useful for the description of the electrical properties of NWsReference Midgley and Dunin-Borkowski77,Reference Wolf78 and heterostructures.Reference Verheijen, Algra and Borgström79
TEM characterization can be also extended from steady to dynamical observation under changing conditions. In situ modification of the nanostructure in controlled conditions and its simultaneous observation could provide new insights in the comprehension of the system under investigation and to envisage new technological applications. As a remarkable example, in situ experimentation of Li diffusion on SnO2 NWs has been studied by HuangReference Huang80 The lithium–SnO2 system is considered as an important material in the field of energy storage as innovative anodes, and the effect of cyclical diffusion inside/outside the tin oxide structure may affect the density of defects and lattice strain of the material. Similarly, and with strict analogy, the diffusion of bulk oxygen from the MOxs, activated by the high operating temperature, is at the basis of stability and long-term evolution of the electrical sensing performance.
In Huang's work,Reference Huang80 the diffusion dynamics of lithium in tin oxide NWs has been promoted and studied in the TEM (Fig. 5). The formation of large number of lattice dislocations has been observed at the early stage of Li diffusion, followed by break down of long range order in the crystalline assembling. The advance of the highly dense dislocation boundary upon lithium diffusion has been also observed, demonstrating the potential and the interest of the technique.
Series of TEM images showing the evolution of a tin oxide NW upon diffusion of lithium from the underlying support. The arrows mark the region of the NW with high density of dislocations and the migration driven by diffusion. The increase of defect density eventually results in the amorphization to the nanostructure. From Ref. Reference Huang80—reprinted with permission from AAAS.
One of the most challenging issues in NW characterization consists in the analysis of electrically active dopants. The required spatial resolution and chemical sensitivity call for the highest instrumental performance, and new methodologies are being exploited for the purpose. Atom probe tomography has emerged as a powerful tool for characterization of dopants in some recent publicationsReference Perea81 (Fig. 6). Atom probe tomography takes advantage of a sample in the form of NW or rod-like to reconstruct the three-dimensional disposition of atoms in the specimen. The measurement of the distribution of single dopant atoms in the structure has been demonstrated. The presence of impurities from the growth process or the distribution of deliberately added dopants to tailor the electrical properties has been measured.
False-color visualization of the three-dimensional reconstruction of an indium arsenide NW. (a) Side view of the NW. In and As atoms are respectively green and red. Gold atoms, form the catalytic cluster used to promote the NW growth, are presented in yellow color (only 5% of the Au atoms are shown). (c) Scanning electron micrograph of an InAs nanowire showing hexagonal cross section. In (b and e), the reconstruction and the SEM image of the section are compared, whereas in (d), the 0001 atomic planes are resolved. Reprinted with permission from Ref. 81—Copyright 2006 American Chemical Society.
C. Integration into functional devices
To evaluate the performances as a chemical sensor MOx nanostructures have to be integrated in a functional device. The integration strategy used is strongly related to the synthesis process selected for the growth. In general, there are two different types of functional devices: mat-based or single NW devices.
Mat-based devices are quite easy to fabricate because they just need conventional techniques, like metal deposition or silver gluing. Single NW devices instead are more demanding in terms of costs and fabrication time. They need more expensive techniques, such as focused ion beam (FIB) or electron beam lithography (EBL) to fabricate electrodes on top of the NW. Moreover, alignment is critical because it is quite difficult to locate a single NW on a large substrate. In this section, we briefly introduce some integration techniques used in the past few years to prepare NW chemical sensors.
1. Electric contacts
One of the simplest methodologies for the integration of NW networks in functional devices is the deposition of a couple of electrodes on top of the sensing material. Common metal deposition techniques are shadow-masking sputteringReference Kim, Choi, Na, Kwak, Kwon and Kim23–Reference Lupan, Emelchenko, Ursaki, Chai, Redkin, Gruzintsev, Tiginyanu, Chow, Ono, Cuenya, Heinrich and Yakimov25,Reference Baranowska-Korczyc, Fronc, Klopotowski, Reszka, Sobczak, Paszkowicz, Dybko, Dluzewski, Kowalski and Elbaum33,Reference Singh, Ponzoni, Comini and Lee55,Reference Wang, Hu, Wang, Zhang, Wang, Tian, Wang, Guan and Gu59,Reference Zhu, She, Luo, Deng, Chen, Ji and Xu62,Reference Qin, Shen, Li and Hu64,Reference Zappa, Comini, Zamani, Arbiol, Morante and Sberveglieri67 and thermal evaporation.Reference Woo, Na, Kim and Lee27,Reference Shaalan, Yamazaki and Kikuta46 Sometimes, the substrate is patterned before the sensing material deposition.Reference Na, Woo, Kim and Lee22,Reference Lupan, Emelchenko, Ursaki, Chai, Redkin, Gruzintsev, Tiginyanu, Chow, Ono, Cuenya, Heinrich and Yakimov25 In these cases, NWs were diluted in ethanol or water and then dropped on the patterned substrate.
An even simpler technique is to use the silver paste to directly glue the nanostructures to the electrodes.Reference Yao, Hu, Cao, Xiang, Zhang, Yuan and Chen20,Reference Tonezzer and Lacerda30,Reference Tonezzer and Lacerda32,Reference Lim, Lee, Han and Park36,Reference Lim, Chia, Kevin, Wong and Ho38,Reference Wang, Hsiao, Chang, Lam, Wen, Young, Hung and Huang66 Both of these approaches work well when the active material is distributed on a large surface, like in NW mats. Unfortunately, it is not applicable in the case of single NW devices since more sophisticated techniques are required.
Table II summarizes the different technologies for the preparation of electrical sensing devices for MOx NWs in the last few years.
Literature references for mat- and single NW-based devices, according to different integration techniques.
2. Electrode/substrate
Monitoring the electrical current flowing inside the material is required for the development of conductometric devices, whereas in optical devices, contacts are not required because an external detector measures the optical emission. ZnO NW-based optical biosensors were fabricated by simply depositing mats on a silicon substrate.Reference Gupta, Kim, Edwards, Brantley and Ruffin18 ZnO nanotubes were used as a simple electrode for biochemical potentiometric devices.Reference Ibupoto, Khun and Willander83 In other applications, metallic Zn was used as a substrate for ZnO NW-based gas sensors.Reference Li, Yang, Yu, Wang, Zhang, Chen and Yang34
3. Lithography
Lithography is a printing technique where a sacrificial layer is deposited on a substrate and then etched according to a specific pattern. In the fabrication of nanostructured devices, mainly two different lithographic techniques may be used: photolithography and EBL. The conceptual difference between the two processes is that in photolithography, masks are needed to pattern the deposition area, whereas EBL is maskless. However, lithography is only a patterning technique and has to be used together with metal deposition methods like thermal evaporation or sputtering.
Lithography is a well-used technique in the semiconductor industry to fabricate devices using the “top-down” approach. Moreover, even in “bottom-up” approaches, both optical and electronic lithography has been largely used to fabricate electrical contacts on substrates to prepare different types of devices.
NWs mats have been contacted by optical lithography to fabricate conductometric gas sensor devices.Reference Qurashi, Faiz, Tabet and Alam35,Reference Sun, Choi, Jung, Katoch and Kim40,Reference Choi, Jung and Kim45,Reference Qurashi, El-Maghraby, Yamazaki and Kikuta57 Electronic lithography has been used to fabricate ZnO four-probe devices.Reference Ahsanulhaq, Kim, Lee and Hahn82 Sometimes lithographic-patterned substrates (like MEMS membrane) were used to directly grow NWs.Reference Guha, Santra, Covington, Udrea and Gardner37 Lithography was often used to prepare a single NW device: a single ZnO NW was contacted by optical lithography and metal deposition techniquesReference Campos, Guimaraes, Goncalves, de Oliveira and Lacerda29 to fabricate a photodetector. A batch of single SnO2 NWReference Tonezzer and Hieu42 conductometric devices was prepared to study the relationship between the diameter size and response. A single Nb2O5 NW was used to fabricate an UV photodetector using both optical and electronic lithography.Reference Fang, Hu, Huo, Gao, Zhao, Liao, Chu, Bando and Golberg60
4. Focused ion beam
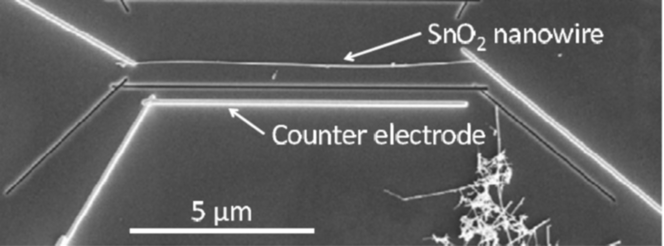
FIB uses a focused beam of ions to analyze, etch, or even deposit different materials on a substrate. In some cases, the ion beam may be used to pattern a surface, like in the electron beam or optical lithography, whereas in others, it may be used to directly deposit a material, usually metals, on a substrate. For this reason, FIB is often used to build electrodes to contact single NWs to fabricate a working sensing device (Fig. 7). In the last few years, the FIB technique has been used to fabricate single ZnO NW hydrogen sensors,Reference Lupan, Emelchenko, Ursaki, Chai, Redkin, Gruzintsev, Tiginyanu, Chow, Ono, Cuenya, Heinrich and Yakimov25,Reference Lupan, Chow, Pauporte, Ono, Cuenya and Chai84 SnO2 NW ammoniaReference Shao, Hoffmann, Prades, Morante, Lopez and Hernandez-Ramirez43 nanosensors, p-Si/n-ZnO core–shell oxygen nanosensors,Reference Gad, Hoffmann, Hernandez-Ramirez, Prades, Shen and Mathur85 SnO2 surface ionization sensors,Reference Ramirez-Hernandez, Prades, Hackner, Fischer, Muller, Mathur and Morante47 and SnO2 Pd-doped segmented devices.Reference Sysoev, Strelcov, Kar and Kolmakov44
Single SnO2 NWs FIB-contacted on a silicon chip. Reprinted with permission from Ref. Reference Ramirez-Hernandez, Prades, Hackner, Fischer, Muller, Mathur and Morante47. Copyright 2011 Elsevier.
5. Electrophoresis
Dielectrophoresis is an effective technique to fabricate even single NW devices. NWs are usually dispersed in a solution, that is deposited on a prepatterned substrate. Usually, photolithography is used to fabricate the matrix of noble-metal electrodes at a fixed distance, in the order of some micrometers. An AC voltage is then applied to electrodes, generating an alternating electric field in the gap between the electrodes, and inducing an electrical dipole in the NWs, attracting the NWs toward the gap (Fig. 8). This technique is very effective to prepare mat-based conductometric devices.Reference Li, Gu, Cho, Sun and Kurup49 Moreover, even a single ZnO NWReference Kiasari, Soltanian, Gholamkhass and Servati21 has been successfully integrated in a conductometric humidity sensor, thanks to the high yield, probably this is one of the most interesting techniques for the preparation of single NW devices.
Schematic diagram of sensor chip fabricating procedure using dielectrophoresis and top view of the sensor chip surface (SEM image, bottom left). Reprinted with permission from Ref. Reference Li, Gu, Cho, Sun and Kurup49. Copyright 2011 Elsevier.
III. FUNCTIONAL CHARACTERIZATION
The gas sensing properties of MOxs arise from adsorption of molecules from the gas phase on reactive surface atoms, which lack binding partners. The first step of adsorption is physisorption, which is a slightly exothermic process characterized by high coverage at low temperature and a low coverage at high temperature. If the partial pressure is very low, the amount physisorbed is simply proportional to the partial pressure (Henry's law). Physisorbed species can be chemisorbed (ionosorbed) when the adsorbate acts as a surface state capturing an electron or a hole.Reference Madou and Morrison86
The appearance of surface-localized acceptor states in n-type semiconductors induces therefore charge transfer between bulk and surface to establish thermal equilibrium between the two. The charge transfer results in a nonneutral region (with a nonzero electric field) in the semiconductor bulk, usually referred to as the surface space charge region (SCR). In the simple charge transfer model,Reference Kronik and Shapira87 the physisorbed and chemisorbed atoms and molecules are represented by surface localized states in the semiconductor energy gap, whose occupation statistic is given by the same Fermi–Dirac distribution, with physisorption corresponding to unoccupied and chemisorption to occupied states.
The process of gas detection is intimately related to the reactions between the species to be detected and ionosorbed surface oxygen. Direct adsorption is also proposed for the gaseous species—like strongly electronegative NO2—whose effect is to decrease sensor conductance. An important ubiquitous species that ionosorbs over MOx surfaces is water. The chemisorption of water onto oxide from air can be very strong, forming a “hydroxylated surface.”Reference Madou and Morrison86
In addition to surface states, another important phenomenon associated with a semiconductor surface is the surface dipole.Reference Kronik and Shapira87 An adsorbate layer may result in a surface dipole, the magnitude of which depends on the ionicity of the adsorbate–substrate bond. The surface dipole manifests itself as a step in the electric potential at the surface because the potential changes abruptly over several monolayers. This is in contrast to the macroscopic dipole created by the surface states and surface SCR.
Addition of a small amount of noble metals over the MOx surface such as Au, Pd, Pt, and Ag can speed up surface reactions and improve selectivity toward target gas species. From the energetic point of view, the effect of catalysis is to provide a more favorable reaction path. The catalyst should be dispersed as small crystallites over the surface of the oxide to be active near the grain boundaries where carrier transport takes place.
As for conduction, deviation of stoichiometry of high gap MOxs is responsible for their semiconducting propertiesReference Tsuda, Nasu and Fujimori88: cation vacancies are acceptors, producing holes and negative charged vacancies, whereas shallow states made up of oxygen vacancies are double n-type donors, the electrons on the adjacent cation are easily removed and donated to the conduction band.Reference Samson and Fonstad89 MOx gas sensors are generally operated in air in the temperature range between 500 and 800 K where conduction is electronic and oxygen vacancies are doubly ionized and fixed.
In traditional polycrystalline gas sensors, the high temperature required for the surface reactions to take place induces a grain growth by coalescence and prevents the achievement of very stable materials. In comparison, stable Q1D MOxs have several properties attractive for chemical sensing applications like high surface to bulk ratio; most of the atoms are available for surface reactions with surrounding molecules. Besides, the Debye length (a measure of the electronic “cross talk” between the surface processes and the bulk electronic structure) is comparable to its lateral dimension, and therefore electronic properties are strongly influenced by surface processes. Moreover, nowadays, a fine control over the faceting, morphology, composition, doping level, defined stoichiometry, and high crystallinity can be achieved.
The metal semiconductor junction that forms at the interface between the layer and the contacts plays a role in gas detection; the contact resistance is more important for single NWs since it is in series to the semiconductor resistance than for bundles where it is connected to a large number of interconnection resistances. Moreover, the metal used for the contact acts also as a catalyst.
As for signal transduction, the easiest measurable physical quantity is the sensor conductance in DC conditions. The sensor response toward a target gas concentration is defined as the (relative) change of conductance (resistance in the presence of NO2 or other oxidizing species). Starting from the sensor response, it is possible to derive the sensor response curve, which is the representation of the steady state output as a function of the input concentration. The sensor response curve is frequently erroneously called sensitivity, which is instead the derivative of the sensor response curve.
A. Conductometric devices
As introduced before, two types of chemiresistors can be prepared by NW technology: NW bundles or single NW devices.
Bundle deposition is the easiest to carry out from the technological point of view, since it does not require any post processing as nanomanipulation of NWs at the nanometric scale; the first type of NW-based gas sensors proposed in the literature was based on NW bundles.Reference Comini, Faglia, Sberveglieri, Pan and Wang90
Single NW preparation is much more challenging from a technological point of view, nevertheless profits from the intrinsic features of the NW structure, such as the high crystalline degree free from crystallite interfaces, which are present in bundled NWs. Such interfaces are supposed to play the same role as grain boundaries in traditional polycrystalline layers and are thus of primary importance in affecting the properties of NW-based gas sensors. In polycrystalline materials, grain boundaries represent at the same time an asset and a drawback. They are important to improve sensitivity since they are the most effective elements to transduce chemical reactions occurring at the oxide surface.Reference Barsan and Weimar91 At the same time, grain boundaries are often suggested as sites where grain-coarsening phenomena occur, activated by the high working temperature (200–500 °C) of gas sensors.Reference Korotcenkov, Brinzari, Ivanov, Cerneavschi, Rodriguez, Cirera, Cornet and Morante92,Reference Ippolito, Ponzoni, Kalantar-Zadeh, Wlodarski, Comini, Faglia and Sberveglieri93 Grain coarsening causes a drift with time of the microstructure of the sensing layer and thus a drift in its electrical properties, which limit the sensor stability over long time operation.Reference Carotta, Ferroni, Guidi and Martinelli94 Furthermore, the large number of grain boundaries typically present in a sensor device makes the conduction mechanism to occur in a percolative regime, thus requiring a high skill to prepare a layer featuring both very narrow grain size and connection network distribution, to prevent lack of reproducibility from sensor to sensor.Reference Orton and Powell95 These drawbacks have been at the basis of research moving from thick film to thin film technology during the 80–90s and recently to the NW technology.Reference Ponzoni, Comini, Concina, Ferroni, Falasconi, Gobbi, Sberveglieri and Sberveglieri96
In the following sections, different strategies adopted with NWs to increase their functional properties, namely sensitivity, selectivity, and stability are reviewed, comparing, where possible, the obtained achievements with state of the art results obtained with thin and thick film technologies.
1. Sensitivity
It has been well demonstrated that sensitivity of NWs increases with decreasing the NW diameter down to the Debye length.Reference Comini, Baratto, Faglia, Ferroni, Vomiero and Sberveglieri9
NW bundles at increased density, featuring a higher number of nanowire–nanowire interfaces, has been proposed as another effective solution to improve sensitivity. In particular, Zhang et al.Reference Zhang, Liu, Li, Tang, Liu, Han, Lei and Zhou97 compared the performances of devices based on a single NW connected by two electrodes and based on bundles of NWs showing the higher sensitivity of the latter. A single In2O3 NW featuring no crystallite–crystallite interfaces at all showed a detection limit of 20 ppb NO2 at room temperature; instead a bundle of In2O3, was able to detect NO2 concentrations as low as 5 ppb with a response amplitude ΔR/R ≈ 0.2 at room temperature.Reference Zhang, Liu, Li, Tang, Liu, Han, Lei and Zhou97
Hierarchical structures have also been proposed, such as, for example, the three-dimensional WO3 architecture shown in Fig. 9. By means of this particular structure, which mimics the structure of traditional thick films used in the gas-sensing field, composed of a porous layer featuring large pores for gas diffusion and a large number of crystallite interfaces, a response amplitude of ΔR/R ≈ 5 toward 50 ppb of NO2 at the working temperature of 300 °C was obtained.Reference Ponzoni, Comini, Sberveglieri, Zhou, Deng, Xu, Ding and Wang98 The response toward 5 ppb of NO2 can be extrapolated as ΔR/R ≈ 0.3. These values are comparable with the best performances reached by means of thick film technology.Reference Choi, Sakai, Shimanoe and Yamazoe99
Hierarchical tungsten oxide NW architecture: high magnification SEM image (a) and dynamic response to different NO2 concentrations measured at the sensor temperature of 300 °C and in a wet air background [relative humidity (RH) = 30% @ 20 °C] (b). Reprinted with permission from Ref. Reference Ponzoni, Comini, Sberveglieri, Zhou, Deng, Xu, Ding and Wang98. Copyright 2006, American Institute of Physics.
To better tune the sensitivity of MOx NWs toward specific compounds, another widely adopted approach is the dispersion of the catalyst over the NW surface. Such an approach has been traditionally inspired by the field of catalysis and largely exploited in the field of gas sensors with thin and thick films. More recently, these strategies have been further developed to functionalize NWs.
Basically, catalysts can modify the sensitivity of the oxide support by means of two mechanismsReference Xu, Tamaki, Miura and Yamazoe100: chemical and electronic sensitization. In chemical sensitization, the catalyst promotes the dissociation of a given gaseous molecule to an extent much increased with respect to the pristine oxide support, by-products are then spilt-over on the oxide surface, where they can interact modifying the semiconductor conductance.
Within this frame, the dispersion of Pd nanoparticles (that further oxidize to form PdO) has been widely used to modify the sensitivity of MOx gas sensors by means of chemical sensitization.Reference Xu, Tamaki, Miura and Yamazoe100 For example, Kim et al.Reference Kim, Park, Choi, Na, Yang and Kim101 showed that the use of a core–shell composed of In2O3 NWs surrounded by a nanostructured Pd layer improves both the response amplitude and response dynamics toward NO2 with respect to pure In2O3 NWs, with response time decreasing from 235 to 90 s and recovery time decreasing from 420 to 365 s for a gas exposure to 3 ppm.
Similarly, Pd has been used with SnO2 NWs too, showing that Pd-loaded materials exhibited an enhanced response amplitude (ΔR/R = 70) during exposure to 5 ppm of NO2 at the sensor temperature of 250 °C compared with the response of ΔR/R = 30 observed for pure SnO2 NWs.Reference Shaalan, Yamazaki and Kikuta102
Spill-over effect has also been proposed in Ref. Reference Joshi, Hu, Alvi, Joshi and Kumar103 to explain the enhanced performance of ZnO NWs coated with Au nanoparticles toward CO. Au loading increased the response amplitude at high working temperature (200 °C), with functionalized samples showing a response ΔR/R = 15–500 ppm of CO diluted in a dry air background, compared with the value ΔR/R = 8 observed with pure ZnO. Loaded samples featured also room temperature sensitivity (suppressed in pristine ZnO NWs), with a response of ΔR/R = 8–500 ppm of CO in dry air.
In electronic sensitization, the depletion layer created at the catalyst-oxide surface acts as a conductive channel with reduced size and increased sensitivity. Oxidation or reduction of the catalyst strongly modulates its work function and the depth of the depletion layer within the oxide semiconductor, thus increasing its sensitivity. Electronic sensitization has been proposed for explaining the enhanced sensitivity observed with CuO NWs functionalized with SnO2 nanoparticles toward ammonia in dry air.Reference Mashock, Yu, Cui, Mao, Lu and Chen104 The large electronic effect of SnO2 loading was also highlighted measuring the baseline conductance of samples before and after the functionalization process, observing a conductance decrease by a factor 4–5.
Besides inorganic catalysts, organic layers have also been used to enhance the sensitivity of MOxs. For example, effects of coating ZnO NWs with different organic molecules, namely stearic acid, lysine, dodecanedioic acid, mercaptoacetic acid, and perfluorotetradecanoic acid were studied in Ref. Reference Lao, Li, Wong and Wang105. Gas sensor prototypes have been used to sense oxygen at the working temperature of 300 °C. In these conditions, the organic layer was removed/decomposed, but it left oxygen vacancies in the oxide structure that have been proposed to explain the increased sensitivity of NWs treated with organic layers.
The functionalization of ZnO NWs with two organic coatings, dodecanethiol (DT) and tris(hydroxymethyl) aminomethane (THMA), mediated by ZnO nanoparticle loading, has been studied.Reference Waclawik, Chang, Ponzoni, Concina, Zappa, Comini, Motta, Faglia and Sberveglieri24 The working temperature of sensors has been kept at 190 °C to avoid the decomposition of the organic compounds. The functionalization with nanoparticles and THMA enhanced the sensitivity toward NO2.
2. Selectivity
MOxs are sensitive to a broad range of chemicals; so far, working with a single sensor operated under isothermal protocols, it is impossible to reach selectivity. Different strategies have been developed to improve it; the most common ones are the exploitation of temperature profile protocols and the development of an electronic nose. The former uses a single sensor working with a periodically modulated temperature. This protocol is useful to induce/frozen different chemical reactions and exploit the reaction kinetics, which are much more chemically selective than static features.Reference Lee and Reed106,Reference Ponzoni, Depari, Comini, Faglia, Flammini and Sberveglieri107
The latter is a sensing system composed of a sensor array, with sensors featuring different specific sensitivities, and a pattern recognition software handling the collective response of the array.Reference Roeck, Barsan and Weimar108,Reference Gutierrez-Osuna109 To develop electronic noses, a fundamental research topic deals with the development of gas sensors with tuned sensing properties. The working temperature is the first parameter to enhance/suppress the sensitivity toward a given compound with respect to another. Addition of catalysts is another well-established approach to reach this aim, but other strategies have also been adopted. Of particular interest, is the integration of different technologies, such as polycrystalline films or carbon nanotubes, with NWs, to capitalize on their specific sensitivities.
Concerning traditional polycrystalline materials with thin or thick film structures, it is worth noting that response spectra different from that of NWs have been reported even for the same oxide. For example, SnO2 and In2O3 sensors based on NW bundles and thin films have been compared.Reference Ponzoni, Baratto, Bianchi, Comini, Ferroni, Pardo, Vezzoli, Vomiero, Faglia and Sberveglieri110 In both cases (NWs and thin films), SnO2 featured the tetragonal cassiterite structure and In2O3 the bcc structure, but an extensive gas sensing characterization toward different compounds showed that NWs (both SnO2 and In2O3) are more sensitive than their thin film counterparts to compounds such as acetone, dimethyl methyl phosphonate (DMMP), dipropylene glycol methyl ether (DPGME), and acetonitrile, whereas thin films are more sensitive to carbon monoxide and ammonia. These differences have been further exploited to address selectivity in discriminating chemical warfare agents from common chemicals typical of everyday life. In particular, it has been demonstrated that the use of a sensor array composed of both NW and thin film sensors features an increased selectivity with respect to a sensor array composed of thin film sensors only.Reference Ponzoni, Baratto, Bianchi, Comini, Ferroni, Pardo, Vezzoli, Vomiero, Faglia and Sberveglieri110
NWs have also been used together with carbon nanotubes to profit from the different sensing mechanisms of oxides and carbon-based materials to distinguish NO2, ethanol, and H2.Reference Chen, Ishikawa, Chang, Ryu and Zhou111
The density of NWs is another parameter that can be tailored due to the dependence of gas sensitivity on the density of NW–NW interfaces. Such an approach has been used depositing a bundle of NWs with controlled density over the KAMINA platform—a 4 × 8 mm2 substrate with an array of electrodes and a couple of heaters suited to create a temperature gradient along the substrate profile.Reference Sysoev, Goschnick, Schneider, Strelcov and Kolmakov112 The two gradients (temperature and NW density) produce a matrix of microsensors over the substrate featuring different sensitivities and thus selectivity.
Temperature profiles have been mainly used with single NW devices working with self-heated mode, which consists in the use of the electrical current flowing through the NW to warm it by Joule effect.Reference Strelcov, Dmitriev, Button, Cothren, Sysoev and Kolmakov113 Due to the reduced mass of the singleNW, self-heating features very fast thermal kinetics, of the order of a few milliseconds.Reference Prades, Hernández-Ramírez, Fischer, Hoffmann, Müller, López, Mathur and Morante114 By this method, Prades et al. used a squared wave voltage to modulate the temperature of the NW between 25 and 175 °C in an atmosphere with different humidity and CO concentrations in air. A combination of amplitude and dynamic features, the former calculated as the ratio between the measured resistance at the end of hot and cool semiperiods (RHOT/RCOOL), the latter calculated as the time needed by the sensor resistance to change from 10% to 90% of its final stable value, were able to discriminate between CO and humidity (Fig. 10).
(a) Details of the dynamic response of a SnO2 NW operated in pulsed mode exposed to different atmospheres containing CO and increasing amounts of moisture. (b) Summary of the response time τ to different CO-humidity blends. Reprinted with permission from Ref. Reference Prades, Hernández-Ramírez, Fischer, Hoffmann, Müller, López, Mathur and Morante114. Copyright 2010, American Institute of Physics.
3. Stability
Stability is one of the less investigated parameters of gas sensors, despite it is one of the most important, especially for transferring NW technology to the industrial level.
Basically, two types of stability (instability) can be identified: one arising from thermal effects, the other one arising from chemical poisoning induced by exposure to aggressive compounds. The former has been investigated with sensors based on thin and thick films. Grain coarsening phenomena activated by the high working temperature of gas sensors have been identified as one of the source for thermal drifts observed in long time operation.Reference Korotcenkov, Brinzari, Ivanov, Cerneavschi, Rodriguez, Cirera, Cornet and Morante92,Reference Ippolito, Ponzoni, Kalantar-Zadeh, Wlodarski, Comini, Faglia and Sberveglieri93
In this contest, Sysoev et al.Reference Sysoev, Schneider, Goschnick, Kiselev, Habicht, Hahn, Strelcov and Kolmakov115 compared the response to 2-propanol in air exhibited by bundles of NWs and assemblies of nanoparticles. Based on a set of repeated measurements carried out over a period of about 45 days, sintering phenomena were identified to be responsible for the major drift observed with the nanoparticle layer with respect to the NW layer. Indeed, the higher response amplitude exhibited initially by nanoparticles decreased with time until approaching the value of the NW layer (Fig. 11). Working both in dry and wet air conditions, it was shown that such a drift is increased by the presence of humidity.
Thermal stability—comparison between sensors based on nanoparticles (a and c) and based on NW bundles (b and d). (a and b) plots show data acquired during the 1st day, whereas (c and d) plots show data acquired during the 46th day. Reprinted from Ref. Reference Sysoev, Schneider, Goschnick, Kiselev, Habicht, Hahn, Strelcov and Kolmakov115. Copyright 2009, with permission from Elsevier.
Concerning chemical poisoning, it is well known from the field of catalysis that exposure to aggressive gases such as nerve agents and their simulants inhibits with time the capability of the oxide layer to decompose the warfare agent. This has been well documented working with dimethyl methyl phosphonate (DMMP), a simulant of Sarin nerve agent, showing that DMMP decomposition cause the accumulation of phosphorous species over the oxide surface. Catalytic inhibition was observed after exposures to DMMP concentrations of the order of 1000 ppm for periods of some hours, corresponding to the concentration–time product (Ct) of about 105–106 ppm min.Reference Cao, Segal, Suib, Tang and Satyapal116
Concerning NW-based gas sensors, it has been shown that exposure to DMMP decreases with time the NW capability to detect DMMP until reaching a nearly steady-state regime.Reference Comini, Baratto, Concina, Faglia, Falasconi, Ferroni, Galstyan, Gobbi, Ponzoni, Vomiero, Zappa, Sberveglieri and Sberveglieri117 During the first time exposure, bundles of SnO2 NWs revealed the ability to feature a response amplitude ΔG/G ≈ 0.5–50 ppb of DMMP, which is equal to the threshold limit of Sarin nerve agent.Reference Sun and Ong118 Nevertheless, as sensors are further exposed to DMMP, their response capability decreases, until reaching a nearly stable regime characterized by response amplitude ΔG/G ≈ 0.2–200 ppb of DMMP.
Under this working regime, a sensor array composed of both NWs and thin film sensors was able to distinguish chemical warfare agent simulants from common compounds such as ammonia, CO, ethanol, and acetone.Reference Ponzoni, Baratto, Bianchi, Comini, Ferroni, Pardo, Vezzoli, Vomiero, Faglia and Sberveglieri110 Beside such a capability, a statistical analysis of data showed a nonGaussian clustering that has been ascribed to DMMP poisoning effects. It is worth noting that this type of clustering has been observed with response to gases other than DMMP. So far, DMMP effects have been further studied using ethanol as the probe molecule.Reference Sberveglieri, Baratto, Comini, Faglia, Ferroni, Pardo, Ponzoni and Vomiero119 SnO2 sensors based on NW bundles and SnO2 thin films have been first exposed to a sequence of ethanol concentrations, showing the stability of sensor response over repeated gas injections; then sensors have been exposed to a sequence of alternated ethanol and DMMP exposures, showing that response to ethanol decreased with time. This behavior has been ascribed to phosphorous compounds left over the oxide surface by DMMP, which alter the sensitivity of the oxide toward other compounds. It has also been observed that other chemical warfare agent simulants, such as acetonitrile (simulant for cyanide compounds) and DPGME (simulant for blistering gases) did not induce similar effects.Reference Ponzoni, Baratto, Bianchi, Comini, Ferroni, Pardo, Vezzoli, Vomiero, Faglia and Sberveglieri110
B. Optochemical devices
When the transduced quantity is the optical signal, you realize an optochemical device. In dealing with NWs, an optical sensor has the attractive feature that the contacts are not needed, whereas they are quite a challenge for a conductometric sensor.
Three different optical mechanisms of chemosensing involving NWs and nanorods were reported until recently: direct measurements of photoluminescence (PL) of SnO2 and ZnO NWs, transmission through a silica fiber covered with ZnO nanorods, and detection of the chemiluminescence (CL) signal during catalytic oxidation on Al2O3 nanorods. We will describe the pros and cons of each type of optical sensors. A fourth type of optical sensor has been reported,Reference Horvath, Ribic, Hashemi, Forro and Magrez120 but in this case, the NWs were used only as a porous support for impregnation with sensing material.
NWs of ZnO and SnO2 show PL spectra at room temperature [Fig. 12 (left)]. Visible emission in both oxides is usually ascribed to various types of defects (the clear attribution to specific kinds of defects is still debated as discussedReference Faglia, Baratto, Sberveglieri, Zha and Zappettini122,Reference Djurišić, Leung, Tam, Hsu, Ding, Ge, Zhong, Wong, Chan, Tam, Cheah, Kwok and Phillips123 for the two oxides), whereas UV emission for ZnO is assigned to free exciton emission.
(Left) PL spectra of ZnO and SnO2 NWs with excitation at 325 nm; the two spectra were normalized to their maximum intensity. (right) Quenching ratio at room temperature as a function of the NO2 concentration. Reprinted with permission from Ref. Reference Setaro, Bismuto, Lettieri, Maddalena, Comini, Bianchi, Baratto and Sberveglieri121; permission number 3161290952712.
Faglia et al.Reference Faglia, Baratto, Sberveglieri, Zha and Zappettini122 first demonstrated that the visible PL signal of SnO2 NWs was quenched by NO2 at few parts per million concentrations, in a reversible way. The PL signal was little influenced by variation of relative humidity, CO, and NH3, thus giving a sort of selectivity toward NO2. Lettieri et al.Reference Setaro, Bismuto, Lettieri, Maddalena, Comini, Bianchi, Baratto and Sberveglieri121,Reference Lettieri, Bismuto, Maddalena, Baratto, Comini, Faglia, Sberveglieri and Zanotti124 demonstrated that the quenching is observed also at room temperature, PL emission is sensitive to sub-parts per million level concentrations of NO2 and that the quenching effect depends nonlinearly on the quencher concentration [Fig. 12 (right)].
As for SnO2, the PL spectrum of ZnO is quenched by interaction with NO2 in a reversible way at room temperature.Reference Baratto, Todros, Faglia, Comini, Sberveglieri, Lettieri, Santamaria and Maddalena125 UV and visible peaks are quenched in the same manner with no peak shift. PL signal should be related to radiative recombination of surface-localized electrons, and its quenching should be ascribed to charge captured from gas adsorbed onto the surface. Valerini et al.Reference Valerini, Cretì, Caricato, Lomascolo, Rella and Martino126 pointed out that at higher NO2 concentrations, a saturation effect for ZnO NWs is observed: this constitutes a limitation in the use of the optical gas sensor at concentrations higher than 20 ppm.
In this type of sensor, NO2 is adsorbed on the NW surface at room temperature, and the energy needed for desorption from the surface is provided by the same light at 326 nm used for exciting the PL. Thus, the optochemical sensor can be operated at room temperature, whereas in the case of the conductometric sensor, NO2 desorption is typically observed at temperatures higher than 200 °C. By studying the mechanism of PL quenching of SnO2 and ZnO by NO2 adsorption with time-resolved PL, it was observed that the decrease in PL intensity is linearly proportional to the surface density of adsorbed molecules, while the recombination rates are not significantly affected by interaction with NO2.Reference Baratto, Todros, Faglia, Comini, Sberveglieri, Lettieri, Santamaria and Maddalena125,Reference Lettieri, Setaro, Baratto, Comini, Faglia, Sberveglieri and Maddalena127 This suggests that NO2 acts as static quenchers, determining a contraction in the density of states acting as a radiative recombination centers.
Fiber wave optical sensors have been obtained by growing a sensitive layer of nanorods directly on the cladding of an optical fiber. ZnO nanorods prepared by the chemical route are typically used, since this technique ensures low processing temperatures that preserve the fiber properties. Since ZnO is a high-refractive-index material compared to silica fiber, the structure allows fiber-guided light couple into ZnO nanorod covered waveguides. Liu et al.Reference Liu, Zhang, Lei, Song, Chen and Li128 prepared thinned silica fibers covered by ZnO nanorods; ZnO nanorods were chosen since they ensure a high surface to volume ratio as well as optical interaction between the device and the ambient environment.
ZnO nanorods were grown by the hydrothermal method followed by baking at 150 °C. The authors investigated the normalized transmission of 644-nm laser line through the fibers, showing that it decreased monotonically as the humidity increased. The transmission of the hybrid system was measured at different length of nanorods, and the maximum sensitivity was observed for the fiber covered with 5-μm nanorods (see Fig. 13). The mechanisms underlying this sensing process is that the surface properties of ZnO nanorods are modulated by water molecule adsorption at the surface. Increasing the number of water molecules causes an increase in both the refractive index n eff of the surrounding medium and the absorption coefficient of the ZnO nanorod surface, which leads to a larger leakage and absorption of light. The authors calculated that n eff varied from 1.698 to 1.728 when the relative humidity changed from 10% to 95%.
Measured normalized transmission of the 5-μm-diameter bare fiber and the ZnO nanorod-covered fibers in diameters D of 5, 10, and 20 μm as a function of RH changed from 10% to 95%. Reprinted with permission from Ref. Reference Liu, Zhang, Lei, Song, Chen and Li128. Copyright The Optical Society.
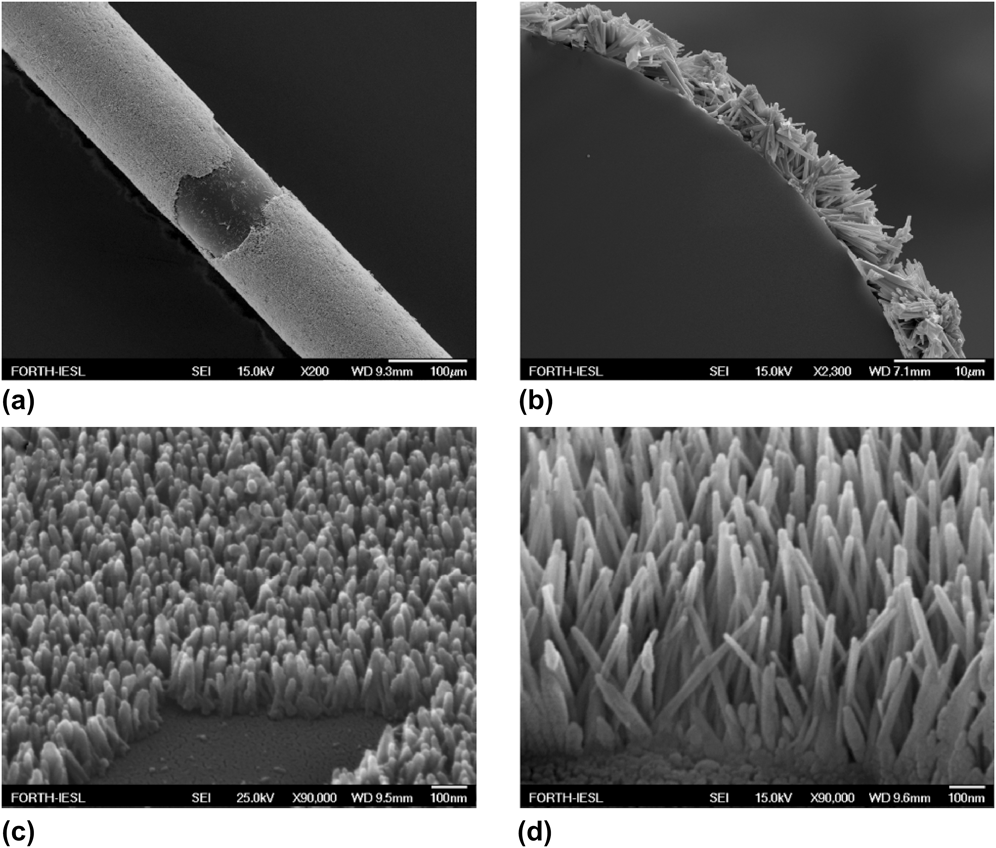
Konstantaki et al.Reference Konstantaki, Klini, Anglos and Pissadakis129 proposed an optochemical sensor for ethanol by growing a ZnO nanorod layer onto the cladding of a long period grating (LPG) fiber using aqueous chemical growth, seeded by a thin layer of metallic Zn (Fig. 14). The authors measured reversible change in the LPG notch strength: it decreased in the presence of 50 Torr of ethanol vapor (saturated vapor). The sensor exhibited temporal response similar to the one of a commercial ethanol probe. Correlation between the growth time of the ZnO layer and ethanol vapor detection performance was investigated.
SEM images of ZnO nanorod layers grown onto the LPG cladding under different views and under different chemical growth durations. (a) General view of ZnO narorod overlaid grating after 3-h immersion in the ACG solution. The fiber has been intentionally scribed for illustrating the ZnO overlayer thickness. (b) Cross section of a ZnO nanorod overlaid LPG; growth conditions as in (a). (c) Close view of ZnO overlayer after 27 min and (d) 58 min of chemical growth. Reprinted with permission from Ref. Reference Konstantaki, Klini, Anglos and Pissadakis129. Copyright The Optical Society.
The detection of PL emission of the ZnO overlayer was simultaneously performed with the optical fiber spectral measurements, revealing significant increase in PL intensity of the band gap peak at 390 nm with ethanol. This is in agreement with results reported by Baratto et al.Reference Baratto, Todros, Faglia, Comini, Sberveglieri, Lettieri, Santamaria and Maddalena125 described before, even if they were performed at much lower ethanol concentrations. After recovery, the sensor did not return to the initial value indicating a slow desorption of ethanol diffused within the rods.
A different type of optical chemosensing is obtained by studying cataluminescence (CTL), that is CL emitted in a course of catalytic oxidation. This phenomenon has been applied to the CTL-based sensors for detecting combustible vapors. Typically this type of sensor was developed in the past using a sintered layer of catalyst material where oxidation reaction takes place.Reference Nakagawa and Yamashita130 The drawback of this type of measurements is that they need a specialized instrument (ultra weak CL analyzer) to detect the low signal coming from CL. Moreover, the phenomenon typically requires high working temperatures. The authors that used this detection method are typically from the Asia region, so the literature is sometimes not readily available in English.
The use of catalysts in the form of NWs was recently applied to detect pinacolyl alcohol in air by a CTL sensor.Reference Yu, Liu, Zuo, Tang and Zhang131 Pinacolyl alcohol is the precursor to Soman, a nerve agent, which is subject to many restrictions in use and production by the organization for the prohibition of chemical weapons. When the pinacolyl alcohol flowed through the quartz tube, the catalytic reaction occurred on the surface of Al2O3 NWs. Al2O3 NWs, prepared by a precipitation method were compared to nanoparticles of the same catalyst, obtaining an increase of more than two times in the signal intensity.
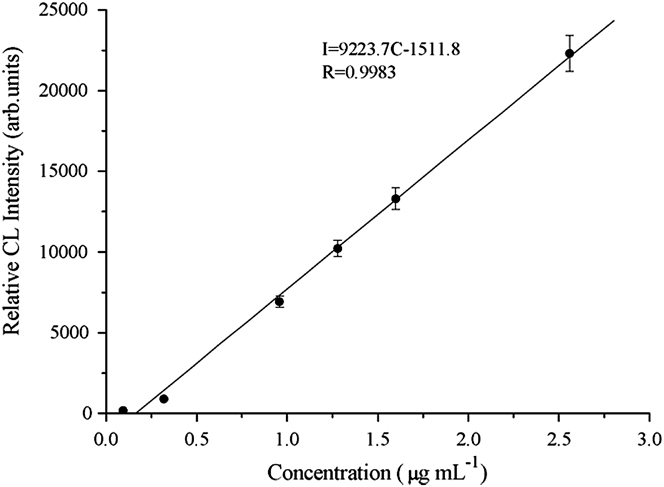
The authors investigated the influence of the sensor temperature, wave length, and flow rate on the CL intensity. They obtained that the calibration curve (Fig. 15) of CTL intensity versus pinacolyl alcohol concentration was linear in the range of 0.09 × 10⁻⁶ to 2.56 × 10⁻⁶ g/mL; the optimum working temperature was 340 °C. Unrelated compounds, including water vapor, ethanol, ammonia, chloroform, benzene, nitrogen dioxide, methylbenzene, hydrochloric acid, methanol, and butanol, which can sometimes interfere with pinacolyl alcohol, were investigated. Although CL emissions were detected for ammonia, benzene, nitrogen dioxide, methylbenzene, methanol, and butanol, the CL intensity is much lower than that of pinacolyl alcohol, so a sort of selectivity was obtained.
The calibration curve of CTL intensity versus pinacolyl alcohol concentration was linear in the range of 0.09 × 10⁻⁶ to 2.56 × 10⁻⁶ g/mL, according to Yu et al. Reprinted with permission from Ref. Reference Yu, Liu, Zuo, Tang and Zhang131. Permission number 3162370246671.
ZrO2 nanorods were prepared using porous biomembranes as templates and compared to nanoparticles as catalysts in CL detection of CO and CH4.Reference Teng, Zhu, He, Gao and Meng132 The nanorod network showed a higher intensity of CO oxidation and a higher combustion activity with CH4 with respect to nanoparticles: this was ascribed to its high surface area, as well as advanced pores; the temperatures of detection was quite high, since CO oxidation is optimized at 400 °C and CH4 combustion at 770 °C for nanorods.
A fourth type of optical sensor is made of titanate NWs impregnated with methylene blue (MB).Reference Horvath, Ribic, Hashemi, Forro and Magrez120 In this case, the sensing material is the MB and the NWs are only a support: the sensing mechanism relies on the reversible dimerization of MB with humidity. A color change is caused by MB dimerization induced by water absortpion and can be detected by absorbance spectroscopy. The thin film of NWs impregnated with MB can also be used to create optical fiber humidity sensors. They fabricated humidity sensor with excellent linearity in the 8–98% humidity range.
C. Biochemical devices
The application of nanomaterials, and in particular of nanostructured semiconductors, as transducers in electrical biosensors is recently arousing great interest. This increasing attention is due to many advantages related both to electrical transduction and to the unique properties of semiconductor nanostructures.
Direct electrical detection is one of the simplest methods in biosensing. Generally, in this type of sensors, a conductance variation is measured between two electrodes, when an occurring molecular event changes the electrical properties of the probes grafted on a transducer between the electrodes. One of the main advantages of electrical transduction is the ease of miniaturization, integration, and interfacing of sensors with macroscopic instruments, together with the possibility of multiplex real-time detection. Moreover, the possibility to avoid analyte labeling is extremely appealing: label-free methods have emerged as a potential way to spare target molecules structural and functional alterations while providing acceptable sensitivity and selectivity.
The nanoscale dimension of the transduction media is crucial, since the binding of the target molecule to the probes grafted on the surface leads to depletion or accumulation of carriers in the bulk of the nanostructure and increases sensitivity in such a way that single-molecule detection might be possible.
Semiconducting NWs can be synthesized with high reproducibility; they are single crystals and thus stable over wide time and temperature ranges. Moreover, they offer a rich chemistry and leave large opportunities for fine-tuning their band structure through controlled doping and compositional variation. The designed sensors are basically transistors where the channel between the source and the drain is the semiconducting wire itself, which is electrically connected by metal contacts at each end. Specific sensing is achieved by linking a probe group to the surface of the NW. When the NW functionalized with such a probe is exposed to a solution containing the target molecules, specific binding will lead to surface charge or conformational variations of the probe, matched with an accumulation or a depletion of charge carriers within the wires. This leads to a change in conductance through the wire and the binding event is registered as a change in the current flowing through the device.
Within this field, many works have been reported, mainly on silicon nanostructures. Lieber et al.Reference Hahm and Lieber133,Reference Patolsky and Lieber134 were able to develop reliable Si NW-based FET devices and to detect biological macromolecules, such as proteinsReference Cui, Wei, Park and Lieber135 and nucleic acids. Moreover, Si NW sensors have been exploited for drug discoveryReference Wang, Chen, Lin, Fang and Lieber136 and virus detection.Reference Patolsky, Zheng, Hayden, Lakadamyali, Zhuang and Lieber137 For most of these experiments, low concentration salt buffer solutions were used to avoid the screening effect associated with solution counter ions.Reference Stern, Wagner, Sigworth, Breaker, Fahmy and Reed138 The charge of target molecules is screened by the counter ions in solution and is effective only on the scale of the Debye length.Reference Stern, Wagner, Sigworth, Breaker, Fahmy and Reed138,Reference Poghossian, Cherstvy, Ingebrandt, Offenhausser and Schoning139 Several research groups recently focused on the importance of the Debye length in this application.Reference Stern, Wagner, Sigworth, Breaker, Fahmy and Reed138,Reference Zhang, Zhang, Chua, Chee, Wong, Agarwal, Buddharaju, Singh, Gao and Balasubramanian140 For DNA sensing, the charge screening can be overcome by immobilizing short DNA strands on the NW surface.Reference Bunimovich, Shin, Yeo, Amori, Kwong and Heath141 DNA optical microarrays have the drawback that by reducing the scale at the nanometer level, to squeeze DNA consumption for probe and target, they produce a sensible contraction of the fluorescence signal and spatial resolution becomes hardly attainable with conventional microscopes. Recently, arrays of sensors based on Si NWs, which allow multiplexed detection of cancer markersReference Zheng, Patolsky, Cui, Wang and Lieber142,Reference Stern, Klemic, Routenberg, Wyrembak, Turner-Evans, Hamilton, LaVan, Fahmy and Reed143 have been proposed.
Despite the high success in developing biotransistors based on single Si NWs, little has been reported in the literature about MOx NWs grafted with biological receptors and their application as transducers in biosensors. Zhou et al.Reference Li, Lei, Zhang, Liu, Han, Tang, Rouhanizadeh, Hsiai and Zhou144,Reference Tang, Liu, Li, Lei, Zhang, Rouhanizadeh, Hsiai and Zhou145 showed how, applying one drop of a suspension, containing LDL cholesterol, to a In2O3-based single NW device, the current increased immediately reaching a new steady-state plateau, together with a negative shift of the threshold voltage. The same groupReference Curreli, Li, Sun, Lei, Gundersen, Thompson and Zhou146 was able to perform antigen/antibody complementary detection of prostate-specific antigen.
The development of NW transistors based on MOxs would produce a breakthrough in the state of the art. As a matter of fact, MOxs are much more reactive than Si due to the presence of surface oxygen vacancies. Besides, the diffusion of metal ions, like K+, Na+, and Ca2+, from analyte solution through the native oxide on the Si surface represents a well known technological issue, not mentioned in publications. In high area conventional structures, Si oxide is encapsulated by nitride, which produces signal degradation. In MOx-based devices, the oxide itself is the channel and a direct charge exchange between the adsorbed biological species and the oxide possibly takes place due to the relative position of conduction/valence bands and LUMO/HOMO energy levels.Reference Stutzmann, Garrido, Eickhoff and Brandt147 Furthermore, the isoelectric point (IEP) of many oxides is quite high (IEP = 9.5 for ZnO, whereas it is between 2 and 2.5 for Si, SiO2, and Si3N4), which makes them suitable for immobilizing proteins with a low IEP, and at the same time, most oxides are to some degree biocompatible.Reference Zhou, Xu and Wang148,Reference Li, Yang, Yu, Bai, Li and Wang149
Only very recently, ZnO single NW-based FETs have been proposed for detection of biomolecularReference Choi, Kim, Jung and Lee150 and uric acid detection.Reference Liu, Lin, Yan, Kang, Zhao, Lei, Li, Du and Zhang151 Wang et al.Reference Yeh, Li and Wang152 introduced a nonsymmetrical Schottky contact at one end of a ZnO NW nanodevice which showed a much-enhanced sensitivity in comparison to ZnO NWs with ohmic contacts and demonstrated that applying a compressive strain, the piezotronic effect on ZnO NW protein sensors can not only increase the resolution of such sensors by tens of times but also largely improve the detection limit and sensitivity.Reference Yu, Pan and Wang153
Another biochemical application of NWs proposes (highly doped) MOxs as innovative electrodes in electrochemical biosensors. Preliminary studies of enzyme immobilization over 1D semiconductor nanostructures have evidenced the improvement ascribed to their high surface and size catalytic role in glucose and uric acid detection.Reference Zhang, Wang, Ai, Sun, Wan, Zhu, Xian, Jin and Yamamoto154–Reference Wei, Sun, Wang, Lei, Cai, Li, Dong and Huang156
IV. CONCLUSIONS AND PERSPECTIVES
We have presented an overview on MOx NW preparation techniques and their integration into chemical sensing devices proposed in the last few years focusing on the research relevant according to the authors.
During the last few years, great efforts have been made to control the growth preparation methods for the preparation of one-dimensional nanostructures. Novel techniques such as thermal oxidation have been proposed and studied for the growth of high quality NWs, a practical and promising alternative approach for mass production of MOx nanostructures with good control of shape, composition, and reproducibility. A crucial point that has been addressed lately is the integration in actual devices.
In the field of gas sensing, MOx NWs have still not fully demonstrated their potentialities. Different strategies used to increase NW functional performances such as sensitivity, selectivity, and stability were reviewed, comparing the obtained achievements with state of the art results obtained with thin and thick film technologies. Higher sensing performances of multiple and hierarchical NW devices have been proved. Furthermore, the use of catalysts has been proposed to promote the dissociation of gas species and create a depletion layer at the catalyst–oxide interface.
Electronic noses, catalysts, and temperature profile protocols have been used to increase selectivity of MOx NW chemical sensors. Specifically, it has been demonstrated that the use of a sensor array composed of both NWs and thin film sensors features an increased selectivity with respect to one with just thin film sensors. Furthermore, the exploitation of the optical transduction mechanism is another possibility to increase selectivity, thanks to the different processes involved. Moreover, the application of NWs as transducers in electrical biosensors has recently aroused great interest due to advantages related to the electrical transduction mechanism and to the unique properties of semiconductor nanostructures.
Stability still remains the less investigated key parameter of chemical sensors and especially NW-based device. Indeed it is crucial for the exploitation of NWs into sensing devices and their commercialization. Further work has to be performed to investigate the performances of NW chemical sensors over long-term operation. Reliable and stable electrical contact preparation still represents a key feature that may prevent the full exploitation of MOx nanostructures in the chemical sensing field. MOx NW chemical sensors still look very promising even if a deeper understanding and further investigations are necessary.
ACKNOWLEDGMENTS
The work has been supported by the Italian MIUR through the FIRB Project RBAP115AYN “Oxides at the nanoscale: multifunctionality and applications.” This work was partially supported by the European Community's 7th Framework Programme, under the grant agreement NMP3-LA-2010-246334 and no. 247768, and the Russian Federation Government, under the State Contract no. 02.527.11.0008, within the collaborative Europe–Russia S3 project. Financial support of the European Commission is therefore gratefully acknowledged. Funding from the European Community's 7th Framework Programme, under the grant agreement no. 295216 is acknowledged.