Implications
Tannins have the potential to interfere with biohydrogenation processes, leading to a higher concentration of unsaturated fatty acids (FAs) in rumen fluid. The goal of this work was to study the effects of different sources of tannins on C18:3 cis9, cis12, cis15 and C18:2 cis9, cis12 content in ruminal bacteria. The study showed that polyphenol compounds could be a means to modulate the accumulation of conjugated linoleic and of vaccenic acid in rumen with the aim of improving the percentage of these FAs in ruminants’ milk and meat.
Introduction
Tannins are phenolic compounds that are chemically classified as hydrolysable (HT) or condensed (CT). The molecular structure of the first group, hydrolysable by acids or enzymes, is characterized by the presence of a core of glucose esterified with gallic and hexahydroxydiphenic acids. Tannins extracted from chestnut (TC) wood (Castanea sativa Miller) are an example of HT. CT are not hydrolysable, and commonly, this class of molecules are referred to as proanthocianidins, polymers of flavon-3-ols or flavon-3,4-diols such as catechin and epicatechin. Tannins extracted from quebracho (TQ; Schinopsis lorentzii) are an example of CT. These two types of polyphenols differ in their nutritional role and toxic effects in livestock nutrition. In vitro and in vivo trials have consistently demonstrated that, in ruminants, CT can improve live weight gain and wool production and reduce the impact of gastrointestinal parasitism, nitrogen pollution from animals grazing lush pasture and methane emission from rumen fermentation (Animut et al., Reference Animut, Puchala, Goetsch, Patra, Sahlu, Varel and Wells2008; Getachew et al., Reference Getachew, Pittroff, Putnam, Dandekar, Goyal and DePeters2008). In contrast, information concerning the rumen degradation of HT and the fate of their metabolites is very limited (Waghorn, Reference Waghorn2008). CT and HT are found in several plants used in ruminant diets. Tannins may interfere with digestive processes by binding dietary protein, by inhibiting the activity of rumen micro-organisms and by reducing the growth of bacterial population (Murdiati et al., Reference Murdiati, McSweeney and Lowry1992; Min et al., Reference Min, Barry, Attwood and McNabb2003). The extent of tannin effects may vary according to differences in the structure and molecular weights of both tannins and dietary proteins (Min et al., Reference Min, Barry, Attwood and McNabb2003). Vasta et al. (Reference Vasta, Makkar, Mele and Priolo2008, Reference Vasta, Mele, Serra, Scerra, Luciano, Lanza and Priolo2009, Reference Vasta, Yáñez-Ruiz, Mele, Serra, Luciano, Lanza, Biondi and Priolo2010) suggested that ruminal biohydrogenation (BH) is affected by CT and that tannins could be a potential means to increase rumenic (RA; C18:2 cis9, trans11) and vaccenic acid (VA; C18:1 trans11) content in food of animal origin. Studies in animal models and in vitro demonstrate that RA has potential anticarcinogenic properties (Benjamin and Spener, Reference Benjamin and Spener2009). Moreover, following a request from the European Commission, on the basis of the scientific data available in literature, the European Food Safety Authority (EFSA) concluded that a cause-and-effect relationship has been established among dietary intake of alpha-linolenic acid (α-LNA), the reduction of blood cholesterol concentration and brain development in humans (EFSA, 2009a and 2009b). Meat and dairy products from ruminants are the main source of VA and RA in human nutrition and in the last decade several efforts have been made in order to develop efficient enrichment strategies of RA and α-LNA in milk and meat. The main strategy to enhance RA and α-LNA content in food is manipulating ruminant feeding and modulating rumen BH in order to obtain meat and milk enriched with these fatty acids (FAs). Several authors suggested that C18 BH intermediates are distributed between solid-associated bacteria (SAB) and liquid-associated bacteria (LAB). In particular, Bessa et al. (Reference Bessa, Maia, Jeronimo, Belo, Cabrita, Dewhurst and Fonseca2009) demonstrated that SAB are characterized by a great proportion of C18 BH intermediates, but the authors did not report the individual C18:1 and conjugated linoleic acid isomers. Moreover, these authors indicated that these FAs are hardly represented in LAB, when rams were fed a diet with high forage level. In contrast, Vlaeminck et al. (Reference Vlaeminck, Fievez, Demeyer and Dewhurst2006a) showed that some BH intermediates, such as C18:1 trans10, were detected in high percentages in LAB, when the content of dietary concentrate is beyond 350 g/kg of dry matter (DM).
As tannins interfere with rumen BH, and as there are few studies on the effects of HT extracted from chestnut in ruminal degradation of feeds, the aim of this trial was to study the role of tannins as a means to increase the rumen production of RA and VA, and to compare the effects of a source of CT (quebracho tannins) with a source of HT (chestnut tannins). For this, changes in the unsaturated FA profile in both SAB and LAB fraction of rumen content were investigated and the extent of BH was deduced through accumulation, increase and decrease of several BH intermediates in SAB and LAB.
Material and methods
Feeds
Dietary treatments involved a control (C) composed of wheat straw (300 g/kg on DM), soyabean meal (132 g/kg DM), maize meal (152 g/kg DM), barley meal (96 g/kg DM), maize gluten feed (300 g/kg DM), vitamin mineral premix (20 g/kg DM) and of four other diets obtained by adding to C, either a chestnut (CE) or a quebracho (QE) tannin extract in two different doses. Quebracho powder (Figli Guido Lapi spa, Castel Franco di Sotto, Pisa, Italy) contains 456 g of tannic acid/kg DM and chestnut powder (Nuova Rivart srl, Radicofani, Siena, Italy) contains 750 g of tannic acid/kg DM. The tannin-supplemented diets were formulated to contain 49 g/kg DM of CE or QE tannins (TC1 or TQ1) and 82 g/kg DM of CE or QE tannins (TC2 or TQ2). The level of the tannins in the diets was determined according to the method of Burns (Reference Burns1963). The control feed was formulated using tannin-free ingredients and according to the results obtained in previous in vivo trials in which this diet was tested (Franci et al.,Reference Franci, Antongiovanni, Acciaioli, Bruni and Martini1997; Antongiovanni, Reference Antongiovanni1998).
Proximate analyses of feed samples
Samples of C were oven dried at 60°C for 24 h. The dry samples were analysed for crude protein (CP), starch, ash and ether extract (EE), according to the 954.01 and 920.39 procedures of AOAC (1990), respectively. Neutral detergent fibre (NDF) was determined using sodium sulphite and heat-stable amylase; acid detergent fibre (ADF) and acid detergent lignin (ADL) were determined in a sequential analysis. All data were expressed inclusive of residual ash (Van Soest et al., Reference Van Soest, Robertson and Lewis1991). Non-protein nitrogen (NPN), soluble protein (SP), acid detergent insoluble protein (ADIP), neutral detergent insoluble protein (NDIP) and non-fibre carbohydrates (NFC) were determined according to Licitra (Reference Licitra1996) and Sniffen et al. (Reference Sniffen, O’ Connor, Van Soest, Fox and Russell1992).
The chemical composition of the control diet was DM, 898 g/kg; CP, 140 g/kg; NPN, 7.80 g/kg; SP, 26.6 g/kg; EE, 15.3 g/kg; NDF, 406 g/kg; ADF, 195 g/kg; ADL, 28.3 g/kg; ADIP, 11.2 g/kg; NDIP, 21.1 g/kg; ash, 63.8 g/kg; NFC, 396 g/kg; and starch, 253 g/kg; all chemical fractions are expressed on the DM basis. The tannin content in the extract powder was determined according to Burns (Reference Burns1963).
Rumen inoculum
Four ewes were used to provide rumen contents, using a rumen fluid sampling pump. Ewes fed the C feed had continuous access to water and mineral blocks. After 4 weeks of adaptation period, about 1 l of rumen contents was collected from each ewe on the same day before the morning meal. The rumen liquor was immediately mixed and transferred to the laboratory in a thermostatic box (39°C). The rumen liquor was then filtered through four layers of cheese cloth into a flask under a flux of CO2, as described by Cone et al. (Reference Cone, Van Gelder, Visscher and Oudshoorn1996). An aliquot of the liquor was buffered (1 : 3, v/v) by adding an artificial saliva solution (McDougall, Reference McDougall1948). Feeds (2 g DM) were incubated in triplicates with 200 ml of inoculum. The incubator consisted of a thermostatic chamber (39°C) equipped with forty-five 300 ml glass fermentation vessels provided with two inlets (one to release gas through a valve and one for the pH probe). Each vessel contained substrate inoculated with rumen fluid, as described above, according to Buccioni et al. (Reference Buccioni, Antongiovanni, Minieri, Rapaccini, Pratesi and Mele2009). Incubation times were 6, 12 and 18 h. After all incubation periods, three vessels per treatment were used for rumen content fractionation and subsequent FA analysis, as described below. pH was monitored continuously.
Both fresh rumen fluid (200 ml), after filtration and addition of buffer (FA composition of the initial inoculum) and samples of total incubated mass (200 g), before the incubation (initial FA profile of rumen fluid inoculated with feeds), were freeze-dried and analysed for FA profile according to Kramer et al. (Reference Kramer, Fellner, Dugan, Sauer, Mossoba and Yurawecz1997) modified by Park et al. (Reference Park, Albright, Cai and Pariza2001), as described below.
Fractionation of rumen contents
The fractionation of rumen contents into LAB and SAB was performed according to Martin et al. (Reference Martin, Williams and Michalet-Doreau1994). The whole content of each vessel (200 g; n = 3 at each time for each treatment) was filtered through four layers of cheese cloth to separate the solid phase from the liquid phase. The solid phase was washed in a flask with 300 ml of Coleman solution (for 1 l of H2O: 6.3 g of K2HPO4; 5.0 g of KH2PO4; 0.65 g of NaCl; 0.9 g of CaCl2·6H2O; 0.9 g of MgSO4·7H2O; 0.5 g of cysteine HCl) and maintained at 39°C under stirring for 5 min. This step was necessary to eliminate residuals of LAB and protozoa. After a filtration through a 100 μm nylon filter, the liquid phase was centrifuged at 1000 × g for 10 min to recover a pellet that was added to the solid obtained previously by the last filtration. Hence, the solid was newly added to the Coleman buffer (cooled at 4°C), homogenized in an ice bath for 3 min (three times for 1 min, to avoid an increase of the temperature inside the sample using an omni-mixer homogenizer (model 17106, International Watherbury, St. Louis, CT, USA) and blended in a stomacher bag (model 400 circulation, PBI, Milano, Italy) to favour the bacterial detachment. The homogenized material was filtered and the residue remaining on the filter was washed again twice with the Coleman solution. All three filtrates were collected and centrifuged at 1000 × g for 10 min at 4°C and the supernatant was ultra-centrifuged at 27 000 × g for 30 min at 4°C. The sediment, containing SAB fraction, was recovered and stored at −80°C in sealed vials, to avoid oxidation, until analysis.
The liquid phase was diluted to 300 ml with the Coleman solution and incubated at 39°C for 1 h, immediately after the first filtration. The surface layer was removed by suction and 300 mg of glucose was added with the aim of favouring the separation of the protozoal fraction. After the solution was centrifuged at 1000 × g at 26°C for 10 min, the supernatant was centrifuged at 15 000 × g at 4°C for 20 min to recover the LAB fraction, which was stored at −80°C in sealed vials, to avoid oxidation, until analysis.
As described by Martin et al. (Reference Martin, Williams and Michalet-Doreau1994) and by Legay-Carmier and Bauchart (Reference Legay-Carmier and Bauchart1989), the extraction procedure described above is not quantitative (the yield is nearly 50%, depending on feed particle size), but the samples extracted can be considered representative of the profile of microbial population. For this reason, FAs of SAB and LAB were expressed relative to the sum of total FAs rather than in absolute values. SAB and LAB samples were freeze-dried before the FA analysis.
FA analysis
To determine the FA profile, each sample (about 140 and 120 mg for SAB and LAB samples, respectively) was methylated using a combination of methods according to Kramer et al. (Reference Kramer, Fellner, Dugan, Sauer, Mossoba and Yurawecz1997) modified by Park et al. (Reference Park, Albright, Cai and Pariza2001). The first step consisted of an alkaline methylation with sodium methylate/methanol (1 ml of 0.5 mol/l sodium methoxide) to esterify glycerides. The second step involved an acid methylation with HCl/methanol (1.5 ml of 5% methanolic HCl, 10 min at 50°C) as catalyst to esterify free FAs. FA methylesters (FAME) were extracted using n-hexane, with C19:0 methyl ester (Sigma Chemical Co., St. Louis, MO, USA) as an internal standard for quantification. FAME were separated and identified by gas chromatography (GC) according to Buccioni et al. (Reference Buccioni, Rapaccini, Antongiovanni, Minieri, Conte and Mele2010). FAME were separated on a GC equipped with a capillary column (CP-select CB for FAME Varian, Middelburg, the Netherlands: 100 m × 0.25 mm i.d.; film thickness 0.20 μm). The injector and flame ionization detector temperatures were 270°C and 300°C, respectively. The programmed temperature was 40°C for 4 min, increased to 120°C at a rate of 10°C/min, maintained at 120°C for 1 min, increased to 180°C at a rate of 5°C/min, maintained at 180°C for 18 min, increased to 200°C at a rate of 2°C/min, maintained at 200°C for 1 min, increased to 230°C at a rate of 2°C/min and maintained at this last temperature for 19 min. The split ratio was 1 : 100 and helium was the carrier gas with a flux of 1 ml/min. Standard mix (47792 Supelco, Chemical Co., St. Louis, MO, USA) and published isomeric profiles (Destaillas et al., Reference Destaillas, Trottier, Galvez and Angers2005) were used to identify the conjugated linolenic acid isomers (CLNA; C18:3 cis9, trans11, cis15). Two bacterial acid methyl ester mix (47080-U Supelco, Chemical Co., St. Louis, MO, USA; GLC110, Matreya, Pleasant Gap, PA, USA) and individual standard for methyl ester of iso C14:0, anteiso C14:0, iso C15:0 and anteiso C17:0 (21-1211-11, 21-1210-11, 21-1312-11 and 21-1415-11; Larodan, Malmo, Sweden) were used to identify branched FA profile. Inter- and intra-assay coefficients of variation were calculated by using a reference standard butter (CRM 164; Community Boureau of Reference, Bruxelles, Belgium) and detection threshold of FA was 0.01 g/100 g of FAs. All FA composition results are expressed as g/100 g of FAs.
Statistical analysis
Data were processed by General Linear Model of Statistical Analysis System (SAS Institute, 1999) using the following linear model with fixed factors including diet and incubation time as well as their interaction:

where yij is the observation; μ is the overall mean; Di is the diet (i = 1 to 5); Tj is the incubation time (j = 1 to 3); Di × Tj is the interaction between diet and incubation time; and eij is the residual error. For the sake of simplicity, only one level of probability (P < 0.05) was adopted for the significance of differences between means.
Results
pH and FA composition of rumen blank
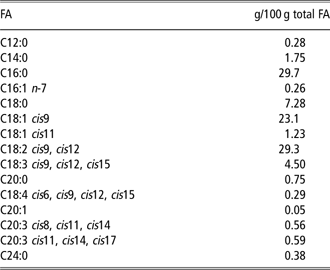
During the fermentation, pH was constantly monitored. The values did not vary for the whole period of fermentation among the fermenters containing different feeds (6.74 ± 0.2, pH units), indicating an optimal buffering power of the artificial saliva solution of McDougall (Reference McDougall1948). The fat content of rumen liquor blank was very low (0.01 mg/ml), as a consequence of the procedure adopted for the preparation of the inoculum; hence, the initial contribution of rumen liquor to FA composition of inoculum was negligible. The non-incubated samples did not differ in FA profile, which is not surprising as the kind or amount of tannins were the sole differences between feeds. The FA profile of C is shown in Table 1.
FA profile of the control feed inoculated with rumen fluid (g/100g of total FAs)
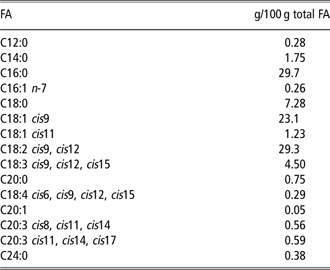
FA = fatty acid.
FA profile of SAB
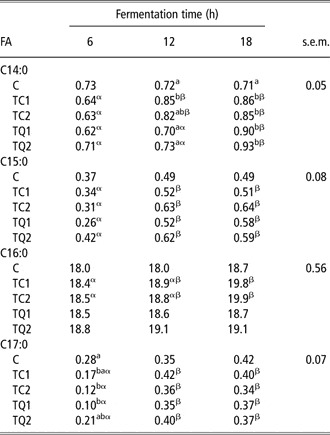
The content of C14:0 in SAB was enhanced (about 30%) by adding in the fermenter CE and QE, whereas no differences were found in C16:0 content among fermenters at each time of fermentation. Similar to C16:0, C15:0 (any time) and C17:0 (after 12 h) content also did not differ among fermenters during fermentation (Table 2).
Even and odd medium-chain fatty acids (g/100 g total FAs) in SAB present in rumen liquor at different fermentation times (n = 3)

FA = fatty acid; SAB = solid-associated bacteria; C = controlled diet; TC = tannins from chestnut; TQ = tannins from quebracho.
Within a column, means with different Latin superscripts are significantly different (P < 0.05); within a row, means with different Greek superscripts are significantly different (P < 0.05).
The percentages of the branched FAs found in SAB at different fermentation times are shown in Table 3. The addition of tannins induced changes in the iso FA profile from SAB, regardless of the concentration and the type of tannin used. In fact, although C15:0 iso (about 30%) and C16:0 iso (about 34% for TQ2 and 100% for the other three tannin feeds) increased (at 12 h) in the fermenters containing the feeds supplemented with CE and QE, the percentage of C14:0 iso remained lower in all fermenters containing the tannin-treated feeds (P < 0.05) after 12 h of fermentation (Table 3). The content of C17:0 iso was affected not only by the type but also by the concentration of tannins in the feed. The percentages of C15:0 anteiso and C17:0 anteiso in SAB generally increased between 6 and 12 h, but at 18 h, when tannins were added at 82 g/kg DM (TC2 and TQ2), the percentage of these two branched FAs was lower than that at 12 h (for C15:0 anteiso about 22% in TC2 and 27% in TQ2; for C17:0 anteiso about 30% in both diets) as described in Table 3.
Branched medium-chain FAs (g/100 g total FAs) in SAB present in rumen liquor at different fermentation times (n = 3)

FA = fatty acid; SAB = solid-associated bacteria; C = controlled diet; TC = tannins from chestnut; TQ = tannins from quebracho.
Within a column, means with different Latin superscripts are significantly different (P < 0.05); within a row, means with different Greek superscripts are significantly different (P < 0.05).
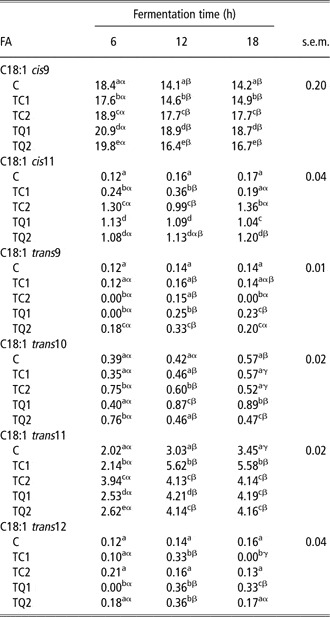
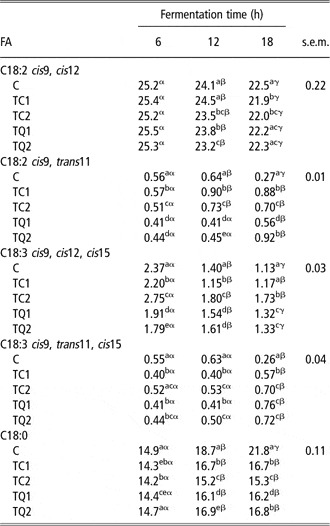
Considering C18:1 isomers, the C18:1 cis9 (oleic acid, OA) content decreased within the first 12 h (Table 4) in all fermenters: about 23% for C, 17% for TC1, 6% for TC2, 10% for TQ1 and 17% for TQ2. In SAB from the fermenters containing tannins, VA concentration increased during the first 12 h of fermentation, regardless of the tannin concentration (about 33% for C, 62% for TC1, 5% for TC2, 40% for TQ1, 37% TQ2). Afterwards, treatments did not induce change in SAB percentage of this FA. In contrast, during the whole fermentation period of C feed, VA content of SAB increased at each sampling time (about 41% from 6 to 18 h). The highest value of VA concentration in SAB was reached with the TC1 (Table 4). SAB from C and from the diets with the lower concentrations of CE and QE were characterized by a progressive increase of C18:1 trans10 during the whole fermentation period (about 31% for C, 38% for TC1, 55% for TQ1 from 6 to 18 h), whereas SAB from TC2 and TQ2 diets showed the highest values of this FA at 6 h. Linoleic acid (LA; C18:2 cis9, cis12) and linolenic acid (α-LNA; C18:3 cis9, cis12, cis15) concentrations in SAB progressively decreased during fermentation (more than 10% and 40% for LA and α-LNA, respectively), regardless the kind of diet (Table 5).
C18:1 FAs (g/100 g total FAs) in SAB present in rumen liquor at different fermentation times (n = 3)

FA = fatty acid; SAB = solid-associated bacteria; C = controlled diet; TC = tannins from chestnut; TQ = tannins from quebracho.
Within a column, means with different Latin superscripts are significantly different (P < 0.05); within a row, means with different Greek superscripts are significantly different (P < 0.05).
Linolenic and linoleic acid isomers and stearic acid (g/100 g total FAs) in SAB present in rumen liquor at different fermentation times (n = 3)

FA = fatty acid; SAB = solid-associated bacteria; C = controlled diet; TC = tannins from chestnut; TQ = tannins from quebracho.
Within a column, means with different Latin superscripts are significantly different (P < 0.05); within a row, means with different Greek superscripts are significantly different (P < 0.05).
In SAB on C, RA content increased between 6 and 12 h (about 12%), but at 18 h the percentage of this FA was only half of that at 6 h (P < 0.05). In contrast, tannins induced an accumulation of RA throughout the incubation period, but different trends were depending on the type of tannin. In fact, RA percentage increased between 6 and 12 h in SAB from TC1 and TC2 (about 37% and 30%, respectively), whereas the concentration of this FA increased between 12 and 18 h in SAB from TQ1 and TQ2 (about 27% and 51%, respectively). The trend of CLNA from C was similar to that of RA. In the presence of tannins, CLNA accumulated and reached the highest concentration after 18 h (Table 5). Stearic acid (SA; C18:0) content in SAB increased during the incubation of diet C, reaching the highest value after 18 h. When supplementing tannins, the SA percentage increased within 12 h and subsequently remained unchanged independent of the concentration or type of tannins. At the end of incubation, the amount of SA in SAB from tannin feeds was significantly lower (about 25%) than that in SAB from C (Table 5).
FA profile of LAB
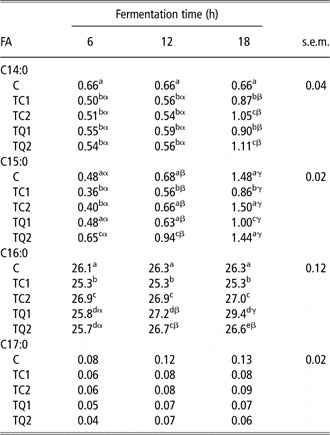
Tannins induced a significant increase of C14:0 content in LAB between 12 and 18 h of incubation (about 36% for TC1, 48% for TC2, 34% for TQ1, 49% for TQ2), regardless of the concentration and the type of tannins, whereas the percentage of this FA did not change in LAB during incubation with C substrate. In all cases, C15:0 significantly increased during incubation in LAB, whereas C16:0 percentage only increased in LAB to which TQ1 (about 12%) and TQ2 (about 3%) were supplemented. In any case, C17:0 remained unchanged (Table 6).
Even and odd medium-chain fatty acids (g/100 g total FAs) in LAB present in rumen liquor at different fermentation times (n = 3)

FA = fatty acid; LAB = liquid-associated bacteria; C = controlled diet; TC = tannins from chestnut; TQ = tannins from quebracho.
Within a column, means with different Latin superscripts are significantly different (P < 0.05); within a row, means with different Greek superscripts are significantly different (P < 0.05).
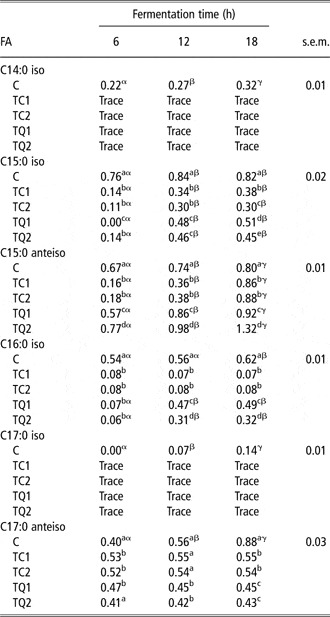
In contrast, the inclusion of tannins depressed the iso FAs content in LAB, and in particular, C14:0 iso and C17:0 iso of which only traces were detected (Table 7). Moreover, C15:0 iso and C16:0 iso contents were decreased by the addition of tannins, especially with CE starting from 12 h (P < 0.05), whereas C15:0 anteiso increased in all fermenters over the incubation times (about 16% for C, 81% for TC1, 79% for TC2, 38% for TQ1, 41% for TQ2). C17:0 anteiso remained unchanged in the fermenters containing tannin extracts CE and QE.
Branched-chain FAs (g/100 g total fatty acids) in LAB present in rumen liquor at different fermentation times (n = 3)

FA = fatty acid; LAB = liquid-associated bacteria; C = controlled diet; TC = tannins from chestnut; TQ = tannins from quebracho.
Within a column, means with different Latin superscripts are significantly different (P < 0.05); within a row, means with different Greek superscripts are significantly different (P < 0.05).
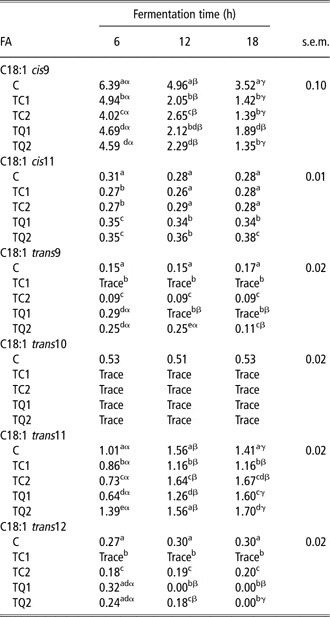
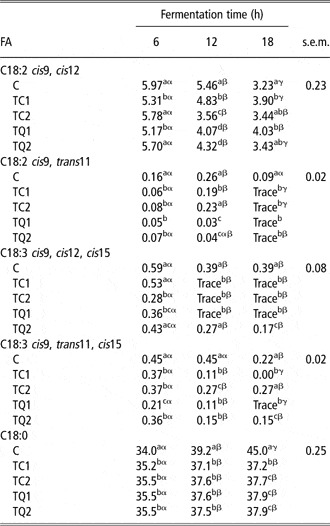
With regard to FAs (Tables 8 and 9) involved in rumen BH, a significant decrease was observed with incubation time in OA, LA, LNA and CLNA in LAB from all diets. RA accumulated in LAB from C, TC1 and TC2 between 6 and 12 h of fermentation (about 38%, 68% and 65%, respectively) and subsequently, fell to trace levels. Among trans FAs (TFA), VA reached the highest concentration at 12 h in LAB from C, TC1 and TC2, whereas in LAB from TQ1 and TQ2 the highest concentration was observed in the samples drawn at 18 h. The C18:1 trans10 was detected only in LAB from C and its concentration did not vary during incubation. When CE tannins were added to C, C18:1 trans9 and C18:1 trans12 accumulated in LAB at a lower extent, compared with LAB from C or TQ1 and TQ2 (Table 8). Similar to what was observed for SAB, SA accumulated in LAB from C during the whole incubation time. The inclusion of tannins lowered the concentration of SA in LAB, compared with the SA content extracted from the LAB present in rumen liquor inoculated with C. Moreover, SA concentration in LAB coming from the fermenters containing tannins accumulated only in the first 12 h of incubation and subsequently the level of SA remained unchanged (Table 9).
C18:1 FAs (g/100 g total FAs) in LAB present in rumen liquor at different fermentation times (n = 3)

FA = fatty acid; LAB = liquid-associated bacteria; C = controlled diet; TC = tannins from chestnut; TQ = tannins from quebracho.
Within a column, means with different Latin superscripts are significantly different (P < 0.05); within a row, means with different Greek superscripts are significantly different (P < 0.05).
Linolenic and linoleic acids isomers and stearic acid (g/100 g total FAs) in LAB present in rumen liquor at different fermentation times (n = 3)

FA = fatty acid; LAB = liquid-associated bacteria; C = controlled diet; TC = tannins from chestnut; TQ = tannins from quebracho.
Within a column, means with different Latin superscripts are significantly different (P < 0.05); within a row, means with different Greek superscripts are significantly different (P < 0.05).
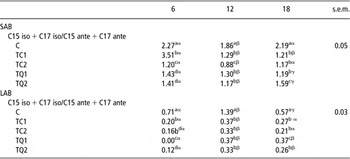
Finally, in Table 10, data related to the ratio of iso and anteiso odd chain FAs (C15 iso + C17 iso/C15 ante + C17 ante; IAR) showed higher values for C than for tannin-enriched feeds either in SAB or LAB, with the exception of TC1 at 6 h for SAB.
Iso and anteiso odd-chain FAs ratio (g/100g FAs) in SAB and LAB (n = 3)

FA = fatty acid; SAB = solid-associated bacteria; LAB = liquid-associated bacteria; C = controlled diet; TC = tannins from chestnut; TQ = tannins from quebracho.
Within a column, means with different Latin superscripts are significantly different (P < 0.05); within a row, means with different Greek superscripts are significantly different (P < 0.05).
Discussion
The potential effects of tannins on rumen microflora are influenced by the molecular structure of these polyphenols (Min et al., Reference Min, Barry, Attwood and McNabb2003; Vasta et al., Reference Vasta, Makkar, Mele and Priolo2008 and Reference Vasta, Mele, Serra, Scerra, Luciano, Lanza and Priolo2009). Hence, when the present study was planned, two different sources of tannins were selected: chestnut as a source of HT and quebracho as a source of CT. These sources were chosen because widely used in the Mediterranean area as additive in small ruminant diets (Vasta et al., Reference Vasta, Mele, Serra, Scerra, Luciano, Lanza and Priolo2009).
The percentages and the type of tannins used in this trial did not alter the pH value of rumen liquor, buffered with McDougall solution (McDougall, Reference McDougall1948). Nevertheless, the effect of tannins on FA composition of bacterial cells was studied less than the reaction between tannins and feed proteins; it is probable that the pH value plays an important role to determine the optimal condition so that the tannins bind to bacterial cell (Min et al., Reference Min, Barry, Attwood and McNabb2003). It is well known that tannin–protein complexes are formed at pH values close to neutrality (Jones and Mangan, Reference Jones and Mangan1977). On the other hand, microbial metabolism of FA is pH dependent; for example, a higher production of C18:1 trans11 and RA has been reported when the rumen pH is above 6.0 (Martin and Jenkins, Reference Martin and Jenkins2002). Therefore, the pH values recorded in this study fell in the optimal pH range in order to evaluate the effects of CE and QE on rumen BH through accumulation of BH intermediates in rumen bacteria.
The overall FA profile of SAB and LAB confirmed what has been reported by Bessa et al. (Reference Bessa, Maia, Jeronimo, Belo, Cabrita, Dewhurst and Fonseca2009) and by Vlaeminck et al. (Reference Vlaeminck, Fievez, Cabrita, Fonseca and Dewhurst2006b). Compared with LAB, in fact, SAB are characterized by a higher proportion of FAs that are intermediate products of rumen BH, confirming that bacteria involved in rumen BH mainly belong to the SAB fraction (Bessa et al., Reference Bessa, Maia, Jeronimo, Belo, Cabrita, Dewhurst and Fonseca2009). However, Vlaeminck et al. (Reference Vlaeminck, Fievez, Demeyer and Dewhurst2006a) also demonstrated that the FA profile of LAB was characterized by the presence of BH products as C18:1 trans10, originated by an alternative BH pathway of LA and α-LNA (Griinari and Bauman, Reference Griinari and Bauman1999; Destaillas et al., Reference Destaillas, Trottier, Galvez and Angers2005). In our samples, the FA profile of LAB showed the presence of C18:1 trans10 only in trace amount when tannins were supplemented to diet C, although the percentage of concentrate was high (trans10 C18 FAs are favoured by the presence of concentrate in the diet). Perhaps, LAB are more sensitive to tannins than SAB or the solubility of TQ and CE induced an easier interference with LAB than with SAB based on the bacterial FA profile. The first step of BH of LA to RA did not seem to differ among feeds and a decreasing trend was observed for LA content in both SAB and LAB fractions. In contrast, several differences in BH intermediates of α-LNA when supplementing tannins were observed in the SAB fraction, especially at 6 h of incubation. The presence of chestnut tannin at the highest level seemed to retard the BH of this FA during the whole incubation. In vivo studies are needed to asses whether the chestnut tannin addition to the diet may be considered as a promising strategy to improve the α-LNA percentage in food from ruminants. Following a request from the European Commission, on the bases of the scientific data available in literature, the EFSA concluded that a cause–effect relationship was established among dietary intake of α-LNA, the reduction of blood cholesterol concentration and brain development in humans (EFSA, 2009a and 2009b).
Further, VA and RA accumulated to a higher extent in the SAB fraction from fermenters containing tannin than in the SAB from the C diet. SA content was higher in SAB from C than in SAB fractionated from fermenters containing tannin feeds, which suggests that the last step of BH (the reduction of VA to SA) was influenced by tannin supplementation (Table 5). Former studies suggested that tannins are able to partially inhibit the last step of rumen BH, by decreasing the activity of ruminal micro-organisms and by changing the ruminal microbial composition (Min et al., Reference Min, Barry, Attwood and McNabb2003; Vasta et al., Reference Vasta, Makkar, Mele and Priolo2008 and Reference Vasta, Yáñez-Ruiz, Mele, Serra, Luciano, Lanza, Biondi and Priolo2010). Tannins are able to inhibit the growth of ruminal micro-organisms (Murdiati et al., Reference Murdiati, McSweeney and Lowry1992), including cellulolytic micro-organisms, which are involved in the BH processes and in the saturation of VA to SA (Vasta et al., Reference Vasta, Yáñez-Ruiz, Mele, Serra, Luciano, Lanza, Biondi and Priolo2010). Tannin–bacteria interactions seem very strong and tannins, probably, are associated with the bacterial cell surface formation, which might limit the adhesion of extra-cellular enzymes to feed particle surfaces (Bento et al., Reference Bento, Acamovick and Makkar2005). On the basis of the data obtained in the present study, VA accumulation in the SAB from tannin-supplemented diets could be explained by a specific interaction between tannins and the bacteria involved in the last step of the BH process. Whether this interaction indeed occurs and either influences bacterial growth or inhibits cellular reductase enzymes needs further investigation. However, a recent in vivo study based on the effect of QE tannins on ruminal BH in lambs reported that the Butyrivibrio proteoclasticus population (a strain able to saturate VA to SA) was significantly decreased by tannin addition in the diet, whereas Butyrivibrio fibrisolvens (a strain involved in the first part of BH) and protozoa populations increased (Vasta et al., Reference Vasta, Yáñez-Ruiz, Mele, Serra, Luciano, Lanza, Biondi and Priolo2010). The accumulation of RA in SAB from fermenters containing tannin feeds suggested that the linoleic acid isomerase activity (LA-I) was not affected by tannin addition. This result agrees with those reported by Vasta et al. (Reference Vasta, Makkar, Mele and Priolo2008), who showed that LA-I was unaffected by the inclusion of tannins during rumen in vitro incubations. In order to explain the RA accumulation through CE and QE after 12 and 18 h of incubation, respectively, the role of VA accumulation should be considered, inducing a negative feedback effect on the previous step of BH. Nevertheless, this phenomenon should be confirmed by measuring the reductase enzyme activity. Despite VA accumulation in the SAB in fermenters containing tannin feeds, SA content increased during the first 12 h of incubation (Table 5), suggesting that other C18:1 isomers besides VA could be involved in the SA accumulation. Interestingly, the OA reduction in SAB, obtained from fermenters containing tannin feeds, occurred mainly within the first 12 h of incubation (Table 4). The BH of OA, therefore, seemed to be less affected by tannin addition, suggesting a weaker interaction between microbial cis9 reductase enzyme and tannins or a lower sensitivity of micro-organisms involved in the OA reduction.
Changes in the composition or in the activity of SAB as a consequence of tannin addition can be suggested also from the odd and branched chain FA (OBCFA) profile of SAB. Studies of Vlaeminck et al. (Reference Vlaeminck, Fievez Van Laar and Demeyer2006a, Reference Vlaeminck, Fievez, Demeyer and Dewhurst2006b and Reference Vlaeminck, Fievez Van Laar and Demeyer2004) suggested that changes in OBCFA pattern are related to changes in microbial population and that an increased proportion of cellulolytic bacteria would result in a high iso FA content, whereas an increased proportion of amylolytic bacteria possibly increases anteiso and particularly linear odd chain acids. Hence, OBCFA may be a potential diagnostic tools of rumen function, especially when the IAR is considered (Vlaeminck et al., Reference Vlaeminck, Fievez, Demeyer and Dewhurst2006a). IAR values were higher in rumen liquor incubated with C (Table 10) than those from tannin-enriched feeds, both in SAB or in LAB, suggesting that bacterial composition was perturbed by the presence of tannins. In particular, changes in IAR of SAB fraction should suggest that cellulolytic microbial populations were affected by tannins, which is in agreement with data reported by Vasta et al. (Reference Vasta, Yáñez-Ruiz, Mele, Serra, Luciano, Lanza, Biondi and Priolo2010). These authors, in fact, found that the ruminal content from lambs fed a concentrate with or without tannins did not differ in the total number of bacteria but in species distribution, characterized by a lower percentage of Butyrivibrio proteoclasticus (−30.6%; P < 0.1) in the rumen liquor of lambs fed the tannin-supplemented diet.
This phenomenon could explain the decreasing extent of BH, assuming that the cellulosolitic bacteria are mainly responsible for the BH (Bessa et al., Reference Bessa, Maia, Jeronimo, Belo, Cabrita, Dewhurst and Fonseca2009).
With regard to the effect of the tannin source on BH, only marginal differences were found between CE and QE, regardless the concentration of tannins in the diet. As a consequence, in the concentration range adopted in the present study, the effects of tannins on rumen BH seemed to be independent of the amount of CT or HT.
Conclusion
In conclusion, in this in vitro study tannins seem to change FA composition of SAB and LAB, which also could suggest an effect on rumen BH. Particularly, an accumulation of RA and VA was observed, probably as a consequence of a lower reduction of VA to SA. No difference was observed in the BH of OA in response to tannin addition. The fractionation of rumen micro-organisms showed higher amounts of BH intermediates in SAB than in LAB, whereas the LAB fraction is characterized by a high amount of SA. In the concentration range adopted in this study, the effect of tannins from CE and QE on FA in SAB and LAB was similar.
Acknowledgements
The work has been realized by the financial support of the PRIN Project 2007 – prot. 200778K3KJ – ‘Effects of tannins of some ruminant feeds on the rumen degradability of protein and fibre fractions on the biohydrogenation of lipids and on the quality of milk and meat’, from the Ministry of University and Research (MiUR) and by the financial support of the Ente Cassa di Risparmio di Firenze, Italy. Special thanks to Nuova Rivart srl, Radicofani, Siena, Italy, for technical assistance.