Introduction
Tympanic membrane perforation causes a sound conduction disturbance, and the size of this conduction disturbance is proportional to the perforation area. However, precise evaluation of perforation size is difficult, and there are few detailed reports which address this issue. Furthermore, such evaluation becomes more difficult for irregularly shaped perforations.
This study conducted a quantitative evaluation of tympanic membrane perforations, using image analysis equipment.
Patients and methods
We evaluated 24 cases of traumatic tympanic membrane perforation treated at the department of otolaryngology and head and neck surgery, Kurume University Hospital, and at Matsuda ENT clinic, between April 1999 and February 2008. We also evaluated 29 cases of chronic otitis media treated with a type I tympanoplasty at the department of otolaryngology and head and neck surgery, Kurume University Hospital, from 2003 and 2007.
Patients with traumatic perforation were assessed by pure tone audiometry and tympanic fibrescopy. They were treated conservatively, and all were restored to the same hearing level as the healthy side after treatment. Patients with extensive clots, haematotympanum or infection were excluded from this study.
Patients with chronic suppurative otitis media (chronic otitis media as follows) were also assessed by pure tone audiometry and tympanic fibrescopy. Patients who exhibited otorrhoea on first consultation or who accumulated a tympanic effusion were excluded from this study.
After tympanic fibrescopy, the tympanic membrane perforations were classified by shape, location, quantity and interference with the malleus (i.e. malleolar perforation). Traumatic perforation shapes were classified as circular (including oval), irregular or spindle-shaped. Chronic otitis media perforation shapes were classified as circular (including oval) and irregular. Perforation location was classified according to the four quadrants of the tympanic membrane. The perforation area was measured using image analysis equipment (WinROOF version 5.5 software, Mitani Corporation, Tokyo, Japan). The perforation size was expressed as the proportional perforation area rate (= (perforation area/pars tensa area) × 100).
Hearing evaluation was classified by frequency. The following parameters were calculated: the mean air conduction over seven frequencies (from 125 to 4000 Hz); mean air conduction at low range frequencies (= (125 + 250 Hz)/2); and mean air conduction at high range frequencies (= (4000 + 8000 Hz)/2). In addition, air conduction hearing for the healthy side was compared with that for the diseased side in traumatic perforation patients, and pre-operative air conduction hearing was compared with post-operative values in chronic otitis media patients. The correlation between these values and the proportional perforation area rate was determined. Furthermore, in order to examine the effect of the perforation area on the degree of conduction disturbance, the conduction disturbance index was determined (= mean air conduction/proportional perforation area rate). The calculated conduction disturbance indices were evaluated by perforation shape, location, number and malleolar interference.
Pearson's correlation coefficient was used to assess correlations, Welch's t-test was used to measure significant differences, and a level of p < 0.05 was considered to be significant.
Results
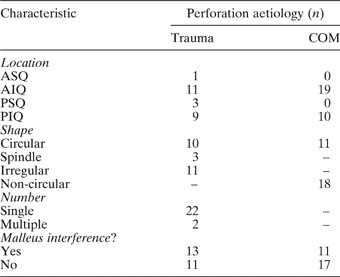
The characteristics of the patients and their perforations are summarised in Table I. Only one patient had a traumatic perforation located in the anteroinferior quadrant; therefore, this case was excluded from the data analysis.
Characteristics of patients' perforations, by cause

COM = chronic otitis media; ASQ = anterosuperior quadrant; AIQ = anteroinferior quadrant; PSQ = posterosuperior quadrant; PIQ = posteroinferior quadrant
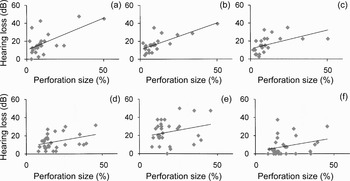
The larger the area of a traumatic perforation, the greater the conduction disturbance. The correlation between perforation area and air conduction hearing disturbance was significant at each frequency range tested, but was strongest for mean air conduction averaged over seven frequencies. A stronger correlation was observed between perforation area and low range conduction disturbance, compared with high range conduction disturbance.
However, no significant correlation was found between proportional perforation area rate and conduction disturbance associated with chronic otitis media (Figure 1).
Relation between tympanic membrane perforation size and conductive hearing loss. Traumatic perforations: (a) seven-frequency mean air conduction (AC) (correlation coefficient = 0.74; p < 0.001); (b) low range mean AC (correlation coefficient = 0.62; p < 0.01) and (c) high range mean AC (correlation coefficient = 0.51; p < 0.05). Chronic otitis media perforations: (d) seven-frequency mean AC (correlation coefficient = 0.35; p = not significant (NS)); (e) low range mean AC (correlation coefficient = 0.25; p = NS); and (f) high range mean AC (correlation coefficient = 0.13; p = NS).

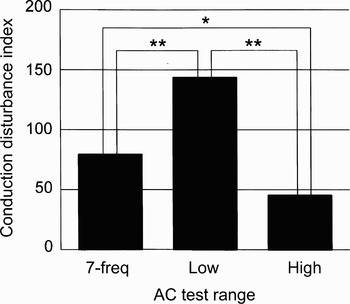
The conduction disturbance index were calculated for the seven-frequency mean, the low range mean and the high range mean air conduction. In patients with chronic otitis media associated perforation, the conduction disturbance indices for the three air conduction frequency ranges tested differed significantly, with the conduction disturbance index for low range mean air conduction being significantly greater (Figure 2). In patients with traumatic perforation, however, there were no significant differences between these three conduction disturbance indices.
Relation between air conduction (AC) test frequency (freq) range (see text for details) and conductive disturbance index in patients with tympanic membrane perforation due to chronic otitis media. *p < 0.05; **p < 0.001.

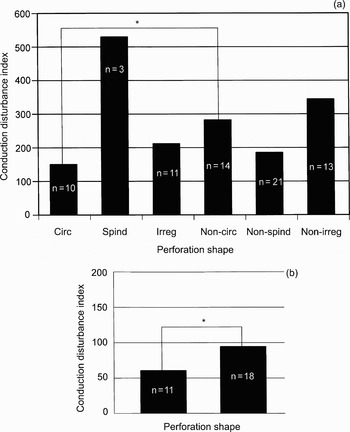
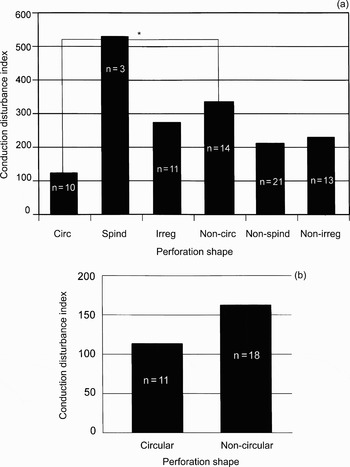
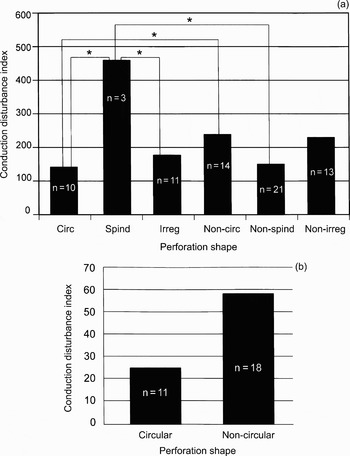
The association between the conduction disturbance index and the perforation shape is shown in Figures 3 to 5. The conduction disturbance indices were smaller for circular perforations compared with non-circular perforations, for all three air conduction means. The conduction disturbance indices were greater for spindle-shaped perforations, compared with all other groups, for all three air conduction means; in particular, the high range conduction disturbance index was significantly larger compared with low range and 7 frequency mean. In perforations associated with chronic otitis media, the seven-frequency conduction disturbance index was significantly lower for circular perforations compared with non-circular perforations.
Relation between tympanic membrane perforation shape and conduction disturbance index for air conduction test mean over seven frequencies (see text for details). (a) Traumatic perforations (mean conduction disturbance indices for various perforation shapes were: circular (circ), 153.5; spindle-shaped (spind), 533.8; irregular (irreg), 211.6; non-circ, 280.6; non-spind, 183.9; and non-irreg, 241.2). (b) Chronic otitis media perforations (mean conduction disturbance indices for various perforation shapes were: circular, 58.9; non-circular, 91.6). *p < 0.05.

Relation between tympanic membrane perforation shape and conduction disturbance index for air conduction test mean over low range frequencies (see text for details). (a) Traumatic perforations (Mean conduction disturbance indices for various perforation shapes were: circular (circ), 128.4; spindle-shaped (spind), 537.7; irregular (irreg), 278.7; non-circ, 334.2; non-spind, 207.1; and non-irreg, 222.8). *p < 0.05. (b) Chronic otitis media perforations (Mean conduction disturbance indices for various perforation shapes were: circular, 119.2; non-circular, 161.1).

Relation between tympanic membrane perforation shape and conduction disturbance index for air conduction test mean over high range frequencies (see text for details). (a) Traumatic perforations (Mean conduction disturbance indices for various perforation shapes were: circular (circ), 147.1; spindle-shaped (spind), 461.1; irregular (irreg), 175.9; non-circ, 237.0; non-spind, 162.2; and non-irreg, 219.6). *p < 0.05. (b) Chronic otitis media perforations (Mean conduction disturbance indices for various perforation shapes were: circular, 25.5; non-circular, 58.0).

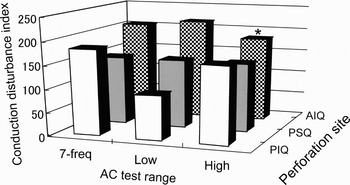
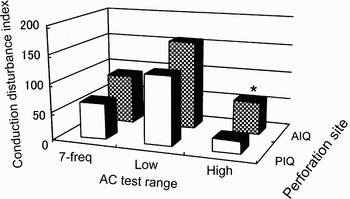
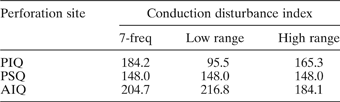
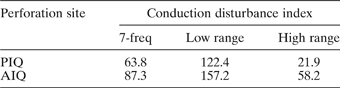
The association between conduction disturbance index and perforation location is shown in Figures 6 and 7 and Tables II and III. The high range conduction disturbance index was significantly greater for anteroinferior quadrant perforations, compared with perforations elsewhere, for both traumatic and chronic otitis media perforations.
Relation between tympanic membrane perforation site, conduction disturbance index and air conduction (AC) test frequency (freq) range (see text for details), for traumatic perforations. *p < 0.05. PIQ = posteroinferior quadrant (n = 9); PSQ = posterosuperior quadrant (n = 3); AIQ = anteroinferior quadrant (n = 11).

Relation between tympanic membrane perforation site, conduction disturbance index and air conduction (AC) test frequency (freq) range (see text for details), for chronic otitis media perforations. *p < 0.05. PIQ = posteroinferior quadrant (n = 10); AIQ = anteroinferior quadrant (n = 19).

CDI by perforation site: traumatic perforations
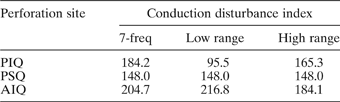
CDI = conduction disturbance index; 7-freq = air conduction (AC) test mean at seven frequencies (see text for details); low range = AC test mean in low frequency range; high range = AC test mean in high frequency range; PIQ = posteroinferior quadrant; PSQ = posterosuperior quadrant; AIQ = anteroinferior quadrant
CDI by perforation site: COM perforations
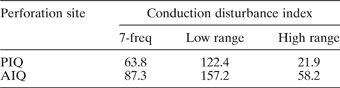
CDI = conduction disturbance index; COM = chronic otitis media; 7-freq = air conduction (AC) test mean at seven frequencies (see text for details); low range = AC test mean in low frequency range; high range = AC test mean in high frequency range; PIQ = posteroinferior quadrant; AIQ = anteroinferior quadrant
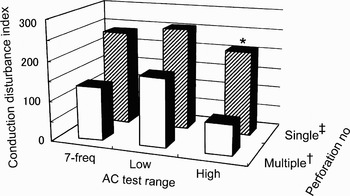
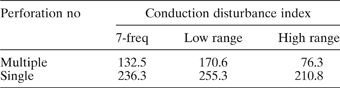
The association between conduction disturbance index and number of traumatic perforations is shown in Figure 8 and Table IV. The high range conduction disturbance index was significantly smaller for multiple perforations.
Relation between number of tympanic membrane perforations, conduction disturbance index and air conduction (AC) test frequency (freq) range (see text for details), for traumatic perforations. *p < 0.01. †n = 2; ‡n = 22. No = number.

CDI by perforation number: traumatic perforations
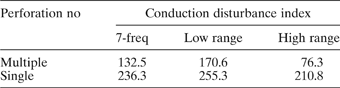
CDI = conduction disturbance index; no = number; 7-freq = air conduction (AC) test mean at seven frequencies (see text for details); low range = AC test mean in low frequency range; high range = AC test mean in high frequency range
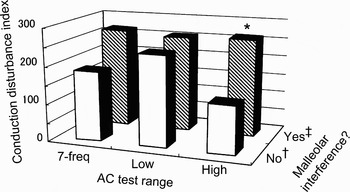
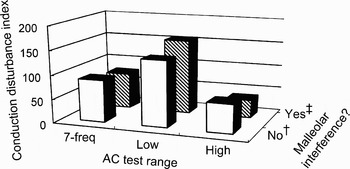
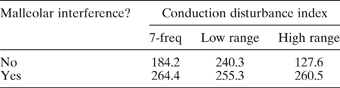
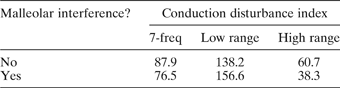
The association between conduction disturbance index and malleolar perforation is shown in Figures 9 and 10 and Tables V and VI. For traumatic perforations, the low range conduction disturbance index showed little difference, but the high range conduction disturbance index was significantly greater, compared with perforations without malleolar interference. In contrast, in chronic otitis media associated perforations, no difference in the conduction disturbance index was seen, comparing perforations with and without malleolar interference.
Relation between presence of malleolar interference, conduction disturbance index and air conduction (AC) test frequency (freq) range (see text for details), for traumatic tympanic membrane perforations. *p < 0.01. †n = 11; ‡n = 13.

Relation between presence of malleolar interference, conduction disturbance index and air conduction (AC) test frequency (freq) range (see text for details), for tympanic membrane perforations due to chronic otitis media. †n = 17; ‡n = 12.

CDI by presence of malleolar interference: traumatic perforations
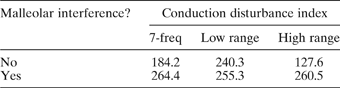
CDI = conduction disturbance index; 7-freq = air conduction (AC) test mean at seven frequencies (see text for details); low range = AC test mean in low frequency range; high range = AC test mean in high frequency range
CDI by presence of malleolar interference: COM perforations
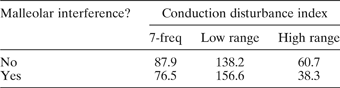
CDI = conduction disturbance index; COM = chronic otitis media; 7-freq = air conduction (AC) test mean at seven frequencies (see text for details); low range = AC test mean in low frequency range; high range = AC test mean in high frequency range
Discussion
Many reports have described the effects of tympanic membrane perforation on sound conduction; however, acoustic evaluations are difficult to conduct in animal models. On the other hand, quantitative evaluation of human tympanic membrane perforation area is difficult, and the establishment of a perforation model is impossible. In this study, continuous quantitation of tympanic membrane proportional perforation area rate was made possible by the use of image analysis equipment. The study compared the effects of traumatic perforation with those of perforation associated with chronic suppurative otitis media.
In the sound transmission of traumatic perforation, though we could not exclude the effect of small amounts of clots or a little inflammatory change, but we could exclude the effect of tympanic membrane hyperplasty and mobility disorder of the ossicles due to long-term inflammatory changes which exist in the chronic otitis media. Therefore, traumatic perforation and chronic otitis media were compared in order to analyse the effect of perforation and inflammatory change on sound transmission. In addition, the air–bone gap (ABG) was used to evaluate the degree of conductive hearing loss usually. However, patients with no ABG are actually rare even in the traumatic perforation. A conduction disturbance is present before the injury. Therefore, we defined the difference between air conduction at the injured side versus the healthy side as the criteria of the conduction disturbance in this study.
Bhusal et al. classified tympanic membrane perforation size into four categories: A, less than 10 per cent; B, 10–20 per cent; C, 20–40 per cent; and D, more than 40 per cent.Reference Bhusal, Guragain and Shrivastav1 Mehta et al. classified perforation into three grades, using the point of a pick under an operating microscope.Reference Mehta, Rosowski, Voss, O'Neil and Merchant2 Ahmad et al. measured perforation diameter using a tape with a 0.5 mm scale, and classified perforations according to the system of Bhusal et al. Reference Ahmad and Ramani3 Berger et al. classified the perforation area as great or small and the perforation site according to the four quadrants, based on a sketch of the tympanic membrane findings.Reference Berger, Finkelstein, Avraham and Himmelfarb4 Griffin classified perforation area as grades I to IV, with each ensuing grade representing a 25 per cent increase.Reference Griffin5 Yoshikawa et al. classified perforation size by the four quadrants,Reference Yoshikawa, Takimoto, Ishigami and Yamada6 and this is the classification system currently used in Japan; however, accurate evaluation of correlations with other findings is problematic with this system, which does not lend itself to quantitative evaluation.
In the current study, perforation size was determined using image analysis equipment, enabling quantitative evaluation. In addition, perforation shape was classified as circular, spindle-shaped or irregular, to enable more accurate comparison of perforation size. Many studies have reported that conduction disturbance worsens as perforation size increases.Reference Bhusal, Guragain and Shrivastav1, Reference Mehta, Rosowski, Voss, O'Neil and Merchant2, Reference Berger, Finkelstein, Avraham and Himmelfarb4–Reference Funai and Funasaka16 In the current study, a strong correlation was found between conduction disturbance and proportional perforation area rate. Similar results were obtained in those past reports. In addition, many studies have reported that, following tympanic membrane perforation, maximal hearing loss occurs in the lower frequency range, and that the conduction disturbance lessens as the sound frequency is elevated.Reference Mehta, Rosowski, Voss, O'Neil and Merchant2, Reference Ahmad and Ramani3, Reference Bigelow, Swanson and Saunders9, Reference Pyne and Githler10, Reference Voss, Rosowski, Merchant and Peake14–Reference Funai and Funasaka16 In contrast, some studies of tympanic membrane perforation have found that hearing loss does not depend on sound frequency.Reference Wada, Koike, Matsutani, Kobayashi and Takasaka11, Reference Tonndorf, MaArdle and Kruger17
In the current study, the proportional perforation area rate associated with traumatic tympanic membrane perforation was more strongly correlation with low range conduction disturbance than with high range disturbance; however, there was no significant difference between the high range and the low range conduction disturbance indices. On the other hand, no significant correlation was observed between the conduction disturbance index and the perforation area in cases associated with chronic otitis media. In chronic otitis media associated tympanic membrane perforation, the conduction disturbance index was found to be significantly greater in the low range frequencies. In other words, when an eardrum is perforated, the loss in sound conduction is proportional to the perforation area, and the conduction disturbance is worse in the low frequency range.
Conduction disturbance in the low frequency range increases when inflammatory change occurs in the middle ear. In such cases, tympanic compliance may decrease due to tympanic hypertrophy or sclerotic change of the ossicles, and this may cause conduction disturbance in the low frequency range. Even in cases of clear traumatic perforation of the tympanic membrane, it is clinically difficult to determine whether the observed conduction disturbance is due only to the perforation.
The literature contains studies examining the fundamental conductive functions of the human eardrum and middle ear. Voss et al. measured the delivery of sound pressure to the stapes and oval window, using fresh human temporal bones, and introduced a perforation (using an argon laser) in order to evaluate the effect on hearing loss.Reference Voss, Rosowski, Merchant and Peake13–Reference Voss, Rosowski, Merchant and Peake15 In this experiment, hearing loss increased as sound frequency decreased, and was greatest at the lowest audible frequencies. Tonndorf et al. used a feline model of posterosuperior quadrant perforation, and reported that sound pressure increased at a rate of 10.2 or 12 dB/oct at frequencies of 1 or 1.6 kHz or less.Reference Tonndorf, MaArdle and Kruger17, Reference McArdle and Tonndorf18 Funai et al. measured acoustic features of the tympanic membrane both proximal and medial to an anterior tympanic membrane perforation; they found that: (1) the conduction disturbance became severe in the low frequency range, and (2) following delivery of a sound wave directly into the middle ear via the perforation, the sound pressure both proximal and medial to the tympanic membrane perforation had an effect on the conduction disturbance at low range frequencies.Reference Funai, Funasaka and Ushijima8 Wada et al. analysed the behaviour of the middle ear using a finite element method.Reference Wada, Koike, Matsutani, Kobayashi and Takasaka11 They found that, in the presence of an anterior perforation, the vibration amplitude of the stapes decreased in the low frequency domain because of alteration of the tympanic vibration mode. As a result, conduction disturbance was maximised and the decrease of sound pressure in the cochlea was maximised. Therefore, the conduction disturbance resulting from tympanic membrane perforation is associated with a change of amplitude and vibration mode in the auditory ossicles, as well as a change in tympanic vibration. Hence, such conduction disturbance increases in the lower frequency range. However, it is difficult to evaluate quantitatively the effect of tympanic membrane perforation on the behaviour of the ossicles and on the sound pressure delivered to the inner ear, and further research is required.
There are no previous reports on the effect of tympanic membrane perforation shape on sound transmission. The results of the present study suggest that a circular proportional perforation has a lesser effect on tympanic membrane vibration, compared with differently shaped perforations, for both traumatic and chronic otitis media associated perforations; circular perforations may also have a different effect on ossicular vibration amplitude and/or vibration mode. In contrast, spindle-shaped traumatic perforations resulted in greater conduction disturbance indices for seven-frequency, low range and high range mean air conduction, suggesting increased conduction disturbance; a significantly greater high range conduction disturbance index difference was noted in particular. It is thought that spindle-shaped perforations are created by indirect forces; all such cases in the present study were thus caused. Yamamoto et al. reported that the human tympanic membrane has 2.4 times more strength when stretched parallel to its radial fibres, compared with stretching at right angles to the radial fibres.Reference Yamamoto, Ishii and Machida19 A tympanic membrane which is traumatically ruptured via indirect force normally demonstrates a slit-shaped perforation running parallel to the radial fibres. The spindle-shaped perforations in the present study were small in size but had a comparatively large gap between the minor axis and the longer axis. Though, the greatest diameter of the tympanic membrane proportional perforation was not examined in this study, the maximal diameter and interference to the malleus may have a greater effect on conduction disturbance.
A large degree of conduction disturbance was associated with perforations involving the malleus, as assessed for the seven-frequency and low range air conduction means and particularly significantly for the high range air conduction mean. Ahmad and Ramani have stated that hearing loss is worse when interference to the malleus is combined with a tympanic membrane perforation area of greater than 10 per cent.Reference Ahmad and Ramani3 Funai and Funasaka have reported that, in cases of malleolar perforation, audiometric hearing loss worsens at frequencies higher than 2 kHz.Reference Funai and Funasaka16 Vibration of the tympanic membrane causes vibration of the malleus, but the malleus is tightly connected only with a part of the umbo and the malleolar lateral process.Reference Graham, Reams and Perkins20 Therefore, vibration of the malleus tip plays a major role in the sound conduction mechanism. Separation of the vibration occurs at the high frequency range. Tonndorf et al. have reported that when the vibration of the tympanic membrane is divided, the effect of tympanic membrane vibration on malleolar vibration decreases and the malleus begins to vibrate directly in response to the sound wave entering the middle ear.Reference Tonndorf and Khanna21 Therefore, malleolar perforation may directly influence the mobility of the malleus. On the other hand, in cases of tympanic membrane perforation associated with chronic otitis media, the present study found no significant difference in conduction disturbance, comparing cases with and without malleolar interference. In other words, we believe that, in such cases, other inflammatory changes had a larger influence on conduction disturbance than that caused by malleolar interference.
Hearing loss increases with perforation of the anteroinferior quadrant, compared with other quadrants. This is believed to be due to the sound wave in the cochlea being offset by the direct entry of sound from the oval window, a theory widely known as the phase-cancellation effect.Reference Schuknecht22 However, when Voss et al. measured the sound pressure delivered to the stapes and oval window, using fresh human temporal bones and introducing an argon laser perforation to evaluate the effect of perforation on hearing loss, they found no significant difference in the hearing loss associated with various perforation locations, and the changes in the middle-ear capacity made a clinical difference of conductive hearing loss.Reference Voss, Rosowski, Merchant and Peake13–Reference Voss, Rosowski, Merchant and Peake15 Funai reported that audiometric hearing loss in the low frequency range was greater in patients with a large anterior perforation, compared with a large posterior perforation.Reference Funai and Funasaka16 In this study, the high range conduction disturbance index was significantly greater in anterior perforations, compared with perforations of other quadrants, for both traumatic and chronic otitis media perforations. In addition, the low range conduction disturbance index was greater in anteroinferior quadrant perforations, compared with perforations of other quadrants, for both traumatic and chronic otitis media perforations, although this difference was not significant. The current study could not determine the overall effect of tympanic membrane perforation on conduction disturbance, because the effect of middle-ear capacity was not addressed. However, based on our current findings, we believe it appropriate to reconsider the assumption that hearing loss is proportionally greater for perforations in the anteroinferior quadrant.
In the current study, only two patients had multiple perforations, so the statistical significance of this finding could not be determined. However, conduction disturbance in these patients was less at high frequencies. Maeta had stated that peak vibration in the normal human tympanic membrane occurs in both the anterior and posterior parts at less than 2000 Hz, in the posterior part at around 3000 Hz, and in multisectional regions at more than 4000 Hz.Reference Maeta23 Koike et al. reported that the peak point of vibration in the posterior part of the tympanic membrane moves downward as the frequency increases, and that at more than 4000 Hz the peak becomes multisectional.Reference Koike, Wada and Kobayashi24 These reports suggest that, in cases of multiple tympanic membrane perforation, the effect of each perforation on the conduction disturbance becomes smaller at high frequencies, because the tympanic membrane has multisectional vibrating points at high frequencies. In addition, in cases of multiple perforations, the vibrating points remain at high frequency. Therefore, multiple perforations may result in less conduction disturbance at high frequencies.
The current study was limited by the small number of patients. Further research is required concerning tympanic pneumatisation, tympanic capacity and the behaviour of the ossicles. However, this study established a method for the evaluation of tympanic membrane perforations and conduction disturbances.
Conclusion
A simple, easy method of quantitative evaluation of tympanic membrane perforations was established, using image analysis equipment.
Perforation of the tympanic membrane has a larger effect at lower frequencies. Inflammatory changes in addition to tympanic membrane perforation make the resulting conduction disturbance significantly worse in the low frequency range. Circular perforations had a significantly reduced effect on conduction disturbance, compared with differently shaped perforations.
Spindle-shaped traumatic perforations had a greater effect on conduction disturbance, compared with differently shaped perforations, and this effect was especially significant at high frequencies. The effect of anteroinferior quadrant perforations on high range conduction disturbance was significantly greater, compared with the high range effect of perforations in other locations. Multiple traumatic perforations caused significantly less conduction disturbance in the high frequency range. Traumatic perforation involving malleolar interference caused more conduction disturbance, and this effect was significant in the high frequency range.