Implications
The results of this study indicate that the Ile requirement may be considerably lower than what is frequently assumed for diets typically used for growing pigs. Our recommendation of ensuring a ratio of at least 50% standardized ileal digestible Ile : Lys may still be a somewhat high proposition. A lower Ile requirement allows further reducing the CP concentration in the diet, thereby limiting nitrogen excretion. The lower requirement also questions whether Ile is actually the seventh-limiting amino acid (AA) for growth in pigs. Other AA such as Leu or His may be limiting for growth before Ile.
Introduction
Improving the amino acid (AA) profile of dietary protein allows reducing the CP concentration in the diet while ensuring that the AA requirements of the animal are met. Improving the AA profile will increase the efficiency of nitrogen utilization, thereby reducing nitrogen excretion. The current availability of the (crystalline) AA l-Lys, dl-Met, l-Thr, l-Trp and l-Val allows formulating low-protein diets where these AA (plus Cys) are co-limiting at the same time, up to a point where a seventh AA becomes co-limiting. The extent to which the protein concentration in pig diets can be reduced depends on the constraints used in feed formulation that ensure a minimum concentration of the different AA. Accurate and reliable information about the requirements for potentially limiting AA is therefore crucial. There is now consensus that Val is limiting performance before Ile for most diets fed to growing pigs (Lordelo et al., Reference Lordelo, Gaspar, Le Bellego and Freire2008; Nørgaard and Fernández, Reference Nørgaard and Fernández2009; Barea et al., Reference Barea, Brossard, Le Floc'h, Primot, Melchior and van Milgen2009b). Although the earliest reports date back to the 1950s, knowledge of the Ile requirement is limited and not always consistent. The Ile requirement may be affected by the use of blood products as a protein source in the experiments (Dean et al., Reference Dean, Southern, Kerr and Bidner2005) and differences in Ile requirement may be related to an imbalanced supply of branched-chain AA or large neutral AA. The objective of this study was to compile and analyze reported Ile dose–response experiments to quantify the Ile requirement for growth in growing pigs and to identify the sources of variation in the requirement.
Material and methods
Data collection
A database was constructed using information from experiments studying the response of growing pigs to increasing concentrations of Ile in the diet. Experiments were published between 1950 and 2010 as peer-reviewed journal articles or as abstracts or technical articles for which detailed information concerning the design of the experiment could be obtained. Only those dose–response experiments were included where a basal diet was supplemented with l-Ile or dl-Ile and in which at least four levels of Ile were used (e.g. a basal diet plus three diets with different levels of l-Ile supplementation). In addition, the ingredient composition of the basal diet had to be reported to be retained in the database. Experiments should at least report average daily gain (ADG) and average daily feed intake (ADFI) as response criteria.
The reporting of the Ile concentration in the diet varies between experiments (e.g. total Ile, apparent ileal digestible Ile, standardized ileal digestible (SID) Ile, on a g/kg basis or relative to Lys) and both analyzed and calculated values are reported. To minimize bias between experiments, the nutrient composition of all diets was recalculated using the reported feed ingredient composition and table values of nutritional values (Sauvant et al., Reference Sauvant, Perez and Tran2004). For each AA, the ‘most likely’ AA concentration was determined using information in the following order of priority:
-
(i) the analyzed AA concentration reported in the publication,
-
(ii) the analyzed CP concentration reported in the publication combined with the AA-to-protein ratio calculated from the feed ingredients (Sauvant et al., Reference Sauvant, Perez and Tran2004),
-
(iii) the AA concentration calculated from the feed ingredients (Sauvant et al., Reference Sauvant, Perez and Tran2004).
All values were expressed on an SID basis using digestibility values calculated from the feed ingredients (Sauvant et al., Reference Sauvant, Perez and Tran2004). In some older experiments, dl-isomers of AA were used, including dl-isoleucine. As the efficiency of converting the d-isomer into the l-isomer varies between AA, different efficiency values were used for dl-isomers (i.e. 100% for dl-Met, dl-Trp and dl-Phe; 75% for dl-Val; 50% for dl-Lys and dl-Thr; and 40% for dl-Ile; Lewis and Baker, Reference Lewis and Baker1995).
Data treatment
Because of differences in experimental design, there was a wide range in magnitudes of Ile supply and response criteria. To account for this, we standardized the meta-design in two directions. The independent variable (Ile concentration) was expressed relative to the SID Ile requirement estimate of the National Research Council (NRC, 1998) so that a value of 100% corresponded to the NRC requirement estimate. For experiments in which the Ile requirement was determined as a fraction in the diet, the average BW during the experimental period was used as the reference point, which was then compared with the requirement according to the NRC (1998). For experiments that reported the Ile requirement relative to Lys, the Ile concentration was expressed relative to the requirement estimate of 55% SID Ile : Lys (NRC, 1998). The dependent variables (i.e. ADFI or ADG) were expressed relative to the response observed at the highest level of Ile supplementation within an experiment.
To interpret Ile requirements appropriately, it is important to identify the second-limiting factor after Ile in an experiment. If the requirement is expressed as a fraction in the diet, feed intake or growth potential should be second-limiting for performance. However, if the Ile requirement is expressed relative to Lys, the latter should be second-limiting (Boisen, Reference Boisen2003). If the authors reported the Ile requirement as an Ile : Lys ratio, we assumed that Lys was actually the second-limiting factor. Nevertheless, we compared the Lys concentration in these diets by the Lys requirement reported by the NRC (1998). A relative Lys concentration greater than 100% indicates that the Lys concentration was greater than the NRC (1998) requirement estimate. The same procedure was used to verify whether other AA could have been second-limiting. For all diets, the ratios between essential AA and Lys were determined on an SID basis. These values were then multiplied by the relative Lys concentration or by one (whichever was greater) and divided by the ideal AA : Lys ratio for each AA (i.e. 30% for Met, 60% for Met + Cys, 19% for Trp, 65% for Thr, 50% for Phe, 95% for Phe + Tyr, 100% for Leu, 70% for Val, 32% for His and 42% for Arg). If the resulting value was smaller than 100% for any of these AA, this AA could be limiting for performance. The degree to which Lys or another AA may have been limiting for performance is given in Supplementary material 1 and 2.
Modeling the response to the Ile concentration
To estimate the Ile requirement for each experiment, a two-step procedure was used. First, a linear regression analysis for each experiment was performed to verify whether there was a response to the increasing Ile concentration. Experiments were then classified into two groups on the basis of the outcome of this analysis. The first group included experiments for which there was little or no response to the increasing Ile concentration. This included experiments where the ratio between the minimum and maximum response criterion was greater than 90% or those for which there was no indication for a response to the increasing Ile concentration (P > 0.25). The second group included experiments for which the P-value of the response to the increasing Ile concentration was smaller than 0.25. Using a lower, more conventional P-value for the classification would eliminate a larger number of experiments. This was not done because the statistical power of the test was low because of the limited number of observations in many experiments. Experiments of the first group are given in Supplementary material 1 and those of the second group in Supplementary material 2.
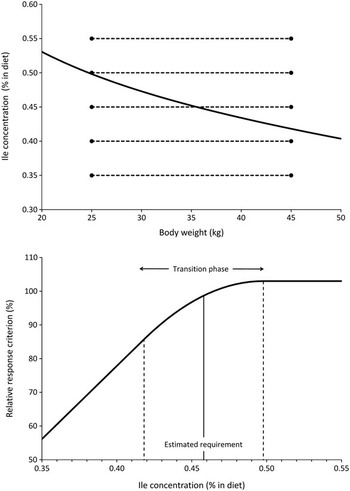
Experiments of the second group were analyzed further using a nonlinear regression procedure. We modified the classical broken-stick (or linear-plateau) model into a bent-stick model. The reason for this is that Ile may have been limiting for performance during the early phase of the experiment, but not at the end of the experiment because the AA requirement as a fraction in the diet declines when the animal grows (NRC, 1998; Boisen, Reference Boisen2003). The bent-stick model is based on two line segments that are connected by a quadratic function, resulting in a smooth transition between both line segments (Figure 1). The transition phase depends on the change in the Ile requirement during the experimental period, which was calculated from the anticipated change in Ile requirement between the initial and final BW according to the NRC (1998). The values for this anticipated change for the different experiments are given in Supplementary material 1 and 2. A value of 0% indicates that there is no decline in the requirement during the experimental period and the model then converges to the broken-stick model. The Ile requirement was defined as the midpoint of the transition period, which corresponds approximately to the requirement that would be estimated by the broken-stick model. The reason for choosing the midpoint is that the NRC (1998) requirement estimate is based on experiments that mainly used the broken-stick model in the analysis. Because of the transition phase, the midpoint corresponds to a situation where Ile is limiting for performance during the first half of the experimental period. A higher Ile concentration would be required to ensure that Ile would not be limiting throughout the experimental period (see Supplementary material 3 for the mathematical description of the model).
Effect of the duration of an experiment to estimate the Ile requirement on model choice. In the upper panel, the change in the Ile requirement estimated by the NRC (1998) is given by the solid line. The five dashed lines represent levels of Ile that are used in a dose–response experiment to determine the Ile requirement between 25 and 45 kg BW. If the broken-stick model is assumed to be correct to describe the response of the animal at a given BW, a bent-stick model will describe the response of the animal over the range of BW (lower panel). The duration of the transition phase is determined by the change in Ile requirement during the experimental period. In this paper, the requirement was estimated as the midpoint of the transition phase.

The relative Ile concentration (compared with the NRC requirement estimate) was used as independent variable, whereas the relative ADFI and ADG (compared with the response at the highest Ile concentration) were used as dependent variables. The ADFI was only considered if animals were offered feed ad libitum. The anticipated change in Ile requirement during the experimental period was used as a constant in the model. For each experiment, the Ile requirement and the plateau value of the bent-stick model were estimated, whereas the slope of the ascending line segment was assumed common for all experiments. The decision to estimate a slope common to all experiments was taken to avoid possible over-parameterization of the model because of the limited number of observations for each dose–response experiment. The NLIN procedure of SAS (2000) was used to estimate the model parameters.
Results and discussion
Data selection and data standardization
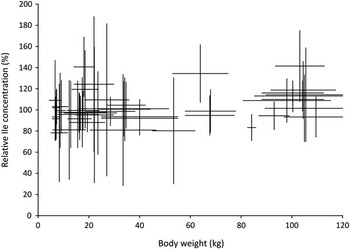
A total of 46 dose–response experiments were identified that matched our selection criteria (i.e. supplementation with dl-Ile or l-Ile, at least four levels of Ile and ADG and ADFI as response criteria). The experiments originated from 22 different reports and covered, to our knowledge, all available information concerning the Ile requirement in growing pigs. Only 12 reports (24 dose–response experiments) were published in peer-reviewed journals, the others were published as theses, conference papers, abstracts or technical reports. In general, experiments used Ile levels around the requirement estimate of the NRC (1998), averaging 102% of the estimate, although this varied widely between experiments (Figure 2). Eleven dose–response experiments used four levels of Ile, 21 experiments used five, 10 experiments used six and 5 experiments used seven or eight levels of Ile. Most experiments were carried out in pigs weighing 10 to 30 kg and, to a lesser extent, in finishing pigs (Figure 2; Supplementary material 1 and 2).
Meta-design of experiments used to estimate the Ile requirement in growing pigs. Each experiment is indicated by a cross, of which the horizontal line indicates the BW range during which the experiment was carried out, and the vertical line indicates the range of Ile concentrations (relative to the Ile requirement estimate of the NRC, 1998).

In 36 experiments, the Ile concentration in the diet was analyzed and this value was then used in our analysis (combined with the calculated SID value). However, analyzed values for other AA were reported less frequently. To verify the accuracy of calculating the AA concentration from feed ingredients and table values, we compared the calculated Ile concentrations of diets without Ile supplementation with reported analyzed values. In general, both values corresponded well (y = 0.033 + 0.952x; R 2 = 0.89). We are therefore confident that if AA concentrations are not reported, calculated values can be used.
Response to Ile supplementation
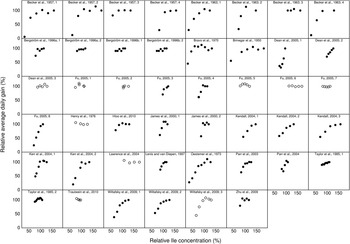
Figure 3 illustrates the responses to Ile supplementation observed in the 46 dose–response experiments. The responses varied widely between experiments and ranged from virtually no response to responses where the Ile-deficient diet resulted in a 75% reduction in ADG. In 13 dose–response experiments, there was no evidence (P > 0.25) for at least a linear response in ADFI or ADG to an increasing Ile concentration, and in most of these experiments the ratio between the minimum and maximum response criterion was greater than 90% (Supplementary material 1). Different factors may have contributed to the lack of response. In seven experiments, AA other than Ile and Lys may have been limiting performance, although the extent of this limitation was modest (Supplementary material 1). Only in the experiments of Henry et al. (Reference Henry, Duée and Rérat1976) and Lawrence et al. (Reference Lawrence, Hahn, Hansen, Hansen, Hansen, Musser and Rademacher2004), other AA may have been limiting before Ile. In three other experiments, the minimum Ile concentration used exceeded the requirement estimate of the NRC (1998). On the basis of these criteria, there were eight experiments where Ile was probably first-limiting but for which no response to the increasing Ile concentration was observed.
Effect of Ile concentration in the diet on average daily gain (ADG) in growing pigs. The Ile concentration is expressed as a percentage of the Ile requirement estimated by the NRC (1998). The ADG is expressed as a percentage of the daily gain observed at the highest level of Ile supplementation. Solid symbols (•) (Brinegar et al., Reference Brinegar, Loosli, Maynard and Williams1950; Becker et al., Reference Becker, Jensen, Terrill, Smith and Norton1957; Becker et al., Reference Becker, Smith, Terrill, Jensen and Norton1963; Bravo et al., Reference Bravo, Meade, Stockland and Nordstrom1970; Oestemer et al., Reference Oestemer, Hanson and Meade1973; Taylor et al., Reference Taylor, Cole and Lewis1985; Bergström et al., Reference Bergström, Nelssen, Tokach, Goodband, Dritz, Loughmiller, Musser and Nessmith1996a and Reference Bergström, Nelssen, Tokach, Goodband, Dritz, Loughmiller, Musser and Nessmith1996b; Lenis and van Diepen, Reference Lenis and van Diepen1997; James et al., Reference James, Goodband, Tokach, Nelssen and DeRouchey2000; Parr et al., Reference Parr, Kerr and Baker2003; Kendall, Reference Kendall2004; Kerr et al., Reference Kerr, Kidd, Cuaron, Bryant, Parr, Maxwell and Campbell2004; Parr et al., Reference Parr, Kerr and Baker2004; Dean et al., Reference Dean, Southern, Kerr and Bidner2005; Fu, Reference Fu2005; Wiltafsky et al., Reference Wiltafsky, Bartelt, Relandeau and Roth2009; Zhu et al., Reference Zhu, Htoo and de Lange2009; Htoo et al., Reference Htoo, Quant, Cho, Kerr, Cromwell and Lindemann2010) are experiments where blood meal or blood cells were used as a protein source, whereas open symbols (○) (Henry et al., Reference Henry, Duée and Rérat1976; Lawrence et al., Reference Lawrence, Hahn, Hansen, Hansen, Hansen, Musser and Rademacher2004; Dean et al., Reference Dean, Southern, Kerr and Bidner2005; Fu, Reference Fu2005; Wiltafsky et al., Reference Wiltafsky, Bartelt, Relandeau and Roth2009; Trautwein et al., Reference Trautwein, Dusel, Bartelt and Corrent2010) are experiments where other protein sources were used. The number after the reference indicates that different Ile dose–response experiments were carried out (see Supplementary material 1 and 2 for details).

In 33 dose–response experiments, there was at least a trend (P < 0.25) for an increase in ADG due to an increase in the Ile concentration (Supplementary material 2). The number of retained experiments was lower when ADFI was used as response criterion (24 experiments), mainly because feed was not offered ad libitum in some experiments. In two experiments, feed was offered ad libitum but ADFI did not respond to an increasing Ile concentration (P > 0.25). Estimates of the Ile requirement for individual experiments are given in Supplementary material 2. In Exp. 1 of Dean et al. (2005), the response to an increasing Ile concentration was convex (Figure 3) and these experiments were excluded in the further analysis. Because response criteria were expressed as relative values, estimates for the asymptote of the bent-stick model were close to 100% and ranged from 92% to 108% (data not shown). Deviations from 100% occur because the highest level of Ile supplementation does not necessarily correspond to the asymptote. There were no indications that high levels of Ile supplementation resulted in a decline in ADFI or ADG (Figure 3). Although the average Ile requirement estimate using ADG as response criterion was close to that of the NRC (1998), estimates ranged from 53% to 114% of the NRC (1998) value. Requirement estimates using ADG or ADFI were highly correlated (r = 0.94) and were slightly greater for ADG than for ADFI (92% v. 90% of the NRC (1998) requirement estimate when both were measured in the same experiment). The slope of the response of the ascending line segment (lower panel of Figure 1) was considerably greater for ADG than for ADFI (2.12 ± 0.10 v. 1.52 ± 0.10). This implies that, when pigs respond to an Ile deficiency, ∼70% of the reduction in ADG is due to the reduction in feed intake.
Representing the response to an increasing Ile concentration
The broken-stick model is probably the most frequently used model to estimate nutrient requirements. This model is based on the assumption that the efficiency of a limiting nutrient for the response criterion is constant below the requirement, to become zero thereafter. The broken-stick model has been criticized for different reasons, including the idea that the efficiency of nutrient utilization may not be constant (Gahl et al., Reference Gahl, Crenshaw and Benevenga1995). Alternative models have been used, including asymptotic and curvilinear-plateau models (e.g. Barea et al., Reference Barea, Brossard, Le Floc'h, Primot, Melchior and van Milgen2009b). The latter model assumes that the efficiency of nutrient utilization increases linearly with a decreasing nutrient concentration, but it does not include an upper limit for the efficiency. The bent-stick model is similar to the broken-stick model, but accounts for a decline in the nutrient requirement during the experimental period (Figure 1). The NRC (1998) assumes that the AA requirement (in g/kg diet) decreases with increasing BW. In experiments where the AA requirement is expressed relative to Lys, the AA : Lys requirement ratio may be considered constant, but the Lys requirement will decline as the pig grows. Consequently, a given Ile : Lys concentration may be limiting early on during the experiment, but not later on because Lys will become less limiting. In the bent-stick model, we assumed that the Ile requirement declined linearly during the experimental period, which is an approximation of the concept proposed by the NRC (1998). For the data used in the meta-analysis, the anticipated change in Ile requirement ranged from 2% to 26% (Supplementary material 1 and 2). Because the Ile requirement was defined as the midpoint of the transition phase, the Ile concentration required to reach the plateau will be greater. For ADG, the average midpoint of the transition phase was estimated at 90% of the NRC (1998) Ile requirement estimate. However, on average, 98% of the NRC (1998) requirement estimate would be required to reach the plateau.
Even if the broken-stick model would be correct for a single animal, variation between animals would result in a curvilinear response for a population of animals (Pomar et al., Reference Pomar, Kyriazakis, Emmans and Knap2003). The current model does not explicitly account for between-animal or between-group variation because the curvature of the transition phase is considered to be constant and determined only by the experimental design (i.e. the anticipated decline in the Ile requirement during the experimental period). Including this aspect in the model would call for adding information about the population structure of the experiments (e.g. number of animals per treatment or variation within experiments) as independent variables in the model, which is beyond the scope of this paper.
In the analysis, we assumed that the slope of the ascending line segment was common for all experiments. This arbitrary decision was made to prevent over-parameterization of the model. With the 32 concave dose–response experiments, 65 parameters were to be estimated (i.e. 32 Ile requirement estimates, 32 plateau values and 1 slope) for a total of 176 observations for ADG. The consequence of this decision is that most of the variation within a dose–response experiment will be accounted for by the Ile requirement estimate. For example, in Exp. 3 of Becker et al. (Reference Becker, Jensen, Terrill, Smith and Norton1957, Figure 3), one could ‘visually’ estimate an Ile requirement close to that of the NRC (1998) in combination with a small value of the slope. However, because the slope is common to all dose–response experiments, the estimated Ile requirement is much lower (66% of the NRC (1998) value; Supplementary material 2). Although the decision to fix one or more model parameters is inevitable to avoid over-parameterization, it reattributes the variation to the other model parameters. In our case, it affects the variability of the individual Ile requirement estimates.
Potential bias in Ile requirement estimates
The Ile requirement estimates reported in Supplementary material 2 have to be interpreted with caution because different factors can contribute to biased estimates. This includes the use of animals that have different requirements compared with that estimated by the NRC (1998), nutrients other than Ile being first-limiting for performance, Lys limiting performance when it should not, or Lys not being second-limiting when it should. The earliest reports on Ile requirements date back to the 1950s and 1960s and it is likely that these pigs were not as lean as modern pigs. This will result in a lower Ile requirement estimate compared with that of the NRC (1998).
To estimate the Ile requirement, we assumed that the potential of the pig (or in certain cases Lys) was second-limiting for performance after Ile. If this is not the case and other factors are second-limiting, the Ile requirement will be underestimated. Although we did not perform a screening for all nutrients, we verified whether other AA could be second-limiting for performance. For example, in the Exp. 8 of Fu (Reference Fu2005), the Trp concentration in the diet was only 87% of the NRC (1998) requirement estimate for Trp, whereas the Ile requirement was estimated at 105% of the NRC (1998) estimate. If Trp was actually second-limiting, the Ile requirement could be as high as 121% (i.e. 105/87) of the NRC (1998) value. The Trp concentration in the experiment of Parr et al. (Reference Parr, Kerr and Baker2003) was such that it even could have been first-limiting (i.e. before Ile). Nevertheless, a clear response to Ile supplementation was observed, indicating that Trp was not first-limiting. Although it cannot be excluded that Trp was second-limiting (resulting in an underestimation of the Ile requirement), it is not possible to confirm this or to reestimate the Ile requirement.
In a limited number of experiments, the Lys concentration was lower than the NRC (1998) requirement estimate. This was the case for a few older experiments and, as indicated before, the Lys requirement in these pigs may have been lower than that estimated by the NRC (1998). In some more recent experiments, the Lys concentration was intentionally kept below the requirement so that Lys would be second-limiting, allowing the expression of the Ile requirement relative to Lys. Nevertheless, in several of these experiments, the Lys concentration exceeded the NRC (1998) requirement estimate. The use of a Lys concentration greater than the NRC (1998) estimate can be justified if the latter is judged to be too low. For example, Kendall et al. (Reference Kendall, Gaines, Allee and Usry2008) proposed a Lys requirement that was 130% of the NRC (1998) estimate, and subsequent work on the SID Val : Lys requirement ratio was based on this higher Lys requirement (Gaines et al., Reference Gaines, Kendall, Allee, Usry and Kerr2011). It is difficult to judge whether, and to what extent, the design of experiments used in the meta-analysis was appropriate to estimate the Ile requirement. Although nutrient requirements are considered often as fixed values, they are based on experiments, and therefore associated with considerable variation.
Factors contributing to the variation in the Ile requirement
The Ile concentration in the basal diet (i.e. the diet not supplemented with dl-Ile or L-Ile) was the factor that was most correlated to the Ile requirement (r = 0.84). This was, in part, because of the response observed in older experiments (before 1980) that used basal diets with very low Ile concentrations in combination with fatter animals having a lower Ile requirement compared with current standards. There is also a ‘mechanical’ explanation for the fact that the Ile concentration in the basal diet is related to the estimated Ile requirement. The higher the Ile concentration of the basal diet and if a response to Ile supplementation is observed, the more likely it will be that the estimated requirement is high, as the latter should at least be greater than the Ile concentration of the basal diet.
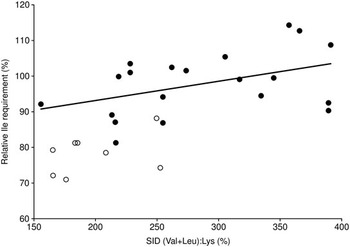
The main aspect that the experiments listed in Supplementary material 2 have in common is that blood meal or blood cells were used as a protein source, with Exp. 3 of Wiltafsky et al. (Reference Wiltafsky, Bartelt, Relandeau and Roth2009) being the only exception (see also Figure 3). The low Ile concentration of blood meal and blood cells (with, respectively, 15% and 5% SID Ile : Lys) has led to the frequent use of these products in Ile dose–response experiments. However, blood meal and blood cells have high or very high concentrations of Leu and Val. The first two steps of the catabolism of Ile, Val and Leu are catalyzed by enzymes or enzyme complexes that are common for these three branched-chain AA, and an excess supply of any of these AA may stimulate the catabolism of the other AA (Harper et al., Reference Harper, Millar and Block1984). Wiltafsky et al. (Reference Wiltafsky, Pfaffl and Roth2010) showed that ADFI and ADG of pigs were reduced when a diet marginally deficient in Ile was supplemented with an excess supply of Leu or Leu + Val. Similar results were observed by Langer and Fuller (Reference Langer and Fuller2000). A large supply of Val and Leu may therefore increase the requirement for Ile. Figure 4 illustrates the relationship between the estimated Ile requirement (using ADG as response criterion) and the SID (Val + Leu) : Lys ratio for experiments published after 1990. The slope of this relationship was relatively small (0.054 ± 0.027; P = 0.06), demonstrating that, although competition between branched-chain AA explains only part of the variation in Ile requirement, it is a true biological factor that should not be ignored.
Relationship between the estimated Ile requirement using average daily gain as the response criterion and the relative ileal digestible (SID) (Val + Leu) : Lys ratio in the diet. The estimated Ile requirements are expressed relative to the requirement estimated by the NRC (1998). The regression equation was y = 0.823 + 0.054x; r.s.d = 0.08. Solid symbols (•) refer to the estimated Ile requirement in experiments for which a response to the Ile concentration was observed, and these experiments are used in the regression equation. Open symbols (○) refer to the lowest level of Ile in experiments for which no response to the Ile concentration was observed. Only experiments published after 1990 are given.

It would be misleading to consider only the results reported in Supplementary material 2 to determine an Ile requirement estimate. The experimental conditions in eight of the experiments listed in Supplementary material 1 were sufficient to anticipate a response to Ile supplementation, but no response was observed. Of all 46 experiments considered, 10 did not use blood meal or blood cells, and in nine of these no response to an increasing Ile concentration was observed. The lowest Ile concentrations used in these experiments were considerably lower than the estimated Ile requirements (Figure 4; averaging 79% of the NRC (1998) requirement estimate). Therefore, the use of blood meal or blood cells in the diet appears to be the main discriminating factor that determines whether a response to Ile supplementation is observed or not. The lack of response when the diet does not contain blood products was also confirmed in recent experiments of Lordelo et al. (Reference Lordelo, Gaspar, Le Bellego and Freire2008), Barea et al. (Reference Barea, Brossard, Le Floc'h, Primot and van Milgen2009a and Reference Barea, Brossard, Le Floc'h, Primot, Melchior and van Milgen2009b) and Nørgaard and Fernández (Reference Nørgaard and Fernández2009). These experiments were not included in the meta-analysis because they used fewer than four levels of Ile.
Although different levels of blood products were used in the experiments, the composition of the diets varied in the same way and it was not possible to identify any specific AA or combinations of AA (other than Val + Leu) that explained the variation in the Ile requirement. Blood products are also rich in Phe and His. These large neutral AA are transported across the blood–brain barrier by an L-type neutral AA transporter, which also transports Ile, Leu, Val, Trp, Met, Tyr, Thr and Gln (Smith, Reference Smith2000). Under physiological conditions, this transport system is nearly saturated so that a reduced plasma concentration of one of the AA transported by this system may result in a reduced uptake by the brain, which, in turn, can result in an anorectic response (Gietzen and Magrum, Reference Gietzen and Magrum2001). The affinity for transport differs between the large neutral AA and the transporter has a moderate affinity for Ile. However, the affinity for Leu and Phe are, respectively, 2.5-fold and 7-fold greater than the affinity for Ile (Smith, Reference Smith2000). This may imply that an excessive supply of these AA impairs the entry of Ile into the brain. Fu et al. (Reference Fu, Fent, Allee and Usry2006) carried out an experiment to mimic the dietary AA profile of blood cells by adding crystalline AA to a soy bean meal-based diet. Providing an excess supply of Leu, Val, His and Phe to the soybean meal diet reduced performance, which could be restored by providing additional Ile.
Diets that contain blood meal or blood cells appear to provoke an increase in the Ile requirement (e.g. Dean et al., Reference Dean, Southern, Kerr and Bidner2005). In these diets, catabolism of Ile may be stimulated by an excess supply of Val and Leu. In addition, Ile has to compete with other large neutral AA for transport through the blood–brain barrier. Although these AA are potential candidates contributing to the increased Ile requirement, other constituents of blood products may be implicated as well.
Estimating a requirement or a response?
Although nutritional recommendations are often summarized as ‘requirements’, this does not tell the whole story. In the bent-stick model, we arbitrarily designated the midpoint as the requirement, even though ∼10% more Ile was required to attain the plateau. In practical animal nutrition, the cost of the additional Ile has to be evaluated against the benefit to be obtained from the improved performance (or: evaluating the benefit of providing less Ile against the cost of performance loss). To make decisions regarding feed formulation, knowledge of the response curve is therefore more important than knowledge of the requirement per se. In experiments for which a response was observed, the slopes of the ascending line segments were 2.12 and 1.52 for ADG and ADFI, respectively. Consequently, an Ile deficiency of 10% will result in a 15% reduction in ADFI and a 21% reduction in ADG. Although there may be uncertainties concerning the value of ‘the’ Ile requirement in growing pigs and as different animals may respond differently to the deficiency, it is clear that a deficient Ile supply has a major impact on performance.
In conclusion, using blood meal or blood cells in diets for growing pigs appears to increase the requirement for Ile. For this type of diet, the current NRC (1998) requirement estimate (which is equivalent to 55% SID Ile : Lys) appears to be valid. The NRC (1998) requirement estimate is already lower than that of the British Society of Animal Science (2003; 58% SID Ile : Lys) and Henry (Reference Henry1993; 60% SID Ile : Lys). Experimental results indicate that the Ile requirement is probably (considerably) lower if blood products are not used as protein sources. On the basis the results presented in Figure 4, and because an Ile deficiency results in an important reduction in performance, we suggest to ensure an SID Ile : Lys ratio of at least 50%.
Supplementary materials
For supplementary material referred to in this article, please visit http://dx.doi.org/doi:10.1017/S1751731112000420