


Introduction
Small glaciers and ice caps are very sensitive to climate changes, and even though they only cover 3% of the Earth’s total glacierized land area, studies have shown that they have contributed ∼20% to the observed sea-level rise during the last century (Reference Church and HoughtonChurch and others, 2001; Reference Arendt, Echelmeyer, Harrison, Lingle and ValentineArendt and others, 2002). Glaciers north of 60° N constitute a significant part of the area and volume of the world’s small glaciers and ice caps, covering an area of ∼275 000 km2 (Reference DowdeswellDowdeswell and others, 1997). Future climate warming has been predicted to be more pronounced in the Arctic than at lower latitudes (Reference Dowdeswell, Hagen, Bamber and PayneDowdeswell and Hagen, 2004), but the response of glaciers to potential future climate change has only been studied for a very limited number of Arctic glaciers and ice caps. The definition of the Arctic varies widely among authors and disciplines (Reference PrzybylakPrzybylak, 2003). Following ACIA (2005) we refer to the area north of 60° N, although this area includes both real Arctic continental glaciers and maritime non-Arctic glaciers in terms of different climatic environments.
Mass-balance records of varying lengths exist for more than 40 Arctic glaciers and ice caps, with the earliest beginning in the 1940s (Reference DowdeswellDowdeswell and others, 1997), but few include >20years (Reference Dyurgerov and MeierDyurgerov and Meier, 1997). Most Arctic glaciers and ice caps have experienced significant negative mass-balance trends during the last 40 years, although these are not uniform across the Arctic (Reference DowdeswellDowdeswell and others, 1997). Alaskan glaciers have extensively thinned during recent decades (Reference Arendt, Echelmeyer, Harrison, Lingle and ValentineArendt and others, 2002), while many glaciers in Iceland and Scandinavia experienced positive mass balances in the 1990s, possibly explained by internal variations in the climate system, such as increasing precipitation due to changes in atmospheric circulation (Reference Reichert, Bengtsson and OerlemansReichert and others, 2001).
The response of glaciers to climate change is often expressed in terms of static or dynamic mass-balance sensitivities. In contrast to the dynamic sensitivity, the static sensitivity neglects changes in glacier size and geometry, mass-balance height feedback and imbalance, and only refers to the change in area-weighted average mass balance caused by an instant change in a climatic parameter, in this case temperature or precipitation. Reference JóhannessonJóhannesson (1997) found that the difference between the static and the dynamic approach was negligible for small climate perturbations applied to smaller ice masses close to equilibrium over the next 100 years, but significant beyond that timescale. For relatively large ice masses and rapidly retreating glaciers, the difference becomes significant after a few decades, and by 2100 the dynamic mass-balance sensitivity is about two-thirds of the static mass-balance sensitivity (Reference OerlemansOerlemans and others, 1998).
Previous studies have employed a large range of models of varying complexity including simple temperature-index (e.g. Reference Braithwaite and ZhangBraithwaite and Zhang, 1999), energy-balance (e.g. Reference OerlemansOerlemans, 1992) and ice-dynamic models (e.g. Reference Schneeberger, Albrecht, Blatter, Wild and HockSchneeberger and others, 2001), in order to assess the response of glaciers to climate change. Sophisticated approaches are important for developing models and understanding processes, but they are not always practical for understanding how glaciers react on a global scale, due to lack of the input data necessary to widely apply such models. Hence, simple models with restricted data requirements are necessary to allow a large number of glaciers to be assessed.
While many studies have focused on one glacier or a small number of glaciers, few studies have addressed the issue of mass-balance sensitivity for a larger number of glaciers, and to our knowledge only one (Reference OerlemansOerlemans and others, 2005) has explicitly focused on the Arctic. A summary of studies including high-latitude glaciers, among others, is given in Table 1 . Static mass-balance sensitivities to an increase in temperature generally range from –0.1 to –1.35 ma– 1 K–1 (Table 1). Most studies conclude that glaciers in wetter or maritime climates tend to be more sensitive than subpolar or continental glaciers. Global mean static mass-balance sensitivities of –0.39 and –0.37 ma–1 K–1 have been reported by Reference Oerlemans and PeltierOerlemans (1993) and Reference Dyurgerov and MeierDyurgerov and Meier (2000), respectively, the former estimate being based on modelling while the latter is derived from analysis of mass-balance and temperature observations.
Previous studies reporting static mass-balance sensitivities of at least two glaciers north of 60˚ N, that used energy-balance (EB) or temperature-index (TI) melt models

The purpose of our study is (1) to calibrate a mass-balance model with historic climate for 42 Arctic glaciers and ice caps, (2) to simulate the static mass-balance sensitivity to different hypothetical climate perturbations, (3) to analyze regional differences in mass-balance response, and (4) to approximate the effect of a +1 K warming on the contribution of Arctic glacier melt to sea-level rise. To be able to include a large number of glaciers, we use a simple model based on linear regression equations between measured glacier mass balance and observed daily air temperature and precipitation adopting a degree-day approach.
Database
A total of 42 glaciers north of 60° N were included in the analysis. Only glaciers with data available for both winter and summer mass balances and a mass-balance record spanning ≥7years were considered. Data were retrieved from various sources such as web-based databases (e.g. Reference DyurgerovDyurgerov, 2002), literature (e.g. Reference Björnsson, Pálsson, Gudmundsson and HaraldssonBjörnsson and others, 1998, Reference Björnsson, Pálsson and Haraldsson2002) or direct contacts. The main sources for daily temperature and precipitation data were national meteorological institutes such as the Meteorological Service of Canada (Reference Mekis and HoggMekis and Hogg, 1999; Reference Vincent, Zhang, Bonsal and HoggVincent and others, 2002) and the Meteorological Institute of the Netherlands (Reference Klein TankKlein Tank and others, 2002) as well as various websites. Daily climate data from a total of 45 climate stations are included in this study (Fig. 1). The distance between the glacier and the climate station varied considerably, ranging from a few hundred metres to several hundred kilometres. Missing data were interpolated using data from adjacent weather stations, and mass-balance years with climate data gaps exceeding 2 months were excluded.
Regions including the studied glaciers and ice caps: 1 Agassiz Ice Cap, Devon Ice Cap, Meighen Ice Cap, Melville South Ice Cap. 2 Vavilov ice dome. 3 Austre Okstindbreen, Engabreen, Langfjordjøkelen, Marmaglaciären, Rabots glaciär, Riukojietna, Storglaciären, Storsteinfjellbreen, Tarfalaglaciären, Trollbergdalsbreen. 4 Ålfotbreen, Austdalsbreen, Grabreen, Grasubreen, Hansebreen, Hellstugubreen, Nigardsbreen, Rembesdalskaka, Storbreen. 5 IGAN, Obrucheva. 6 austre Brøggerbreen, Bertilbreen, Bogerbreen, Hansbreen, Kongsvegen, midre Lovénbreen. 7 Gulkana, Wolverine. 8 Blágnípujökull, Brúarjökull, Dyngjujökull, Eyjabakkajökull, Köldukvíslarjökull, Satujökull, þjόrsárjökull, Tungnaárjökull. Climate stations sorted after regions: 1 Alert, Clyde, Eureka, Mould Bay, Resolute, Sachs Harbour. 2 Hatanga, Ostrov Dikson. 3 Abisko, Alta Lufthavn, Bodø, Glomfjord, Katterjåkk, Kiruna Flygplats, Narvik, Nikkaluokta, Riksgransen, Ritsem, Torneträsk, Tromsø. 4 Fannaraken, Fjærland-Skarestad, Fokstua, Sandane, Sognefjellet, Tafjord, Vågå-Klones, Vangsnes. 5 Berezovo, Hose-da-Hard, Mys Kamennyj. 6 Hornsund, Ny-Ålesund, Svalbard Lufthavn. 7 Cooper Lake Project, Gulkana Basin, Paxson, Wolverine Basin. 8 Akurnes, Fagurholsmyri, Hjarðarnes, Holar í Hornafirði, Hveravellir, Kirkjubæjarklaustur, Nautabu.

A few mass-balance records span >50 years, with the longest, from Storglaciären, Sweden, dating back to 1945/ 46, but the records unfortunately lack corresponding climate data for the entire period. The longest combined mass-balance–climate dataset was found for Storbreen, Norway (45 years: 1957/58–2001/02). Six datasets from Canada and Norway included 40 years or more. Nine glaciers, most of them located in Iceland but some in Scandinavia, were calculated from only 7–9 years, mostly due to short mass-balance records (Table 2).
Static sensitivity of mass balance (m a–1) to a +1 K temperature increase (T) or a +10% precipitation increase (P) for 42 glaciers north of 60˚ N, continentality index (CI) for each climate station and the number of mass-balance years considered (n), explained variance (r 2) for summer mass balance (b s) regression and winter mass-balance (b w) regression. The glaciers are sorted by region 1–8 (Fig. 1) and subsorted within each region by increasing summer mass-balance sensitivity

Method
The mass-balance model is based on daily temperature and precipitation data collected at climate stations near the glaciers, and separately measured summer and winter mass balances. Separate winter and summer mass balances instead of net mass balances enable a more distinct link to meteorological parameters (Reference Dyurgerov and MeierDyurgerov and Meier, 1999), while daily instead of monthly climate data are used because the transition between summer and winter will shift under a changing climate (Reference Oerlemans and FortuinOerlemans and Fortuin, 1992). The use of daily data does not require the seasons to have defined lengths (cf. Reference Oerlemans and ReichertOerlemans and Reichert, 2000) and has been found by Reference Fleming, Dowdeswell and OerlemansFleming and others (1997) to yield better results when comparing observed and modelled mass balances. Finally, future climate scenarios are often based on changes in temperature and precipitation (Reference Jóhannesson, Sigurdsson, Laumann and KennettJόhannesson and others, 1995).
To be able to involve a large number of glaciers, we adopt a simple model based on a degree-day approach (Reference HockHock, 2003). Glacier-averaged degree-day factors were obtained by regression analysis (Fig. 2). Linear regression equations between measured summer mass balances and the positive degree-day sum over the entire mass-balance year (Equation (1)), and between measured winter mass balances and the annual sum of daily precipitation, P, with air temperature at the glacier T<0°C (Equation (2)), were established for each glacier. Summer mass balance, bs, and winter mass balance, bw are then modelled by


where a and β are regression coefficients, a s corresponding to the degree-day factor. Strictly speaking, the obtained mass balances bs and bw refer to total ablation and total accumulation respectively. T and Pwere integrated between 1 October (t 1) and 30 September (t 2), thus defining a mass-balance year according to Reference DyurgerovDyurgerov (2002). Reference Ohmura, Kasser and FunkOhmura and others (1992) suggest that a glacier’s climate is best represented by the climate at the equilibrium-line altitude. Hence, measured daily air temperatures were extrapolated from the altitude of the climate station to the altitude of the mean equilibrium line of each glacier, assuming a fictitious constant lapse rate. The lapse rate for each glacier was chosen to yield highest correlation coefficients in the linear regression (Fig. 2). In most cases, similar lapse rates were achieved for the summer and winter mass balances, and from the results one lapse rate per glacier was selected for further analysis.
Regression analysis for Nigardsbreen, Norway, over the period 1970/71–2001/02 using climate data from Sandane. Measured summer mass balance, b s, vs annual positive degree-day sum (a), and winter mass balance, b w, vs annual snow precipitation (c), including the number of mass-balance years considered, n, regression lines and equations based on the lapse rate yielding maximum r 2 as indicated by arrows in (b) and (d). A lapse rate of 0.70 K(100 m)–1 was used for modelling both winter and summer balances in further analysis.

All 42 Arctic glaciers were analyzed using climate data from all climate stations near the glaciers for which the required data could be retrieved. In total, the regression analysis resulted in roughly 250 unique correlations between summer mass balance and the sum of positive degree-days, and between winter mass balance and annual snow precipitation. For each glacier, the regression based on data from the climate station yielding the best overall correlation for both winter and summer mass balances was used for further analysis. If a similar correlation was obtained for several stations, the climate station closer to the glacier or considered to be more representative, based on local expertise, was preferred.
Following other studies (Table 1), we calculated the static mass-balance sensitivity for each glacier. We use the term static following previous work (Table 1), altough some dynamic effects are indirectly incorporated since the model is calibated against mass-balance data that generally are integrated over the evolving glacier area (Reference Elsberg, Harrison, Echelmeyer and KrimmelElsberg and others, 2001), thus including effects of geometry changes on mass balance. We chose a climate perturbation ranging from +0 to +4K for temperature and +0 to +40% for precipitation, but we focus on the results for a +1 K temperature and a +10% precipitation change. These changes were uniformly applied to the measured climate-data records. When temperature was increased, precipitation was assumed unchanged and vice versa. The advantage of choosing such a hypothetical climate perturbation throughout the year is that it enables us to compare different models and sensitivity results using different methods for the same glaciers (cf. Table 1). Such uniform changes throughout the year are neither expected nor the only ones that may occur, but they act as a suitable standard (Reference Braithwaite and ZhangBraithwaite and Zhang, 1999) for comparing different glaciers and models.
To investigate sensitivities with respect to the climatic setting (continental/maritime), we quantified the degree of continentality of each glacier’s location by a continentality index (CI) following Reference Holmlund and SchneiderHolmlund and Schneider (1997). The CI is defined as the temperature amplitude during a mass-balance year and is calculated from the difference in mean temperature between the coldest month and the warmest month. Large temperature amplitudes are associated with high-pressure systems and dry conditions and indicate continental conditions. Higher precipitation due to low-pressure systems is associated with smaller temperature amplitudes and generally milder climate, indicating that the CI is connected to both temperature and precipitation. Following this approach, we calculated the CI for each climate station (Table 2).
Results and Discussion
Model performance
Table 2 indicates a large range of correlation coefficients in the regression analysis, at least partially resulting from the simplification of reality in our model by only including temperature and precipitation data in the mass-balance modelling. Highest correlation for the summer mass balance is found for Blágnípujökull, Iceland, where 93% of the variation can be explained by the positive degree-day sum derived from temperature data at Hveravellir. For the winter mass balance, the highest value (89%) was obtained for Austdalsbreen, Norway, using the temperature and precipitation data at Fjærland-Skarestad, while most investigated glaciers in Canada, Svalbard and Russia showed no or very weak correlation. In the latter cases, the distance between the glacier and the location of available climate data tended to be large, reaching hundreds of kilometres, so the climate data are probably less representative for the climate conditions on the glacier. Generally, higher correlation was found for the summer mass balance than for the winter mass balance, which is attributed to the large spatial variability of precipitation compared to generally far more homogeneous spatial variability of temperature. Surprisingly, however, for some glaciers equal or better correlations were found for climate stations located farther away from the glacier. This may be due to small-scale climate heterogeneity, as typically found in mountain regions, in addition to problems with data quality since weather stations close to the glaciers are often less accessible and thus less frequently serviced. For instance, for the summer mass balance at Gulkana, Alaska, USA, better results were obtained using the data from the climate station Paxson, 25km from the glacier, than using the data collected at the edge of the glacier. On Storglaciären, Sweden, using the temperature data from Ritsem, >60 km away, yielded similar results to those using the data from Tarfala Research Station just 1 km from the glacier. Clearly, proximity between glacier and climate station does not necessarily yield the best results.
The tuned lapse rates varied from 0.10 to 1.5 K(100 m)–1 (Table 2), with low values for, for example, Agassiz Ice Cap, Canada, and high values for, for example, Vavilov ice dome, Severnaya Zemlya. Tuned lapse rates exceeding 1.0 K(100m)–1 may result from horizontal temperature gradients caused by large distances between glacier and climate station or other local effects. Hence, the tuned fictitious lapse rates include both horizontal and elevation-dependent air-temperature variations.
Mass-balance sensitivity
The net mass-balance sensitivity to a +1 K temperature increase ranged from -0.2 to -2.0 m a-1 (Table 2). The assumed increase in precipitation by +10% enhances mass balance by <+0.1 to +0.4 m a-1, and thus, on average, offsets the effect of the +1 K temperature increase by approximately 20%. The net mass-balance sensitivity was only calculated for 32 of the 42 glaciers due to very low correlation coefficients (r 2<0.15) between winter mass balance and annual snow precipitation for some investigated glaciers. For glaciers with r 2<0.15 the mass-balance sensitivities were only computed for the summer mass balance assuming a +1 K warming (Table 2). Results ranged from -0.1 ma–1 for Devon Ice Cap, Canada, to -1.75 m a-1 for Dyngjujökull, Iceland. Extremely high sensitivities were found for most Icelandic glaciers, especially at Vatnajökull, considerably exceeding the range of values previously reported for any other glacier in the world (Tables 1 and 2).
Our results for individual glaciers generally agree well with those obtained in previous studies (Tables 1 and 2), although for some glaciers the sensitivities deviate by up to roughly 0.25 ma-1 . Although the sample size is low, it seems that best agreement is found with results also based on temperature-index methods. Reference Braithwaite and ZhangBraithwaite and Zhang (1999) found uncertainties for static mass-balance sensitivities of about ±0.1 ma–1 K−1, although it is uncertain if this value also applies to other model formulations.
Figure 3 illustrates examples for low and high mass-balance changes resulting from temperature and precipitation perturbations of 0 to +4 K and 0 to +40%, respectively. Considering, for example, a temperature increase by 3 K, Kongsvegen’s mass-balance change exceeds − 2 m a–1 , while the corresponding value for Dyngjujökull exceeds − 8 m a-1. Although for larger perturbations static sensitivities become increasingly meaningless, since dynamic effects are not included and the sensitivities for larger perturbations follow a non-linear behaviour, the difference clearly reveals the different glacier response in different climate regimes, Kongsvegen being located in a more continental, and Dyngjujökull in a more maritime, setting.
Mass-balance change (m a–1) to different hypothetical temperature increase (ΔT) and precipitation increase (DP) for Kongsvegen, Svalbard (a), and Dyngjujökull, Iceland (b).

Degree of continentality
Figure 4 illustrates that a glacier located in a maritime climate with smaller annual temperature amplitude tends to have a higher sensitivity than a glacier located in a continental climate with larger temperature amplitude. These findings are in agreement with previous studies (e.g. Reference Oerlemans and FortuinOerlemans and Fortuin, 1992; Reference Laumann and ReehLaumann and Reeh, 1993; Reference Braithwaite and ZhangBraithwaite and Zhang, 1999; Reference Braithwaite, Zhang and RaperBraithwaite and others, 2002; Reference Schneeberger, Blatter, Abe-Ouchi and WildSchneeberger and others, 2003). The variation in mass-balance sensitivity to a temperature increase can be explained to 6 1% (Fig. 4a) by the degree of continentality as expressed by the continentality index. The corresponding value for a precipitation increase is only 37% (Fig. 4b). Excluding the outlier Vavilov ice dome (CI= 49) from the analysis, these values are reduced to 51% and 25%, respectively. A larger than average relationship between the variation in mass-balance sensitivity and continentality index is found in Iceland for both summer mass balance (77%) and winter mass balance (53%). Higher sensitivities for maritime than for continental glaciers can be attributed to differences in annual temperature amplitudes. Due to lower annual temperature amplitudes, the fraction of precipitation that falls as rain instead of snow will increase to a greater extent than in climates with large temperature amplitudes (Reference Oerlemans and FortuinOerlemans and Fortuin, 1992).
Static net mass-balance sensitivity vs CI (K) for 32 glaciers north of 60˚ N: (a) to a temperature change by +1K (inverted scale y axis, best fit: y = –39.87× –1.37); and (b) to a precipitation change by +10% (best fit: y = 7.38x –1.37).

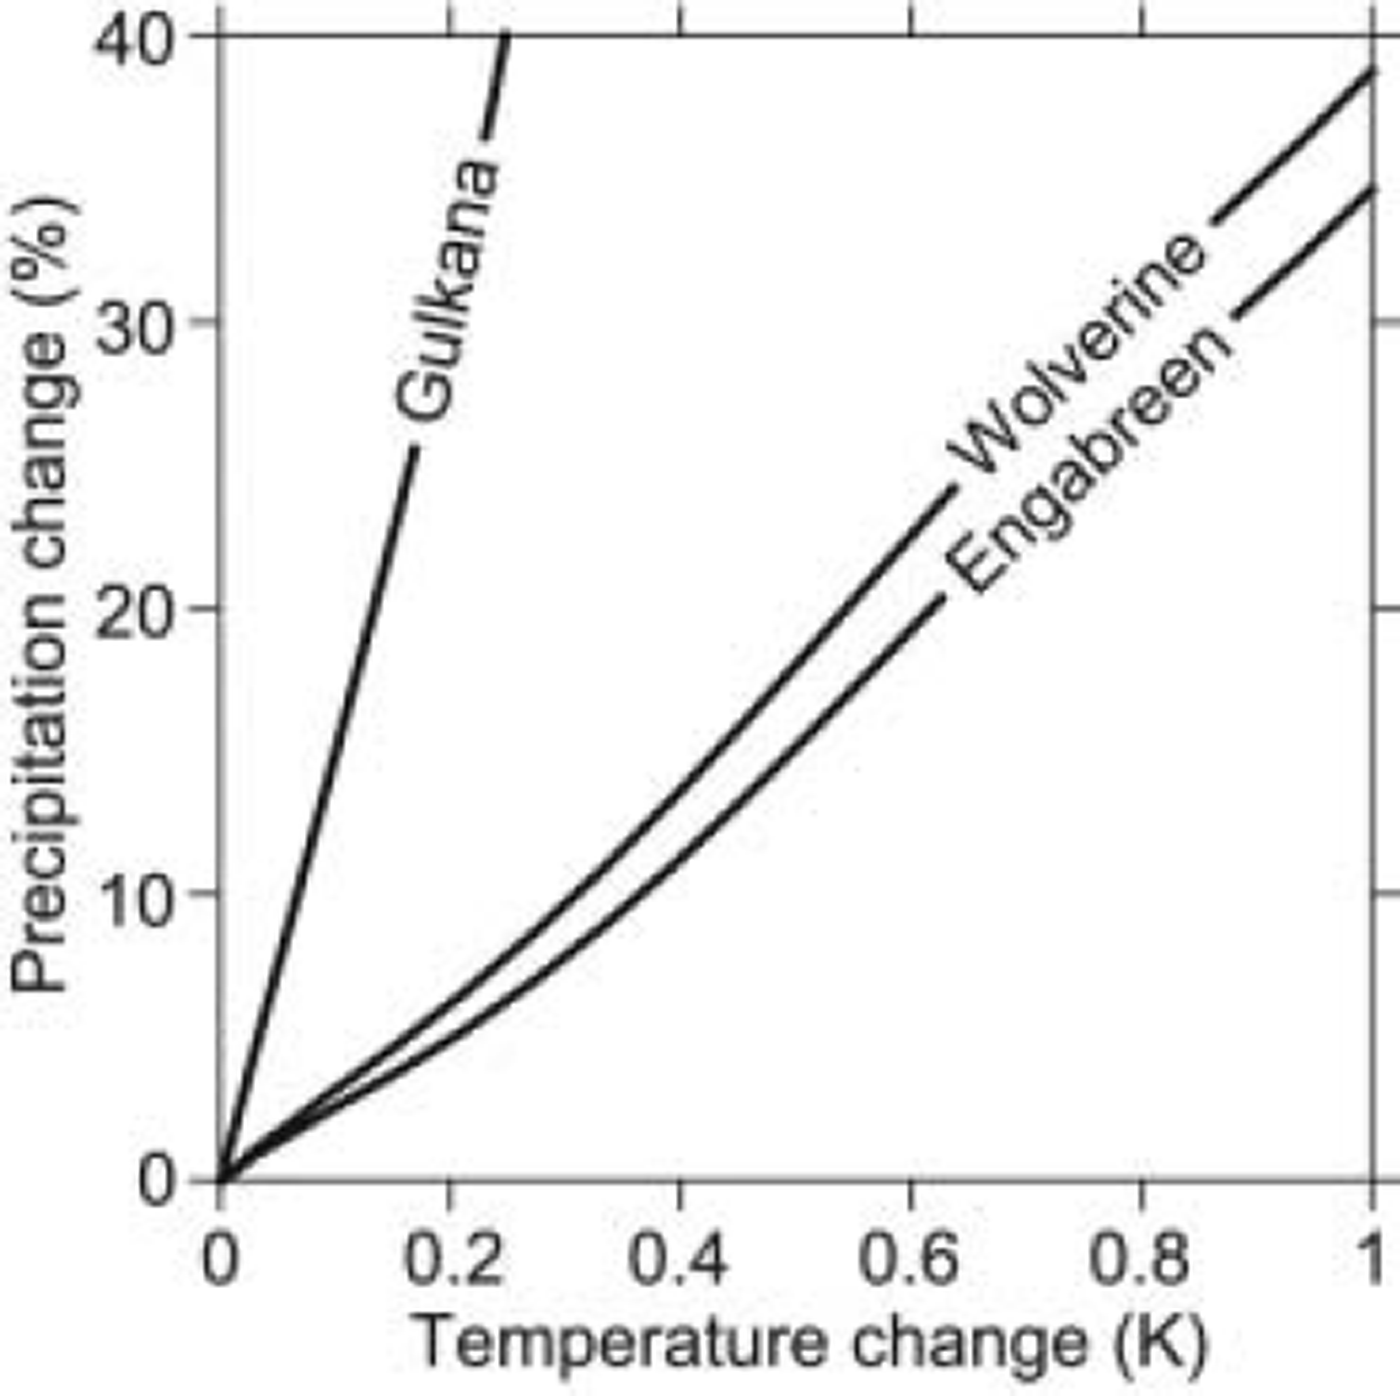
Different behaviour for maritime and continental settings is also evident from Figure 5, visualizing different slopes of the zero net mass-balance change as a function of assumed temperature and precipitation changes. Continental Gulkana needs a roughly 30% increase in precipitation to compensate for a temperature increase of +0.2 K, whereas for maritime Wolverine, Alaska, located 370 km away, a <5% increase in precipitation is sufficient not to change the mass balance. Engabreen, Norway, also located in a strongly maritime environment, similarly to Wolverine shows a course of zero net mass-balance change. In general, much higher percentage increases in precipitation are needed for continental than for maritime glaciers in order to balance the effects of a temperature increase.
Zero net mass-balance change (ma-1) as a function of precipitation increase (%) and temperature increase (K) for Gulkana, Alaska, Wolverine, Alaska, and Engabreen, Norway.
Contribution to sea level
Following Reference OerlemansOerlemans and others (2005), we estimated the contribution of Arctic glaciers to sea-level rise for a uniform +1 K warming. For each region, the mass-balance sensitivities of all glaciers considered were averaged using area-weighted means. The mean sensitivities were then multiplied by total ice area coverage for each region, and divided by total area of the world ocean (362 × 106km2). The method is rough since it uses regional sensitivities based on only a few glaciers that are assumed to be representative of the entire region. We excluded the Greenland ice sheet, the Canadian Arctic, Zemlya Frantsa Iosifa, the Ural Mountains and Novaya Zemlya due to lack of sufficient mass-balance and climate data or due to insufficient correlation coefficients (Table 2). Results are presented in Table 3. The total contribution of glacier melt for a +1 K warming from Severnaya Zemlya, Norway/Sweden, Svalbard, Alaska and Iceland amounts to 0.26 mm a-1 and hence exceeds the value of 0.19 mm a-1 obtained by Reference OerlemansOerlemans and others (2005) for the same area. Using our results, but adopting the sensitivities obtained by Reference OerlemansOerlemans and others (2005) for the areas that had to be excluded from our analysis, yields an estimate of the total contribution to sea level from Arctic glaciers and ice caps of about ∼0.6mma–1 , compared to 0.53 mm a-1 found by Reference OerlemansOerlemans and others (2005).
Contribution of glacier melt from various regions north of 60˚ N to sea-level rise in response to a +1 K warming, compared to the results by Reference OerlemansOerlemans and others (2005)

Conclusions
We used a simple mass-balance model established from linear regression between measured summer glacier mass balance and observed daily air temperature, and between winter glacier mass balance and snow precipitation. The model was applied to 42 glaciers and ice caps north of 60° N to compute the static mass-balance sensitivity to different hypothetical climate perturbations. Our main findings are:
The sensitivities of the glacier net mass balance of 32 glaciers and ice caps north of 60° N in response to a hypothetical +1 K temperature increase show a large variation, ranging from -0.2 to − 2 .0 m a-1 . The range is larger than reported in previous studies for glaciers worldwide (−0.1 to -1.35 m a-1 ) . The sensitivities of the summer mass balance for 42 Arctic glaciers to a temperature change of +1 K ranged from -0.1 to -1.8 m a-1 . The highest sensitivities were found for glaciers in Iceland.
On average, an assumed increase in precipitation of 10% tends to offset the effect of a temperature change of +1 K by approximately 20% (<+0.1 to +0.4 m a-1).
The variation in mass-balance sensitivities could at least partially be attributed to the climate setting where the glacier is located. Sensitivities tend to increase as climate conditions become more maritime, as expressed by the CI.
The estimated contribution from Arctic glaciers and ice caps to sea-level rise in response to a +1 K warming is ∼ 0.6mm a-1 .
Acknowledgements
We gratefully acknowledge the large number of organizations and individuals that provided us with the necessary input data. Complementary useful information was provided by A. Arendt, H. Björnsson, K. Braun, S. Debatin, M. Dyurgerov, G. Gísladóttir, P. Glowacki, S. Guðmundsson, T. Jóhannesson, M. Johansson, R. Koerner, B. Kjøllmoen, J. Kohler, Y. Kramer, E. Mekis, I.M. Nordin, M. Skogh and L. Vincent. Additional climate data were obtained from the All-Russian Research Institute of Hydrometeorological Information, the Swedish Meteorological and Hydrological Institute and the United States Geological Survey. We also owe a debt to everyone who has measured mass-balance and climate data during the past century. Funding was received from the C.F. Liljevalch J:ors fund, Axel Lagrelius fund, Rhodins fund and the Swedish Research Council. This study is a contribution to the CE (Climate and Energy) project funded by Nordic Energy Research (NEFP). Comments by R. Braithwaite, P. Jansson, T. Jóhannesson, M. Hansson and A. Rasmussen helped to improve the manuscript.



