Introduction
Exposure of plants to various abiotic and biotic stresses usually shifts the equilibrium between reactive oxygen species (ROS) production and their detoxification by the antioxidative system towards increased ROS formation (Bailey-Serres and Mittler, Reference Bailey-Serres and Mittler2006). While at high concentration ROS may exert oxidative damage and consequently may lead to cell death, at low concentration they may function as components of signal transduction pathways (Vestergaard et al., Reference Vestergaard, Flyvbjerg and Møller2012). The antioxidative system is composed of enzymes that scavenge directly toxic ROS or that are involved in the repair of ROS-mediated oxidative damage, and hydrophilic (ascorbate and reduced glutathione (GSH)) and lipophilic (α-tocopherol and carotenoids) metabolites that function as direct antioxidants and/or as a substrates for the antioxidant enzymes (Caverzan et al., Reference Caverzan, Passaia, Rosa, Ribeiro, Lazzarotto and Margis-Pinheiro2012).
GSH in plants is involved in numerous roles, including the ascorbate–glutathione cycle, which regulates the H2O2 level, sulphur metabolism and control of gene expression (Ogawa, Reference Ogawa2005). GSH can act also as a redox buffer (Foyer and Halliwell, Reference Foyer and Halliwell1976; Bashandy et al., Reference Bashandy, Guilleminot, Vernoux, Caparros-Ruiz, Ljung, Meyer and Reichheld2010; Foyer and Noctor, Reference Foyer and Noctor2011; Seth et al., Reference Seth, Remans, Keunen, Jozefczak, Gielen, Opdenakker, Weyens, Vangronsveld and Cuypers2012). In addition to its antioxidant functions, GSH is a substrate for GSH S-transferases in xenobiotics detoxification and is a precursor of the phytochelatins, which are low-molecular weight thiols that have an important role in the detoxification of heavy metals such as Cd2+ (Mittler et al., Reference Mittler, Vanderauwera, Gollery and van Breusegem2004; Smeets et al., Reference Smeets, Opdenakker, Remans, van Sanden, van Belleghem, Semane, Horemans, Guisez, Vangronsveld and Cuypers2009; Cuypers et al., Reference Cuypers, Plusqui, Remans, Jozefczak, Keunen, Gielen, Opdenakker, Nair, Munters and Artois2010).
Five levels of control of steady-state GSH concentrations have been identified: (1) substrate availability, (2) rate limitation of GSH synthesis by γ-glutamylcysteine synthetase (γ-ECS) activity, (3) feedback inhibition of GSH formation at γ-ECS, (4) post-transcriptional regulations, including translational controls, and (5) control of the transcription of the genes for GSH synthesis (Jozefczak et al., Reference Jozefczak, Remans, Vangronsveld and Cuypers2012).
An extensive research has been carried out regarding the antioxidative system involved in the salt-tolerance of tomato. The antioxidative systems of the salt-sensitive cultivated tomato Solanum lycopersicum Mill. cultivar M82 (Lem) and of its wild salt-tolerant relative Solanum pennellii (Corr.) D'Arcy accession Atico (Lpa) were compared in cell organelles of leaves and roots under control and salt stress growth conditions (Shalata et al., Reference Shalata, Mittova, Volokita, Guy and Tal2001; Mittova et al., Reference Mittova, Tal, Guy and Volokita2002a, Reference Mittova, Tal, Volokita and Guyb, Reference Mittova, Tal, Volokita and Guy2003a, Reference Mittova, Guy, Tal and olokita2004). The better protection of the salt-tolerant Lpa against salt-induced oxidative stress was found to depend on the increased activities of antioxidative enzymes such as superoxide dismutase, glutathione peroxidase, ascorbate peroxidase, glutathione reductase and levels of non-enzymatic antioxidants such as ascorbate and GSH. The increased level of GSH in the salt-stressed Lpa plants resulted from the increased amount of γ-ECS protein (Mittova et al., Reference Mittova, Theodoulou, Kiddle, Gomez, Volokita, Tal, Foyer and Guy2003b), the key enzyme in GSH synthesis.
This work is focused on: (a) The characterization, including cloning and sequencing, of the γ-ECS gene in the two tomato species Lem and Lpa; (b) The identification of the introgression line (IL) which harbours the Lpa γ-ECS orthologue in the genetic background of Lem; (c) The comparison of the transcription of the two orthologous genes Lem γ-ECS and Lpa γ-ECS, the latter in Lpa and in Lem genetic backgrounds, under control or abiotic stress (NaCl, CdSO4 and buthionine sulfoximine (BSO)) conditions.
Materials and methods
Plant material and growth conditions
Plants of the three genotypes, the cultivated tomato Solanum lycopersicum Mill, cultivar M82 (Lem) (M82 is a solanum lycopersicon cv. Esculentum processing cultivars which was bred by Yeoshua Rudich in Israel. It is the cultivated parent of the IL population and is available also in Professor Dani Zamir laboratory), its wild salt-tolerant relative Solanum pennellii (Corr.) D'Arcy accession Atico (Lpa) (Atico is a geographic region in Peru, which is the natural habitat of LA0716), and IL 8–3, were grown all year-round in a wet-mattress-cooled greenhouse. All seeds are available in Prof. Dani Zamir lab, the Faculty of Agriculture, Rehovot, Israel, or through the TGRC (http://tgrc.ucdavis.edu/) Accessions numbers: LA4028- 4103.
IL 8–3, which was found to contain the Lpa γ-ECS orthologue, is one out of 76 ILs of nearly isogenic Lem background, each containing a different single homozygous RFLP-defined chromosome segment introduced from Lpa instead of the Lem homologue (Eshed and Zamir, Reference Eshed and Zamir1994, Reference Eshed and Zamir1995). Thus, both Lpa and IL 8–3 are homozygous for the Lpa γ-ECS orthologue, the first in Lpa genetic background and the second in Lem genetic background. Typically, the day/night temperature in the greenhouse was 30/20°C (summer) and 19/8°C (winter). Light radiation ranged from 400 (winter) to 1000 (summer) μM m−2 s−1. The plants were grown hydroponically in half-strength Hoagland solution (Hoagland and Arnon, Reference Hoagland and Arnon1950) and aerated by aquarium pumps equipped with cylindrical air stones (one per container). For experiments in which mature plants (up to 14 d) were needed, eight plants per container were grown in 14″ tool-boxes filled up with 4.0 litres of growth medium.
Salt (NaCl) and cadmium (CdSO4) treatments
Salt treatment started at the stage of about four true leaves by the addition of 100 mM NaCl. Leaves were sampled daily up to 18 d after the completion of salinization for molecular analysis of crude extracts. Successive leaves, starting from leaf number 4 (from the top), were frozen in liquid nitrogen and stored at −80°C until analyzed.
Cadmium treatment started at the stage of four true leaves by the addition of 50 µM CdSO4. Leaves were sampled at 1, 2 and 10 d after the addition of CdSO4.
Buthionine sulfoximine (BSO) treatment
Young tomato plants were grown in a 250 ml Magenta box (four plants per container) in 150 ml aerated half-strength Hoagland solution. Treatment was started by the addition of BSO to a final concentration of 1 mM. Leaves were sampled at 1 and 2 d after the addition of BSO, frozen in liquid nitrogen, and stored at −80°C until analysed.
Determination of plant growth
The length (from the cotyledons to the tip) of stems of young plants with four fully grown leaves were recorded (in mm) daily. Stem elongation rate (SER) was calculated following Lauchli (Reference Lauchli, Staples and Toenniessen1984): SER = (lnL 2–lnL 1)/(t 2 t 1), where L 2 and L 1 represent, respectively, the stem length at times t 2 (18 d) and t 1 (1 d), and ln is the natural logarithm.
Determination of GSH level
GSH was assayed according to Griffith (Reference Griffith1980). Briefly, glutathione was extracted from 1 g leaves by their homogenization in 5 ml 5% (w/v) methaphosphoric acid, followed by centrifugation (10 min at 14,000 × g ). The pellet was resuspended in 200 µl potassium phosphate buffer (pH 7.5) and 50 µl of the samples were mixed with 100 mM potassium phosphate buffer, 0.2 mM NADPH, 1 mM DTNB (5,5′-dithiobis, 2 nitrobenzoic acid) and 2.5 mM EDTA to a final volume of 1 ml. The reaction was initiated by the addition of 0.25 unit of glutathione reductase and the increase in absorbance (due to 2-nitro-5-thiobenzoic acid formation) was followed for 4 min at 412 nm. Total glutathione contents were derived from the GSH standard curve (Griffith, Reference Griffith1980).
Determination of H2O2 level
H2O2 content was assayed according to Wolff (Reference Wolff1994), using the ferrous ion oxidation method (FOX1), based on ferrous ion oxidation by hydroperoxide. The xylenol orange binds ferric ions thus producing a blue-purple complex that absorb at 560 nm. Leaves and roots were homogenized in 5% (w/v) TCA (1 g tissue per 2 ml TCA) and then centrifuged for 10 min at 14,000 × g . Supernatant samples (200 µl) were mixed with 200 µl of 10% (w/v) TCA, mixed vigorously and centrifuged for another 10 min at 14,000 × g . Aliquots of the supernatant (50 µl) were mixed with the media containing 100 µM xylenol orange, 250 µM ammonium ferrous sulphate, 100 µM sorbitol, 25 mM H2SO4, incubated at room temperature for 30 min and the absorbance was read at 560 nm. H2O2 content was calculated on the basis of standard curve (0–5 µM of H2O2).
PCR-Cloning of genomic DNA fragments
DNA was extracted from the leaves using NucleoSpin® Plant kit (Macherey-Nagel, Hidlen, Germany) according to the manufacturer protocol. PCR was performed in 20 µl reactions mixtures containing 15–25 ng DNA, 100 pM of each primer, 200 µM of each dNTP, 10 mM Tris–HCl (pH 9.0), 2 mM MgCl2, 0.1% Triton X-100 and 0.25 unit Taq DNA polymerase. The PCR profile was 95°C for 2 min, 35 cycles of 90°C for 1 min, 57–68°C (depending on the T m value of the primers) for 1 min, 72°C for 1.5 min and a final extension at 72°C for 5 min. PCR products were purified with the Qiagen Miniprep kit (QIAGEN GmbH, Hilden, Germany) following the instructions of the manufacturer. The PCR-amplified DNA fragments were ligated with linear pGEM vector (Promega, Madison, WI, USA) using T4 DNA ligase (Promega, Madison) in a molar ratio of 1:10 (vector: insert). The ligation mixture (final volume 10 µl) contained 30 mM ligation buffer (ATP, 1 mM included), 1 µg DNA and 1 unit T4 DNA ligase. The cloned genes were sequenced at the sequence unit of Weizmann Institute of Sciences, Israel.
Analyses of gene transcription
Frozen tomato leaf tissue (50–80 mg) was grinded in liquid nitrogen using a mortar and pestle. RNA was extracted using the SV total RNA isolation kit (Promega, Madison) according to the manufacturer instructions. RNA amount was determined spectroscopically. RT–PCR was carried out using Qiagen One-Step RT–PCR kit (QIAGEN GmbH, Hilden, Germany).
Real-time RT–PCR assay conditions and analysis
Total RNA (1 µg) was used for first-strand cDNA synthesis. cDNA synthesis was carried out at 47°C for 1 h in a 20 µl solution composed of 50 mM Tris–HCl pH 8.3, 50 mM KCl, 10 mM MgCl2, 5 mM DTT, 400 ng random decamers primers, 0.5 mM dNTPs and 2 units of Reverse-iT™ RTase Blend (ABgene, Blenheim Road, Epsom KT19 9AP, UK). The RT enzyme was denatured for 10 min at 75°C. All PCR reactions contained SYBR Green (Molecular Probes; Applied Biosystems, Warrington, UK), 0.1 µM of each primer and 2 µl of a 1/100 dilution of the 18S cDNA (housekeeping gene) and 5.8 µl of γ-ECS (target gene) in a final volume of 20 µl. Real-time PCR was carried out using the ABI Prism 7000 SDS (Applied Biosystems equipment). Cycling conditions were as follows: 2 min at 50°C, 10 min at 95°C, 40 cycles of 15 s at 95°C, 1 min at 60°C. The relative quantification (RQ)-gene expression ratios were calculated using threshold (Ct; cycle number at which fluorescence rises above the background) of the target genes and the housekeeping gene, at treatment and control, according to the formula:^
 $${\rm RQ} = \underbrace{{{2^{\rm -}} \underbrace{{^{[(C{t_{{\rm TG}}}{\rm -} C{t_{{\rm HKG}}})}}} _{{}}}}_{{{\rm Treatment}}}\underbrace{{^{\rm -} \underbrace{{^{(C{t_{{\rm TG}}}{\rm -} C{t_{{\rm HKG}}})]}}} _{{}}}}_{{{\rm Control}}},$$
where Ct is the cycle threshold; HKG, the housekeeping gene; RQ, the relative quantification; and TG, the target gene.
Results
Structure of the Lem γ-ECS and Lpa γ-ECS orthologues in cultivated and wild tomatoes
Alignment of the Lem and Lpa orthologous γ-ECS genes revealed that the two genes are highly conserved (online Supplementary Fig. S6 and S7). The nucleotide sequences of all the 14 exons show 95–97% similarity. The major difference between these orthologues includes 590 and 160 bp indels in introns IV and IX, respectively. Alignment of the deduced amino acids of the two γ-ECS proteins exhibited high conservation, whereas out of 523 amino acids, only five residues variation occurred at the amino and carboxyl termini (online Supplementary Fig. S8).
Expression of γ-ECS in various organs of Lem and Lpa plants
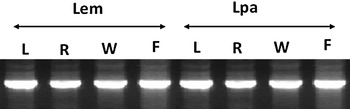
The expression of γ-ECS was found to be similar in leaves, roots, flowers and fruits of control plants of Lem and Lpa (Fig. 1).
γ-ECS transcription in leaves (L), roots (R), flowers (W) and fruits (F) of 1 cm diameter of Lem and Lpa. RT–PCR products were run on gel agarose.

The introgression line that harbours the Lpa γ-ECS orthologue
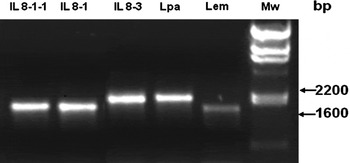
The existence of indels that differentiate the two orthologous genes were used to screen 76 ILs, for the line(s) that harbour the Lpa γ-ECS orthologue. IL 8–3 was identified as such (Fig. 2).
Identification of the introgressed line (IL) harbouring the Lpaγ-ECS orthologue. The primers used are the nested primers shown in online Supplementary Table S2 (Supplementary data) and correspond to exons IV and V, respectively.

Effect of NaCl and CdSO4 stresses on the growth of Lem, Lpa and IL 8–3 plants
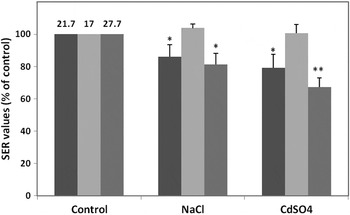
Plants of the parental species and of IL 8–3 were exposed to NaCl and CdSO4 stresses for 18 d. Stem length (Fig. 3) decreased in both NaCl- and CdSO4-treated plants of Lem and IL 8–3. Lpa stem length was not affected in response to salt stress.
Effect of NaCl and CdSO4 on stem length of Lem, Lpa and IL 8–3. The black ( ), light grey (
 ), and grey (
 ) bars represent Lem, Lpa and IL 8–3 plants, respectively. Measurements were taken 18 d after the addition of NaCl (100 mM) or CdSO4 (50 µM) to the growth medium. Numbers on control bars represent SER values. Values are the mean of six plants. The experiment was repeated two times. Based on t-test, values are significantly different at * P ≤ 0.01, ** P ≤ 0.001.

Effect of NaCl on the level of GSH and H2O2 in Lem, Lpa and IL 8–3 plants
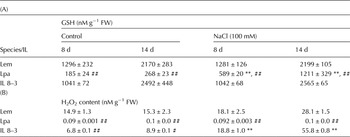
Glutathione level significantly was lower (***P < 0.001) in Lpa than in other two genotypes (Table 1). It increased in response to salt stress only in Lpa. H2O2 content was also much lower in Lpa than in other two genotypes (Table 1). It increased in response to salt treatment in plants of Lem and IL 8–3, and was not affected in those of Lpa.
Effect of NaCl stress on GSH (A) and H2O2 (B) leaf content. GSH and H2O2 contents were determined in crude leaf extracts of Lem, Lpa and IL 8–3 plants exposed to 100 mM NaCl for 8 and 14 d

*Values represent the means of three different plants ± SE. Each experiment was repeated three times. Based on t-test, values are significantly different at * (#) P ≤ 0.01, ** (##)P ≤ 0.001 (* and # indicated the significance differences in the table rows and columns, respectively).
Effect of NaCl and CdSO4 on the γ-ECS transcription
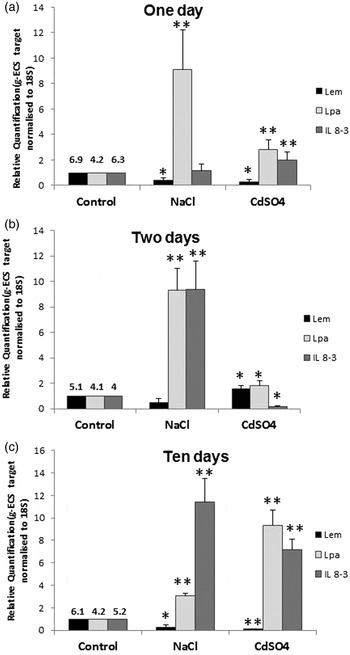
The transcription of γ-ECS remained unchanged during the 10-d experimental period in leaves of control Lem, Lpa and IL 8–3 plants (Fig. 4). The effects of NaCl and CdSO4 on the transcription of γ-ECS in leaves of the three genotypes was determined one (Fig. 4(a)), two (Fig. 4(b)) and 10 (Fig. 4(c)) d following the exposure of intact plants to these stresses. In response to NaCl stress, γ-ECS transcription decreased in Lem, increased tremendously (9-fold) during the first 2 days, and then decreased by about two-thirds up to the tenth day in Lpa, and increased only at the second day (9-fold, similarly to Lpa), but remained high at the tenth day in IL 8–3. Exposure to Cd resulted with some fluctuations in γ-ECS transcription in Lem and IL 8–3 during the first 2 d. However, at the tenth day it was significantly low (P < 0.001) in Lem and high (9 and 7-folds than the control) in Lpa and IL 8–3, respectively.
γ-ECS transcription in the leaves of control, NaCl (100 mM)- and CdSO4 (50 µM)-treated Lem, Lpa and IL 8–3 plants. RNA was isolated 1 (A), 2 (B) and 10 d (C) after the start of the stress treatments. The black ( ), light grey (
 ) and grey (
 ) bars represent Lem, Lpa and IL 8–3 plants, respectively. Numbers on control bars represent the cycle threshold absolute value (for details see ‘Materials and Methods’). Values are the mean of three different plants from one representative experiment. The experiments were repeated three times. Based on t-test analysis, values are significantly different at * P ≤ 0.01, ** P ≤ 0.001.

Effect of BSO on the γ-ECS transcription
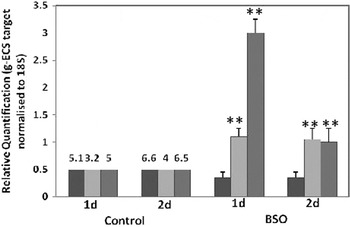
Leaves of Lem, Lpa and IL 8–3 were exposed for 1 and 2 days to BSO, a competitive inhibitor of the γ-ECS enzyme (Fig. 5). In control plants of the three genotypes the leaf γ-ECS transcription was approximately unchanged during the 2 days experimental period. In BSO-treated leaves, γ-ECS transcription remained practically unchanged in Lem as compared with the control. In Lpa, in contrast, it increased by more than 2-fold after 24 h and remained unchanged after one more day. However, in BSO-treated leaves of IL 8–3 it increased by 6-fold after 24 h, and then became similar to Lpa.
γ-ECS transcription in the leaves of control and stress-treated Lem, Lpa and IL 8–3 plants. RNA was isolated 1 and 2 d after the start of stress treatment by 1 mM BSO. The black ( ), light grey (
 ) and grey (
 ) bars represent Lem, Lpa and IL 8–3 plants, respectively. Numbers on control bars represent the cycle threshold absolute value (for details see ‘Materials and Methods’). Values represent the mean of three different plants in one representative experiment. The experiment was repeated three times. Based on t-test analysis, values are significantly different at ** P ≤ 0.001.

Discussion
Glutathione plays a vital role in plants growth, development and stress responses especially the detoxification of ROS (e.g. H2O2) via the ascorbic acid–glutathione cycle (Foyer and Noctor, Reference Foyer and Noctor2005) and glutathione peroxidases (Brigelius-Flohé and Maiorino, Reference Brigelius-Flohé and Maiorino2013).
Mittova et al. (Reference Mittova, Theodoulou, Kiddle, Gomez, Volokita, Tal, Foyer and Guy2003b) found that the improved ability of Lpa, the wild salt-tolerant tomato species, relatively to Lem, the cultivated species, to withstand NaCl-induced oxidative stress, depends at least in part, on its ability to accelerate GSH synthesis due to the upregulation of its γ-ECS, the key enzyme in this synthesis, under stress.
Comparison of the structure of the γ-ECS orthologues of the two tomato species shows that their respective exons and introns retained considerable sequence identities (online Supplementary Fig. S6). The major differences between them include 590 and 160 bp indels in introns IV and IX, respectively. These indels appear as potential deletions in Lem and as potential insertions in Lpa (data not shown). The 590 bp indel was found as a potential deletion also in S. pimpinellifolium and S. cheesmani, the two wild relatives of S. esculentum, but not in the rest of the wild Solanum species (data not shown). This finding suggests that the 590 bp indel was produced by the deletion in the common ancestor of the three coloured-fruit tomato species. Except Lpa and similarl to Lem, the 160 bp indel appears as a potential deletion in all the other wild Lycopersicon species.
Two independent results support the suggestion that tomato γ-ECS is encoded by a single gene: (a) Of the 76 ILs, only one introgressed line, IL 8–3, was identified as harbouring a Lpa γ-ECS orthologue (Fig. 2). (b) Five sets of primers, designed from cDNA sequences of tomato γ-ECS and used for PCR amplification, yielded five genomic DNA fragments that altogether constituted exactly the complete γ-ECS gene. It should be noted, however, that these results do not exclude the remote possibility of the existence of two identical, or nearly identical, neighbouring copies of this gene. The information on the number of γ-ECS gene(s) in other plant species is very limited. Similarly to the situation in tomato, Cobbett et al. (Reference Cobbett, May, Howden and Rolls1998) found that γ-ECS activity in Arabidopsis thaliana is also encoded by only a single gene.
The similarity of γ-ECS transcription in leaves, roots, flowers, and fruits of the two tomato species under control conditions (Fig. 1), characterized also the leaves, roots, nodules and flowers of Medicago under control conditions (Frendo et al., Reference Frendo, Mathieu, Van de Sype, Herouart and Puppo1999). Obviously this similarity of γ-ECS transcription in the various organs does not necessarily suggest a similar level of GSH in them, since that level may be influenced by additional factors as was shown by Noctor et al. (Reference Noctor, Gomez, Vanacker and Foyer2002) and Ferretti et al. (Reference Ferretti, Destro, Tosatto, La Rocca, Rascio and Masi2009).
In IL 8–3, the Lpa γ-ECS orthologue is part of a chromosomal segment of Lpa, which is harboured in the genetic background of Lem. The transcription of the Lem γ-ECS orthologue, which exists in its original genetic background (Lem), and of the Lpa γ-ECS orthologue, while being harboured in the genetic background of either Lpa or IL 8–3, were compared in leaves upon challenging Lem, Lpa and IL 8–3 plants for 10 d with salinity (NaCl) and heavy metal (CdSO4) stresses (Fig. 4), both are known to induce oxidative stress. Such a comparison allows some knowledge on the position of the controlling site relatively to the transcribed gene. The finding that the transcription of Lpa γ-ECS orthologue increased in response to salt and Cd stresses in both Lpa and in IL 8–3 and that the transcription of the Lem γ-ECS orthologue decreased in response to these two stresses, suggests that the mutation(s) which caused this difference in the response of the two orthologues to the salinity and heavy metal stresses, occurred in a cis-regultory element(s) located relatively close to γ-ECS. However, the finding that γ-ECS mRNA level increased in Lpa and IL 8–3 and remained unchanged in Lem under NaCl stress, while GSH level increased in Lpa only and remained comparable in Lem and IL 8–3 under NaCl stress, suggests that the γ-ECS orthologues differ mainly in the regulation of their transcription and not at the post-transcriptional or translational levels. The changes in the levels of reduced/oxidized GSH, inhibition/activation of enzymes and stress parameters constitute a good indicator of an early response (hours but not days) to metal stress in developed plants exposing to Cd, and this showed a better understanding of the signalling pathway with alterations in antioxidant mechanisms by Cd in IL 8–3 plants.
The decrease of growth in both Lem and IL 8–3 by NaCl or CdSO4 stresses (Fig. 3), suggests that the replacement in IL 8–3 of Lem γ-ECS orthologue with the stress-upregulated Lpa γ-ECS orthologue was not enough to prevent this decrease. This result is not surprising since growth tolerance to abiotic stresses such as those of NaCl or CdSO4 requires the simultaneous operation of many genes: those which control the tolerance mechanism(s) unique to the stress, and those of the antioxidative system, which operates as an additional line of defence.
NaCl-treated IL 8–3 plants responded similarly to NaCl-treated Lem plants also with respect to GSH and H2O2 levels (Table 1). H2O2 levels in NaCl-treated IL 8–3 plants was even higher compared with Lem. The findings that γ-ECS transcription was differently affected in Lem and IL 8–3 by NaCl and Cd stresses, but possess similar H2O2 content (although slightly higher in IL 8–3), suggests that the signal transduction pathway(s) leading from NaCl/Cd to γ-ECS is (are) different from the one leading from H2O2 in, at least, a cis-regulatory element of γ-ECS. While the former pathway(s) are expected to include the cis-element which is mutated and consequently non-functional in Lemγ-ECS, the H2O2 pathway might include instead another cis-element, which is functional in both Lemγ-ECS and Lpaγ-ECS. This finding also suggests that H2O2 does not function as an intermediate messenger in the NaCl/Cd signalling pathway(s). As expected, the change of H2O2 level was negatively related to that of GSH. This result suggests that although γ-ECS is the rate-limiting step in GSH biosynthesis (Noctor et al., Reference Noctor, Gomez, Vanacker and Foyer2002), the replacement of Lem γ-ECS orthologue with the stress-upregulated Lpa γ-ECS orthologue in IL 8–3, similarly to its effect on growth, was not enough to change its Lem characteristic response with respect to GSH level.
BSO, which specifically and irreversibly inhibits the activity of the γ-ECS enzyme by its binding to the active site (Kocsy et al., Reference Kocsy, von Ballmoos, Suter, Ruegsegger, Galli, Szalai, Galiba and Brunold2000; Soltaninassab et al., Reference Soltaninassab, Sekhar, Meredit and Freeman2000), increased the transcript level in Lpa γ-ECS, in either Lpa and Lem (IL 8–3) genetic backgrounds, and did not affect it in Lem γ-ECS (Fig. 5). The upregulation of Lpa γ-ECS transcription can be explained by the decrease of GSH due to the inhibition of the γ-ECS enzyme and the consequent reduction of GSH/oxidized glutathione (GSSG) ratio, which plays a central role in γ-ECS regulation. According to Gomez et al. (Reference Gomez, Noctor, Knight and Foyer2004), this ratio can cause changes in gene transcription either directly or indirectly via interaction with regulatory proteins and/or transcription factors.
Conflict of Interest
The authors have no conflicts of interest to disclose.
Supplementary material
To view supplementary material for this article, please visit https://doi.org/10.1017/S1479262116000125
Acknowledgements
The authors are grateful to Professor Moshe Tal, Department of Life Sciences, Dr Micha Volokita, the National Institute for Biotechnology in the Negev, and Dr Micha Guy, the Institutes for Desert Research, all three of Ben Gurion University of the Negev, Beer Sheva, Israel, for constructive criticism during the work and helpful comments on the manuscript, and to Professor Dani Zamir, the Faculty of Agriculture, Rehovot, Israel, for providing tomato seeds and the ILs.
This work was partially funded by The Council for Higher Education – Planning and Budgeting Committee, Israel.