Many data-driven risk prediction models offering the promise of improved patient outcomes have been evaluated retrospectively, but few have been evaluated prospectively. Reference Kelly, Karthikesalingam and Suleyman1–Reference Nagendran, Chen and Lovejoy4 Models that are not evaluated prospectively are susceptible to degraded performance because of data-set shifts. Reference Finlayson, Subbaswamy and Singh5 Shifts in data can arise from changes in patient populations, hospital procedures, care delivery approaches, epidemiology, and information technology (IT) infrastructure. Reference Brajer, Cozzi and Gao2,Reference Menon, Perry and Motyka6
In this work, we prospectively evaluated a data-driven approach for Clostridioides difficile infection (CDI) risk prediction that had previously been shown to achieve high performance in retrospective evaluations at 2 large academic health centers. Reference Nagendran, Chen and Lovejoy4 This approach models the likelihood of acquiring CDI as a function of patient characteristics. However, this evaluation occurred on retrospective data, and prospective validation is necessary because other models that have not been prospectively evaluated often performed worse when deployed. Reference Wong, Ötleş and Donnelly7 Risk predictions can guide clinical interventions, including antibiotic de-escalation and duration, β-lactam allergy evaluation, and isolation. Reference Dubberke, Carling and Carrico8
Using this approach, we trained models for both institutions on initial retrospective cohorts and performed evaluations on retrospective and prospective cohorts. We compared the prospective performance of these models to their retrospective evaluations to determine their robustness with respect to data-set shifts. By showcasing the robustness of this approach, we provide support for utilizing this approach in clinical workflows.
Methods
This study included retrospective and prospective periods for adult inpatient admissions to Massachusetts General Hospital (MGH) and Michigan Medicine (MM). As previously described, Reference Oh, Makar and Fusco9 patient demographics, admission details, patient history, daily hospitalization information, and exposure and susceptibility to the pathogen (eg, antibiotic therapy) were extracted from the electronic health record (EHR) of each institution and were preprocessed. To consider hospital-onset CDI, we excluded patients who tested positive in the first 2 calendar days of their admission, stayed <3 days, or tested positive in the 14 days before admission. Testing protocols are described in the supplement. A data-driven model to predict risk of hospital-onset CDI was developed for each institution. Each model was based on regularized logistic regression and included 799 and 8,070 variables at MGH and MM, respectively. More aggressive feature selection was applied at MGH to prioritize computational efficiency. Reference Oh, Makar and Fusco9 For the retrospective evaluation, data were extracted from May 5, 2019, to October 31, 2019, at MGH and from July 1, 2019, to June 30, 2020, at MM. For the prospective evaluation, we generated daily extracts of information for all adult inpatients from May 5, 2021, to October 31, 2021, at MGH and from July 1, 2020, to June 30, 2021, at MM, keeping the months consistent across validation periods. We used different periods at the 2 institutions because of differences in data availability.
When applied to retrospective and prospective data at each institution, the models generated a daily risk score for each patient. We evaluated the discriminative performance of each model at the encounter level using the area under the receiver operator characteristic curve (AUROC). Using thresholds based on the 95th percentile of the retrospective training cohort, we measured the sensitivity, specificity, and positive predictive value (PPV) for each model. 95% confidence intervals were computed using 1,000 Monte-Carlo case-resampled bootstraps. We compared the models’ retrospective and prospective performances to understand the impact of any shifts in the data set.
This study was approved by the institutional review boards of both participating sites (University of Michigan, Michigan Medicine nos. HUM00147185 and HUM00100254 and Mass General Brigham no. 2012P002359) with waivers of informed consent.
Results
After applying exclusion criteria, the final retrospective cohort included 18,030 admissions (138 CDI cases) at MGH and 25,341 admissions (158 CDI cases) at MM. The prospective cohort included 13,712 admissions (119 CDI cases) at MGH and 26,864 admissions (190 CDI cases) at MM. The demographic characteristics of the study populations are provided (Supplementary Table 1 online).
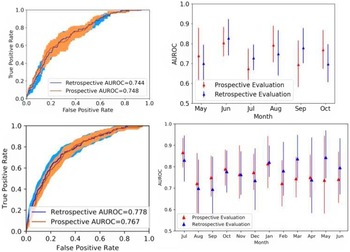
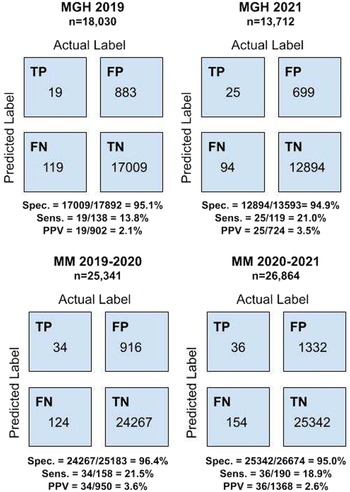
At MGH, the model achieved AUROCs of 0.744 (95% confidence interval [CI], 0.707–0.781) in the retrospective cohort and 0.748 (95% CI, 0.707–0.791) in the prospective cohort. At MM, the model achieved AUROCs of 0.778 (95% CI, 0.744–0.814) in the retrospective cohort and 0.767 (95% CI, 0.737–0.801) in the prospective cohort. The AUROCs for predicting CDI risk on both retrospective and prospective cohorts were similar each month and did not exhibit significant monthly variation throughout either evaluation period (Fig. 1). At MGH, the classifiers’ sensitivity, specificity, and PPV were 0.138, 0.951, and 0.021 on the retrospective data and 0.210, 0.949, and 0.035 on the prospective data. At MM, the classifiers’ sensitivity, specificity, and PPV were 0.215, 0.964, and 0.036 on the retrospective data and 0.189, 0.950, and 0.026 on the prospective data (Fig. 2).
Area under the receiver operator characteristic curve (AUROC) at Massachusetts General Hospital (MGH) and Michigan Medicine (MM) in retrospective and prospective evaluations. The figures on the left show a comparison of AUROC in retrospective and prospective evaluations MGH (upper) and MM (lower). The 95% confidence intervals (CI) for the AUROC are shaded. The figures on the right show a monthly AUROC comparison at MGH (upper) and MM (lower). The 95% CI for the AUROC are represented by error bars.

Confusion matrices at Massachusetts General Hospital (MGH) and Michigan Medicine (MM) in retrospective and prospective evaluations. The figures on the left display confusion matrices, sensitivity, specificity, and positive predictive values for retrospective evaluations at MGH (upper) and MM (lower). The figures on the right display the same metrics for prospective evaluations at MGH (upper) and MM (lower).

Discussion
We evaluated 2 data-driven institution-specific CDI risk prediction models on prospective cohorts, demonstrating how the models would perform if applied in real-time; that is, how the models would perform generating daily risk predictions for adult inpatients if they were implemented with daily data extracts. The models at both MGH and MM were robust to shifts in the data set. Notably, the prospective cohorts included patients admitted during the coronavirus disease 2019 (COVID-19) pandemic, whereas the retrospective cohorts did not. Surges in hospital admissions and staff shortages throughout the pandemic affected patient populations and hospital procedures related to infection control. The consistent performance of the models during the COVID-19 pandemic increases confidence that the models are likely to perform well when integrated into clinical workflows. Clinicians can utilize risk predictions to guide interventions, such as isolation and modifying antibiotic administration, and limited resources must be allotted among patients most at risk. Reference Dubberke, Carling and Carrico8 These models should be applied to patients meeting the inclusion criteria, and application to a broader cohort may affect the results.
Because implementing this methodology requires significant IT support, initial deployment is likely to occur through larger hospitals or EHR vendors, a common approach for risk-prediction models. Reference Wong, Ötleş and Donnelly7 Although the methodology is complex, it is handled by the software developers. The interface with clinicians can be quite simple; the end user only receives a prediction for each patient.
The PPV was calculated using a threshold based on the 95th percentile of retrospective cohorts. The PPV is between 2.625 and 6 times higher than the pre-test probability, an appropriate level for some interventions, such as β-lactam allergy evaluations. For interventions requiring higher PPVs, higher thresholds should be used.
Despite the importance of evaluating models prior to deployment, models are rarely prospectively or externally validated. Reference Kelly, Karthikesalingam and Suleyman1–Reference Nagendran, Chen and Lovejoy4 Other prior retrospective external validation attempts of models for incident CDI did not replicate the original performance. Reference Perry, Shirley and Micic10 When performed, prospective and external validation can highlight model shortcomings before integration into clinical workflows. For instance, an external retrospective validation of a widely utilized sepsis prediction model showed that the computed scores at a new institution differed significantly from the model developer’s reported validation performance. Reference Wong, Ötleş and Donnelly7 This model was not tailored to specific institutions, but such discrepancies may still arise with institution-specific models. Especially, when there are many covariates, models can overfit to training data and are therefore susceptible to shifts in the data set. In our case, the differences between retrospective and prospective performances of both models in terms of AUROC were small with large overlapping confidence intervals.
Although the successful prospective performance of 2 institution-specific CDI risk prediction models is encouraging, it does not guarantee that the models will perform well in the face of future shifts in the data set. Epidemiology, hospital populations, workflows, and IT infrastructure are constantly changing; thus, deployed models should be carefully monitored for performance over time. Reference Ötleş, Oh and Li11
Supplementary material
To view supplementary material for this article, please visit https://doi.org/10.1017/ice.2022.218
Acknowledgments
The authors thank Noah Feder, BA, for assistance with manuscript preparation and administrative support.
Financial support
This study was funded by Quanta as well as grants from the National Institutes of Health (grant nos. T32GM007863 to E.Ö. and AI124255 to V.B.Y., K.R. and J.W.)
Conflicts of interest
E.Ö. reports a patent pending for the University of Michigan for an artificial intelligence-based approach for the dynamic prediction of health states for patients with occupational injuries. Dr Rao is supported in part from an investigator-initiated grant from Merck; he has consulted for Bio-K+ International, Roche Molecular Systems, Seres Therapeutics, and Summit Therapeutics.