1 Introduction
Since the early 1990s, the Italian pension system has been going through a reform process aimed at improving its long-term sustainability and redressing its main problems. The reform has increased – particularly for younger generations – individual responsibility for the accumulation of retirement wealth. Two main features characterize the reform. The first is a shift from a Defined Benefit to a Defined Contribution method. The latter determines benefits according to ‘actuarial equivalence’, i.e., to the (capitalized worth of) payroll taxes contributed during one's entire working career and to the worker's retirement age, and results, on average, in much lower and more uncertain replacements ratios as compared to past and current benefits in payment, which are determined on the basis of (an average of) late-career earnings. The second feature is a greater role for pension funds in restoring an adequate level of future pension benefits. Participation in (privately managed) pension plans is voluntary but encouraged through fiscal incentives and suitable design of default options; workers have to decide both how much to contribute and how to allocate their pension wealth, requiring greater financial sophistication in both savings and investment management. Workers more heavily affected by the Pay-As-You-Go system reform will face a higher risk that their savings will not be sufficient to finance consumption during retirement, and this risk mainly concerns low-income workers (Cappelletti and Guazzarotti, Reference Cappelletti and Guazzarotti2010).
This new situation is taking place at a time when technological progress, financial innovations, and increasing market integration are making financial products more complex. It prompts questions about households’ preparedness, the level of their financial knowledge, their ability to deal with financial decisions, and the impact of ignorance on savings. Several institutions (e.g., the Bank of Italy, the Authority for the Italian securities market [Consob], and the Supervising Authority on Pension Funds [Covip]) have expressed concerns about the ability of citizens to face the current challenges, and initiatives have been promoted to address the issue of financial illiteracy, in terms of both regulation and financial education (Banca d'Italia, 2009; Banca d'Italia et al., 2010).
Our paper measures the level and distribution of financial literacy among the Italian population, and investigates its determinants and its effects on retirement planning behaviour. Specifically, we examine whether financial literacy impacts the decision to join a pension plan, drawing on the 2006 wave of the Bank of Italy's Survey on Household Income and Wealth (SHIW).
The results show that most individuals lack knowledge of basic financial concepts, and that they seem more familiar with inflation and stocks than with interest compounding. The distribution of financial literacy among the population presents features similar to findings in other countries (Bernheim, Reference Bernheim, Mitchell and Schieber1998; Lusardi and Mitchell, Reference Lusardi and Mitchell2007, Reference Lusardi, Mitchell, Lusardi and Mitchell2011; Australia and New Zealand Banking Group, 2008; van Rooij et al., Reference van Rooij, Lusardi and Alessie2011), with women and individuals with low educational attainment having the worst performance on financial literacy measures. A specific Italian feature is the regional difference in financial literacy between residents of the North–Centre and the South, with North–Centre residents having higher literacy levels. As for retirement planning, financial literacy positively and significantly increases the probability of participating in a pension fund, and this effect is robust to controlling for financial literacy endogeneity. In a companion paper (Fornero and Monticone, Reference Fornero and Monticone2011), we provide more extensive evidence exploiting the 2008 wave of the SHIW and analysing a 2007 reform aimed at encouraging pension plan participation.
The rest of the paper is organized as follows. Section 2 describes the SHIW data. Section 3 reports the empirical evidence, in terms of how financially literate Italians are, which population sub-groups know the least, and the effects of financial literacy on saving for retirement through pension plan participation. Section 4 concludes.
2 The data
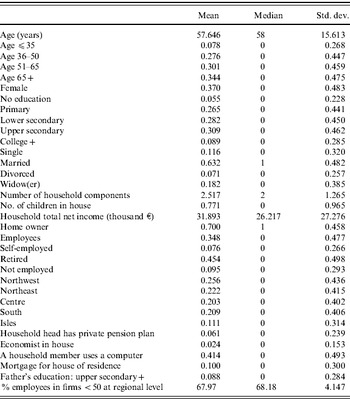
Every 2 years, through the SHIW, the Bank of Italy collects detailed data on household demographics, consumption, income, and wealth for a representative sample of the Italian population. In 2006, the survey covered 7,768 households (sampling units) and 19,551 individuals.Footnote 1 The average age of household heads is about 57, 37% are females, 64% are married, 32% completed high school, and only about 9% have a university degree (or more). The average household is composed of 2.5 people. Median (net) household income is about €26,000 and 70% of households own their house, in line with aggregate data. About 45% of the household heads were already retired at the time of interview, 35% were working as employees, and 7% were self-employed.
In the 2006 wave, in addition to the standard survey questions, about half of the sample (3,992 households whose head was born in an even year) was given an extra module on financial literacy, to be answered by the individual identified as the household head (i.e., ‘the person primarily responsible for the household budget’). Even though the SHIW survey has quite a long longitudinal component, financial literacy questions were included in the 2006 wave for the first time, and thus we have no concerns about respondent sensitivity to the topic due to exposure in previous waves of the survey.
The interviews were conducted by a specialized company between March and October 2007.Footnote 2 Data are mainly collected in person with the aid of computers, using the Computer-Assisted Personal Interviewing Program (CAPI). This is used for the vast majority of the interviews (about 79%). The remaining interviews are conducted using paper-based questionnaires (Paper-And-pencil Personal Interviewing (PAPI)), which the survey company subsequently transfers to a computer using the CAPI Program as the input screen (Banca d'Italia, 2010). Even though these methodologies should be more effective than telephone interviews in allowing the respondents to understand and think about the financial literacy questions, respondents are not shown cards with the questions, and so they do not read the questions. Individuals do not get incentives to answer.
3 Empirical evidence
3.1 How financially literate are individuals in Italy?
3.1.1 Measurement
For the sake of comparison, we will exploit only three out of the six financial literacy questions included in the 2006 SHIW survey, choosing those most similar to the ones devised for the US Health and Retirement Study (HRS) by Annamaria Lusardi and Olivia Mitchell (Lusardi and Mitchell, Reference Lusardi, Mitchell, Lusardi and Mitchell2011). While the two questions on inflation and interest compounding use almost the same wording as the corresponding questions in the HRS, the 2006 SHIW does not contain a question on risk diversification, as is the case in the HRS.Footnote 3 For the purposes of this study, the question about understanding of risk was replaced with another one capturing stock market knowledge (question 3). The precise wording of the three financial literacy questions is reported below.
1. Understanding of Interest Rate. Imagine leaving €1,000 in a current account that pays 2% annual interest and has no charges. What sum do you think will be available at the end of 2 years? Less than €1,020/Exactly €1,020/More than €1,020/Don't know.
2. Understanding of Inflation. Imagine leaving €1,000 in a current account that pays 1% interest and has no charges. Imagine also that inflation is running at 2%. Do you think that if you withdraw the money in a year's time you will be able to buy the same amount of goods as if you spent the €1,000 today? Yes/No, I will be able to buy less/No, I will be able to buy more/Don't know.
3. Understanding of Stocks. Imagine you have only equity funds and stock market prices fall. Are you …? [Read aloud] Better off/Worse off/As well off as before/Don't know.
Note that ‘Don't Know’ (DK) is always a response option. This means that respondents are not forced to pick an answer, thus minimizing guessing. Among the coded answers, there is no explicit category for ‘refusals’. Only two observations (out of 3,992) report missing answers for the financial literacy questions, and we thus drop the corresponding households from the analysis.
3.1.2 Descriptive statistics
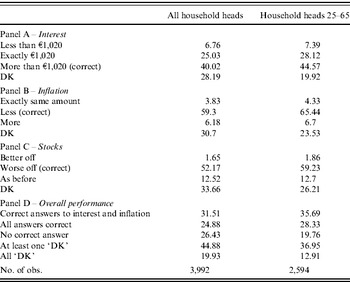
Table 1 presents the answers to the financial literacy questions. Panel A of Table 1 reports the answers to the interest compounding question, showing that 40% of respondents gave a correct answer, whereas about 28% did not know the answer. Among those who answered incorrectly (32%), 25% answered ‘exactly €102’, which represents a relatively less serious mistake than ‘less than €102’ (7%). The answers to the inflation question are shown in panel B. Almost 60% gave the correct answer, 30% did not know the answer, and 10% provided an incorrect answer. Finally, for the question about stocks, slightly more than half of the sample (52%) answered correctly (panel C). Overall, about one-fourth of the sample gave three correct answers, one-fourth gave no correct answers, and almost one-fifth reported not knowing the answer to all of the questions (panel D). Based on comparisons of the answers to the three questions, Italians seem to be more familiar with inflation and stocks than with interest compounding. This may be related to individual memories of an inflationary environment, as a large share of the sample experienced relatively high inflation during their prime age (in the 1970s and 1980s). On the contrary, knowledge of the stock market is more unexpected, given that Italian households’ propensity to hold risky financial assets is quite low: as of 2008 only 9.2% of households held government securities; 6.1% held shares (directly); and 19.2% held risky assets, including private bonds, stocks, funds, and the like (Banca d'Italia, 2010).
Answers to the financial literacy questions (percent)

Source: SHIW 2006 – Weighted data.
We also note that the topics covered by these questions are not taught in standard lower-secondary school programmes and only in some types of high schools, and so respondents can hardly rely upon knowledge acquired through formal education in answering the questions.
3.2 Who knows the least?
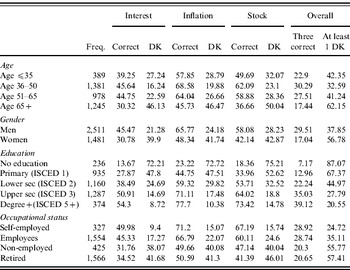
Table 2 shows financial literacy by socio-demographic characteristics. The financial literacy age profile is hump shaped, with a peak in performance from age 36 to age 50. Men are more knowledgeable than women for all questions, and the difference is always statistically significant at the 1% level of significance. As in other countries, women have a very high proportion of DK responses. On the one hand, the fact that all respondents are household heads should reduce gender differences in knowledge, because this sample is relatively more homogeneous than a sample of the general population. On the other hand, the female and male sub-samples are quite different not only in terms of occupational status and education (females are less educated and more likely to be non-employed) but also in their marital status (80% of males are married and 6% are widowers, whereas only 33% of female respondents are married and about 40% are widows). If we examine the gender gap more thoroughly by breaking the sample into socio-economic groups, we observe that differences in performance between men and women almost disappear when we consider only employed individuals (employees or self-employed) or singles, while the gap is still remarkable and statistically significant among respondents with at least a high-school education and in the sub-sample of married household heads. This suggests that gender disparities in financial literacy are at least in part related to socio-economic status.
Performance by socio-demographic characteristics (percent)

Source: SHIW 2006 – Weighted data. Sample: all household heads (N=3,992).
Financial literacy strongly monotonically increases with level of education. This is true when looking at both correct and DK answers. For instance, only 13% of those with at most a primary education (representing 26% of household heads) could answer all three questions correctly, compared with 39% among those with a university degree.
The self-employed (including small business owners, owners or members of a family business, and members of ‘liberal professions’ such as lawyers, architects, and so forth) display better knowledge than employees; they are wealthier and can be assumed to be more accustomed to managing their personal/business finances (however, the difference in financial literacy between employees and the self-employed is almost never statistically significant). The fact that employees perform better than retired respondents might hide age effects and declining cognitive abilities. The non-employed (including the unemployed, homemakers, students, and so on) have the lowest performance in all measures.
Housing tenure is also related to financial literacy (not reported). The rate of home ownership in Italy is very high (around 71% according to the 2001 census (Istat, 2004) and 70% in the SHIW sample used for this analysis), and housing equity constitutes – not including social security wealth – the largest fraction of household wealth. Home owners display higher financial literacy than renters, consistent with the fact that financial knowledge is usually associated with higher household wealth (van Rooij et al., Reference van Rooij, Lusardi and Alessie2008). Moreover, among home owners, households currently paying a mortgage demonstrate higher knowledge than those who are not, which suggests that contracting housing debts may provide a learning opportunity.Footnote 4
3.2.1 Regional disparities in financial literacy
A peculiarity of Italy is the stark disparity between northern and southern regions as captured by important economic and social indicators, such as employment rates, per capita income, and average education. Financial literacy is no exception.
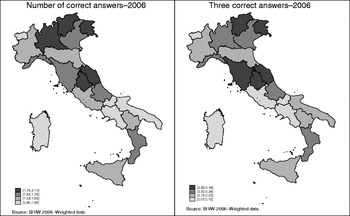
Figure 1 depicts the financial literacy distribution across Italian regions, both for the average number of correct answers to financial literacy questions and for the proportion of three correct answers. The four categories represent quartiles of each variable. Even though the main difference in financial literacy is found between the South and the Centre–North, there is substantial variation across regions beyond the simple North–South divide.
Financial literacy at the regional level.

Since the geographical distribution of financial literacy resembles quite closely that of economic development and industrial activity, we estimate an econometric model in which financial literacy is allowed to depend on socio-demographics and some regional macro-economic indicators.Footnote 5 Without any attempt to establish causality, we find that financial literacy is strongly correlated with the log of per capita GDP, the employment rate, and the share of employees working in small firms (up to 50 employees) at the regional level, controlling for households’ socio-demographic characteristics. This result is consistent with the cross-country evidence of Jappelli (Reference Jappelli2010), showing a positive link between economic literacy and economic development.
3.3 Does financial literacy matter?
Recent literature has shown that financial literacy is associated with a wide range of financial decisions, such as stock market participation, portfolio diversification, and the tendency to avoid over-indebtedness (Kimball and Shumway, Reference Kimball and Shumway2007; Guiso and Jappelli, Reference Guiso and Jappelli2008; Lusardi and Tufano, Reference Lusardi and Tufano2008; van Rooij et al., Reference van Rooij, Lusardi and Alessie2011). Moreover, Lusardi and Mitchell (Reference Lusardi and Mitchell2007) have shown that financial literacy is positively related to planning for retirement and that planners have significantly higher wealth at retirement than non-planners (where planning affects accumulation, and not vice versa). This evidence is corroborated by other studies pointing out the role of the propensity to plan for wealth accumulation (Ameriks et al., Reference Ameriks, Caplin and Leahy2003), and documenting a positive and significant effect of financial literacy on wealth (van Rooij et al., Reference van Rooij, Lusardi and Alessie2008).
An aspect of planning and saving for retirement that deserves attention is pension plan participation. For instance, Agnew et al. (Reference Agnew, Szykman, Utkus and Young2007) study pension plan participation in the US, finding that in voluntary enrolment 401(k) plans, the effect of financial literacy on savings is substantial, and that under automatic enrolment, low levels of literacy are strongly linked to employee decisions to quit their employer's savings plan.
In this section, we investigate the role of financial literacy on pension plan participation in Italy; an issue that the large cuts in public pension benefits due to pension reforms has brought to the fore. Despite rather generous tax treatment, participation in pension funds is still quite low (Covip, 2008). This has certainly to do with high mandatory payroll tax rates (33% for employees and 20% for self-employed), generous pension benefits, and a general mistrust towards financial markets (Castellino and Fornero, Reference Castellino and Fornero2001, Reference Castellino, Fornero and Sanhari Mishra2008).
To counteract rather disappointing participation rates, in 2007 a reform of the system of severance payments (Trattamento di Fine Rapporto (TFR)) was introduced, aimed at encouraging higher take-up.Footnote 6 Participation rates increased after the reform, but not as much as expected.Footnote 7 There were about 3.2 million pension plan participants (of which 2.1 million were private sector employees) in 2006, and this grew to 4.8 million in 2008 (3.6 million private sector employees). This implies that the participation rate over the total employed population went from approximately 14% in 2006 to 21% in 2008.Footnote 8 An increasing participation rate emerges also from the SHIW data, which shows participation rates among all workers at about 11% and 13.5% in the 2006 and 2008 samples, respectively.Footnote 9 Given the relevance of private pension take-up in Italy, the rest of the paper is devoted to examining the relationship between financial literacy and pension plan participation and the effects of literacy on retirement planning.Footnote 10
3.3.1 Pension plan participation
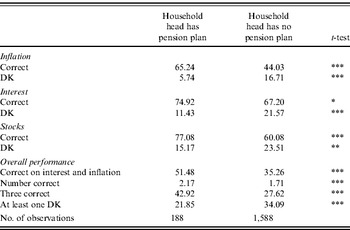
To investigate the effect of financial literacy on pension plan participation, we use data from the 2006 SHIW. The analysis is restricted to the sample of employees and self-employed individuals aged 25–65, excluding the unemployed and other respondents out of the labour force (e.g., retirees, students, and homemakers). Eliminating respondents outside the 25–65 age range reduces the sample from 3,992 observations (all household heads) to 2,594, and further eliminating those not in the labour force leaves us with 1,776 observations. Simple univariate statistics reported in Table 3 show that financial literacy is higher for respondents with a supplementary pension than for those without, and the difference between the two groups is highly statistically significant for most measures.
Financial literacy by pension plans participation (percent)

Source: SHIW 2006 – Weighted data. Significance:
*** P<0.01, **P<0.05, *P<0.1. Sample: household head in the labour market in the age class 25–65 (N=1,776). The table reports the percentage of correct/DK answers for each question, by pension plan participation.
A multivariate analysis of the impact of financial literacy on pension plan participation is conducted estimating a linear probability model by ordinary least squares (OLS) as follows:
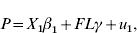
in which P takes the value of one if the respondent (household head) participates in a private pension scheme at the time of interview. Financial literacy FL is measured in three ways: first, we use a dummy that takes the value of one when the respondent is able to answer all three questions correctly; second, we use a variable counting the number of total correct answers to the three questions (taking values from 0 to 3); third, we use three dummy variables indicating whether each financial literacy question was answered correctly. X1 is a vector of covariates, including a second-order polynomial in age, a gender dummy for females, four dummies indicating the highest level of education attained by the respondent, marital status dummies, the number of children living in the household, household income quartiles dummies, a dummy taking the value of one for home owners (as a proxy for household wealth), a dummy for being self-employed, and regional dummies.
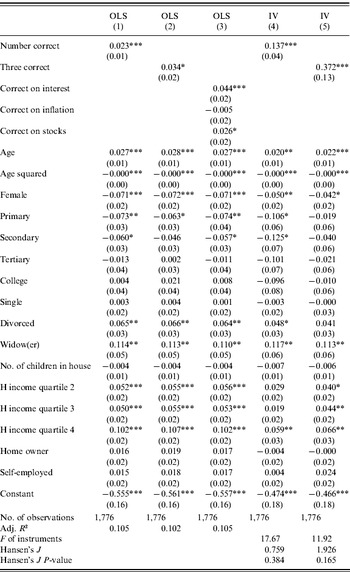
Table 4 reports the OLS estimation results. The first and second columns show that an additional correct answer to the financial literacy questions raises the probability of pension plan participation by 2 percentage points, while being able to answer all three questions correctly increases the chance of participation by 3 percentage points (but its effect is significant only at 10% level). The third column shows that the effect of the two aggregate financial literacy measures reported in columns 1 and 2 is mostly driven by being able to correctly answer the interest question (increasing the probability of participation by 4.4 percentage points), while the dummy measuring knowledge of stocks is significant only at 10%, and the dummy measuring knowledge of inflation is not significant.Footnote 11 This is consistent with the fact that the interest question has the lowest proportion of correct answers (see Table 1), and is therefore more likely to differentiate between individuals with low or high literacy.
Multivariate analysis of pension plan participation

Source: SHIW 2006. Linear probability model estimated by OLS/GMM. Robust std. errors are reported in parentheses. Significance:
*** P<0.01, **P<0.05, *P<0.1. Sample: household head in the labour market in the age class 25–65. Additional controls not reported: 20 regional dummies.
Moreover, pension plan participation is associated with being male and the age profile is slightly concave. Higher income is positively associated with the probability of having a pension plan, while home ownership and self-employment have no effect.
Some other factors might affect the propensity to join a pension plan, such as risk preferences and expectations about longevity, retirement age, and public pension system replacement rate (Guiso et al., Reference Guiso, Jappelli and Padula2009). In a separate regression (not reported) we add a dummy for being very risk tolerant, a dummy for the expected replacement rate and the expected retirement age elicited by the SHIW, two dummy variables indicating whether the respondent's parents are alive and their interactions with parents’ age as proxies for longevity (according to the life-cycle model, individuals who expect to live longer should be more likely to retire later, to save more for retirement, or a combination of the two). Risk-tolerant individuals show a higher probability of pension plan participation, while those expecting to retire later are less likely to participate. The expected replacement rate and proxies for longevity have no effect. After controlling for these additional variables, the effect of financial literacy is basically unchanged with respect to Table 4.
As a second step, we allow for the possibility that financial literacy is endogenously determined. Jappelli and Padula (Reference Jappelli and Padula2011) illustrate theoretically the endogeneity of financial literacy with respect to saving decisions, modelling the joint accumulation of literacy and wealth over the life cycle. In our case, financial literacy endogeneity may derive from experience (i.e., experience of opening and managing one's pension plan), from individuals’ efforts to learn to better manage their investments, or from an unobserved factor simultaneously driving both the decision to join a pension plan and the decision to acquire better financial knowledge (e.g., time preferences or a taste for financial issues). Moreover, financial literacy is difficult to measure and it is likely to be measured with error, possibly leading to a downward bias in the OLS estimate of financial literacy.
Building on (1) we estimate the following linear probability model using generalized method of moments (GMM), accounting for the potential endogeneity of financial literacy:


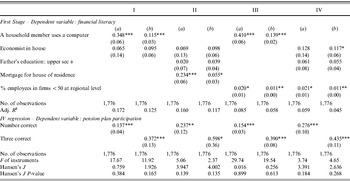
where X 1 is a vector of controls as before and X 2 is a vector of financial literacy instruments. Despite the great difficulty in finding valid instruments for financial literacy, we propose two variables related to the cost of learning and acquiring financial knowledge and information. The instruments for financial literacy include a dummy taking the value of one if (at least) one household member has a degree in economicsFootnote 12, and a dummy taking the value of one if (at least) one household member uses a computer (either at home, at work, or elsewhere). The validity of these instruments rests on the hypothesis that the presence of an economist and/or a computer user in the household makes it easier for the respondent to acquire knowledge and information about financial investments, while not being determined by respondents’ decision to join a pension fund. This is supported by the results of the Hansen's J test, which do not reject the null of instruments validity (P-value 0.384 and 0.165 for the two financial literacy measures). Moreover, the F test measuring the predictive power of the instruments in the first stage regression is relatively high (>10), suggesting that instruments are not weak. First-stage estimates are reported in column I of Table A2.Footnote 13Table 4 (fourth and fifth columns) reports the GMM estimation results. Giving an additional correct answer raises the probability of participation by almost 14 percentage points.Footnote 14 Very similar evidence is obtained in both OLS and IV estimations using 2008 SHIW data (Fornero and Monticone, Reference Fornero and Monticone2011).
4 Discussion and conclusions
The Italian pension reforms will enhance individual responsibility for the accumulation of retirement wealth and confer a greater role for private pensions in ensuring old-age income. Both the number and the complexity of personal choices will increase, particularly for younger workers, at a time when financial innovation and increasing market integration are making the task of saving for retirement more difficult. This evolving context demands more financial sophistication on the part of Italian citizens and prompts concerns about the level of households’ knowledge and ability to deal with complex financial decisions. This paper uses the questions recently added to the SHIW in order to measure financial literacy and investigate its distribution in the Italian population and its impact on retirement planning, with a focus on pension plan participation.
The empirical results show that most individuals lack knowledge of basic financial concepts, even if they seem more familiar with inflation and stocks than with interest compounding. Similar to findings in other countries, women and less-educated individuals display the worst performance on financial literacy measures. A stark regional divide between the Centre–North and the South is also shown by the data. Moreover, financial literacy has a positive and significant impact on the propensity to save for retirement through a private pension plan. Robustness checks corroborate this result. First, financial literacy increases the probability of participation in a pension fund, even after controlling for other potential determinants of pension plan participation, such as risk preferences and the expected social security replacement rate and retirement age. Second, the results are qualitatively very similar after addressing potential financial literacy endogeneity.
These findings confirm and reinforce previous results about the positive impact of financial literacy on financial behaviour (e.g., on planning, saving, and portfolio diversification) and provide further rationale for public intervention to improve the level of financial literacy in the Italian population. At the same time, results indicate that some population sub-groups are at higher risks of possessing insufficient financial knowledge and skills to adequately face the challenges posed by the reformed pension system. While an improved level of financial knowledge would be beneficial in general, public policies on financial education should primarily be directed at these groups.
Appendix
Socio-demographic characteristics

Source: SHIW 2006. Sample: all household heads.
First-stage regressions and alternative instruments

Source: SHIW 2006. Robust std. errors are reported in parentheses. In panels III and IV standard errors are robust to clustering on regions. In columns (a) the dependent variable of the first stage is the number of correct answers; in columns (b) the dependent variable in the first stage is a dummy indicating three correct answers. Significance:
*** P<0.01, **P<0.05, *P<0.1. Sample: household head in the labour market in the age class 25–65. The same regressors as in Table 4 are included in the regressions but not reported in the table.