Particle aspect ratio (AR) is important in many applications of clays as industrial minerals. Examples of applications in which performance improves with increasing particle AR include polymer composites, where the mineral filler acts as a reinforcing agent and increases stiffness, and polymer films and coatings to which mineral fillers are added to improve barrier properties (DeArmitt & Hancock, Reference DeArmitt, Hancock and Rothon2003; Xanthos, Reference Xanthos2010). Lamellar particle shape also contributes to coverage, print properties and gloss in paper coatings (Murray & Kogel, Reference Murray and Kogel2005) and resistance to mud cracking in paints (Graystone, Reference Graystone, Lambourne and Strivens1999). Although most clay minerals consist of anisotropic, plate-shaped particles, their AR – defined as the ratio of particle diameter to thickness – can vary substantially, and it can be influenced by selective mining and processing. It is thus important to be able to measure it in order to ensure product consistency. However, the measurement and quantification of AR has always been challenging. Direct techniques such as electron and atomic force microscopy have frequently been used, as has the calculation of AR from combinations of complementary techniques such as laser diffraction and sedimentation. These methods all have significant limitations when the rapid measurement of an average AR of industrial samples of clay minerals with broad particle-size distributions is required, and these are discussed in more detail in the next section.
The electrical conductivity of suspensions of non-conducting particles is sensitive to their shape and, crucially, is independent of their particle size. For discs and oblate spheroids, the relationships between AR (defined as the ratio of diameter to the thickness for the former and to the distance between the poles for the latter), particle surface conductivity and suspension conductivity were first calculated more than 100 years ago (Fricke, Reference Fricke1924). These relationships have been used by several researchers since. However, the goal of most of these studies was to determine the conductivity and diffusion properties of ions at the surface of the particles rather than to measure the particle AR independently (e.g. Cremers & Thomas, Reference Cremers and Thomas1966; Thomas & Cremers, Reference Thomas and Cremers1970). As a result, measurements were typically made close to the isoconductance point, where the surface conductivity of the particles is the major determining factor of the suspension’s conductivity. Cremers & Laudelout (Reference Cremers and Laudelout1966) measured the conductivity of sodium-exchanged montmorillonite and kaolinite gels as a function of concentration and electrolyte content, and they fitted their results to Fricke’s (Reference Fricke1924) theory for oblate spheroids to obtain values for the axial ratio of the particles. A dedicated instrument for the measurement of the AR of kaolin samples using conductivity measurements was developed within English China Clays in the 1990s, in which the ratio of the conductivity of particle suspensions aligned by flow to their conductivity in random orientation was used to calculate a ‘shape factor’, again using Fricke’s (Reference Fricke1924) equations (Gate & Webb, Reference Gate and Webb1992; Paynter, Reference Paynter1997). Weber et al. (Reference Weber, Heuser, Mertens and Stanjek2014) noted that the use of conductivity measurements to determine AR was a ‘forgotten’ method, and they demonstrated a conductimetric titration procedure in which a series of homoionic kaolin suspensions were titrated with KCl, and the suspension conductivity was plotted against the background conductivity determined from a blank titration without the particles. In this paper we describe a related but somewhat simpler approach, in which the AR of particles in dilute suspension is calculated from a single series of measurements of conductivity vs volume fraction at a constant background electrolyte concentration. This method requires very little sample preparation and should be applicable to all lamellar, non-swelling clay minerals.
Common existing methods for estimating AR
To demonstrate the motivation behind the development of the conductivity technique described in this paper, in this section we discuss the most common methods for the estimation of AR and their limitations.
Microscopy
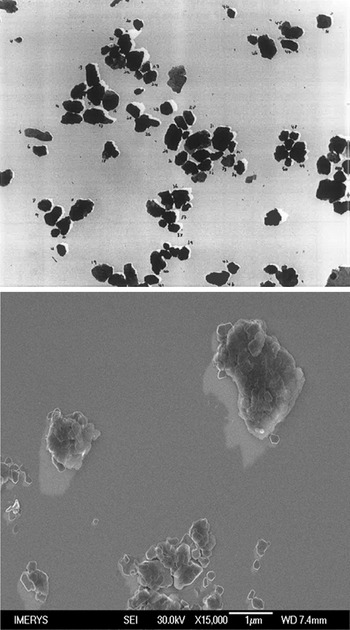
Many researchers have used electron (Conley, Reference Conley1966; Nadeau, Reference Nadeau1985) or atomic force (Vaz et al., Reference Vaz, Herrmann and Crestana2002; Gélinas & Vidal, Reference Gélinas and Vidal2010) microscopy to determine the distributions of size and shape of clay particles. To determine AR, a measurement of diameter and thickness for each particle is required. There are several possible definitions of diameter that may be used, including the maximum in-plane length, the circle of equal diameter and the average or maximum Feret diameter, and the choice of which to use varies between authors. Shadowing techniques can be used to measure particle thickness, but only for individual, well-separated particles. Images of shadowed kaolin particles by transmission electron microscopy (TEM) and scanning electron microscopy (SEM) taken in our laboratories are shown in Fig. 1. A significant problem with sample preparation and shadowing of industrial samples with broad size distributions for both SEM and TEM is clearly visible in the SEM image of Fig. 1: the coverage of larger particles with much smaller ones whose shadows cannot be imaged reliably. Furthermore, measurement of a sufficient number of particles to obtain a representative distribution is arduous, and thus simpler techniques that measure representative numbers of particles are generally preferred for industrial samples.
Shadowed TEM (top) and field-emission SEM (bottom) images of kaolin particles. Length of shadow and shadowing angle are used to measure particle thickness.

Calculation of AR from particle-size distributions measured by laser diffraction and sedimentation
Particle-size measurement techniques typically represent size as an ‘equivalent spherical diameter’ (esd), which is the diameter of a spherical particle that would give the same response to the measurement as the particle being measured. As different techniques are sensitive to different dimensions of non-spherical particles, differences between the esd measured by two techniques may be used to calculate AR, the most common of which are laser diffraction and sedimentation. For clay minerals, a common assumption used in this approach is that the particles are approximately disc-shaped, so the AR is defined as the ratio of the disc diameter to its thickness. The in-plane shapes of clay particles are not circular, so this is necessarily a simplification. The relationship between the particle dimensions and esd of discs and spheroids for sedimentation, translatory diffusion, rotary diffusion, particle volume and projected area was calculated by Jennings & Parslow (Reference Jennings and Parslow1988). In determinations of AR, laser diffraction is usually assumed to be sensitive to projected area (Slepetys & Clelland, Reference Slepetys and Cleland1993; Inoue, Reference Inoue1995), although when Mie theory is used to convert the diffraction pattern into a size distribution (as is commonly done for particles of less than 50 µm in diameter) and the particles are randomly orientated, in principle the measurement should be sensitive to the particle volume (Jennings, Reference Jennings1993). However, the flow in the measurement cell of diffraction instruments is likely to orientate the plane of the particles perpendicular to the beam, and when calculating AR from measurements of esd by laser diffraction and sedimentation, use of the Jennings & Parslow (Reference Jennings and Parslow1988) formulae for volume results in unrealistically high values, and hence the projected area formula is usually preferred.
The formulae derived by Jennings & Parslow (Reference Jennings and Parslow1988) for the ratio of the diameter (d) of a disc to its esd as a function of its aspect ratio (AR) for projected area and Stokes sedimentation are given in Equations 1 & 2, respectively:
 \begin{equation}\begin{array}{*{20}{c}}
{\frac{d}{{esd}} = \frac{1}{{\sqrt {\left( {\frac{1}{2} + \frac{1}{{AR}}} \right)} }}}
\end{array}\end{equation}
 \begin{equation}\begin{array}{*{20}{c}}
{\frac{d}{{esd}} = \frac{1}{{\sqrt {\left( {\frac{{3\arctan AR}}{{2AR}}} \right)} }}}
\end{array}\end{equation}
For AR values greater than 5, where arctan(AR) approaches π/2, Equation 2 approximates closely to Equation 3:
 \begin{equation}\begin{array}{*{20}{c}}
{\frac{d}{{esd}} = \sqrt {\frac{{3{{\pi }}}}{{4AR}}} }
\end{array}\end{equation}
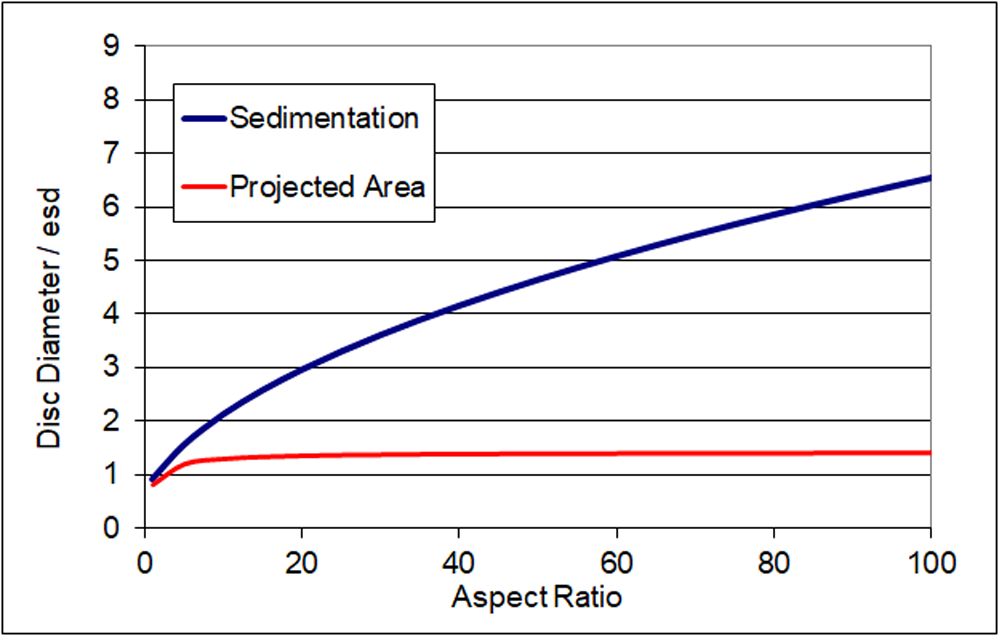
Figure 2 is a plot of the ratio of disc diameter to esd for sedimentation and projected area from Equations 1 & 2. For discs above AR = 5, the ratio using the projected area formula tends towards the square root of 2, and thus the esd is not sensitive to increases in AR beyond this point. In contrast, for sedimentation the ratio continues to increase with AR. Hence, the ratio between esd measured by the two techniques can be related to the AR, at least for monodisperse particles of uniform shape. The analysis is less robust for real samples in which there is a distribution of both particle diameter and AR. Nevertheless, by combining Equations 1 & 3, for example, a formula for the AR in terms of the esd values determined by the two techniques can be produced (Equation 4):
 \begin{equation}\begin{array}{*{20}{c}}
{AR = \frac{{3{{\pi }}}}{2}{{\left( {\frac{{es{d_{{\text{laser}}}}}}{{es{d_{{\text{sedimentation}}}}}}} \right)}^2} - 2}
\end{array}\end{equation}
Theoretical relationship between particle diameter and esd as measured by different techniques for disc-shaped particles.

Pabst & Berthold (Reference Pabst and Berthold2007) derived a similar formula in which the –2 term was absent by applying a different approximation. The main weakness of this approach is that the formula contains only a single esd value from each measurement. Furthermore, AR is rarely uniform over the whole distribution. Although it is possible to apply Equation 4 to several different positions in the distributions (e.g. at d 10, d 20, etc.) and calculate a weighted average, this approach is flawed because particles with different ARs will not appear at the same position in the distributions measured by the different techniques. For example, two particles of equal diameter will appear at the same position in the distribution by laser diffraction, but if they have very different thicknesses they will appear at very different positions in the distribution by sedimentation. For the same reason, distributions of AR calculated using Equation 4 at different positions rarely agree with AR values calculated from the esd values of corresponding narrow fractions taken from the same sample. Despite these shortcomings, this approach has proved useful and is widely employed (e.g. Lohmander, Reference Lohmander2000), sometimes using only the median (d 50) diameter from each measurement. For many clay mineral samples, use of Equation 4 tends to give very high values for AR that are unrealistic. Instead, some users simply refer to the ratio of the d 50 values, using terms such as ‘lamellarity index’ (Clerc et al., Reference Clerc, Ferry, Leroy and Lopez-Cuesta2005), without calculating a value for the AR.
Calculation of AR from particle-size distributions and surface area
For a disc of fixed volume, surface area increases with AR. Therefore, an estimate of the average AR of a sample of non-porous particles can be made by equating its specific surface area, typically measured by nitrogen adsorption, with a value calculated from the esd distribution by volume and an average AR. Laser diffraction is the preferred method for determining the esd for clays, because for AR > 5 it is sensitive to the actual disc diameter, which is the parameter used in the calculation. This approach has been used but is less commonly applied than the calculation from different particle-sizing techniques described earlier. Ideally, the full diameter distribution should be measured at high resolution; the specific surface area is calculated from the AR and the volume fraction at each size increment and summed over the whole distribution. The value of the AR is then adjusted to match the calculated and measured areas. A simpler approach is to assume a log normal distribution of diameters represented by two values – the median diameter and the width of the distribution – which then leads to a direct formula (Hohenberger et al., Reference Hohenberger, Holzinger and Bernhardt2002; Gantenbein et al., Reference Gantenbein, Schoelkopf, Matthews and Gane2011). In addition to the assumption of a single value of AR across the whole distribution, the major weakness of this approach is that the specific surface area is dominated by the smallest particles, which are typically the most difficult to characterize accurately using the whole sample. In laser diffraction, the signal from the fine particles is often obscured by the stronger scattering from the larger ones, leading to an underestimate of their abundance. Similarly, if sedimentation under gravity is used, the fraction of particles below 0.3 µm is overestimated because the effects of Brownian motion are overlooked in the analysis by Stokes’ law. The effects of Brownian motion on sedimentation may be overcome by the use of a disc centrifuge device, which can measure particles as small as 10 nm accurately, but this approach is not commonly applied.
Conductivity of suspensions of non-conducting discs: theoretical aspects
An alternative approach to calculating the conductivity of suspensions of non-conducting disc-shaped particles to that of Fricke (Reference Fricke1924) was devised by Dukhin and Derjaguin in the 1970s (Dukhin & Derjaguin, Reference Dukhin, Derjaguin and Matijevic1974). Here the conductivity of a suspension of particles (K s) is given by the simple formula shown in Equation 5:
 \begin{equation}\begin{array}{*{20}{c}}
{{K_{\text{s}}} = \frac{{{\alpha }}}{F}{K_1}}
\end{array}\end{equation}
where K 1 is the conductivity of the background solution, F is a ‘structural resistance factor’ dependent upon the volume fraction of particles φ and their AR and α is a coefficient dependent upon several factors including the surface conductivity, and it is defined by Equation 6:
 \begin{equation}\begin{array}{*{20}{c}}
{\alpha = 1 + \frac{2}{3}\varphi F\frac{{Du}}{{1 + Du}}AR}
\end{array}\end{equation}
where Du is the ratio between the surface and background conductivity; α tends to a value of 1 when Du is small and the effects of surface conductivity can be neglected. F is determined by the relation shown in Equation 7:
 \begin{equation}F\, = \,{(1 - \,\varphi )^{ - k}}\end{equation}
where φ is the volume fraction of particles and, for randomly orientated particles, k is dependent upon AR according to Equation 8:
 \begin{equation}\begin{array}{*{20}{c}}
{k = \frac{1}{3}\mathop \sum \limits_{i = x,y,z} \left( {\frac{1}{{1 - {A_i}}}} \right)}
\end{array}\end{equation}
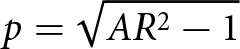
where x, y and z refer to the orientation of the particles and
 ${A_z} = \frac{{1 + {p^2}}}{{{p^3}}}{\text{ }}\left\{ {p - {{arctan}}\left( p \right)} \right\}$,
 ${\text{ }}{A_x} = {A_y} = \frac{1}{2}\left( {1 - {A_z}} \right)$ and
 $p = \sqrt {A{R^2} - 1} $
For AR > 4, as arctan(p) approaches π/2, the approximate relation shown in Equation 9 holds:
 \begin{equation}\begin{array}{*{20}{c}}
{AR \approx \frac{{3{{\pi }}\left( {k - 1} \right)}}{2}}
\end{array}\end{equation}
For spherical particles, Dukhin & Derjaguin (Reference Dukhin, Derjaguin and Matijevic1974) also showed that k = 1.5.
Note that, by symmetry, Equation 8 implies that, for particles with their major axis aligned parallel to the electric field, Equation 10 holds:
 \begin{equation}\begin{array}{*{20}{c}}
{{k_{{\text{aligned}}}} = \left( {\frac{1}{{1 - {A_x}}}} \right)}
\end{array}\end{equation}
Dukhin & Derjaguin (Reference Dukhin, Derjaguin and Matijevic1974) did not discuss the conductivity of suspensions of aligned particles in their derivation; however, for particles aligned with the field, when α = 1, combination of Equations 5, 7 & 10 leads to the same numerical results as those obtained from the equations of Fricke (Reference Fricke1924), who did provide expressions for different particle orientations. In contrast, for randomly orientated particles, the Fricke and Dukhin/Derjaguin solutions diverge as volume fraction and AR increase, with the latter predicting a larger reduction in conductivity due to the presence of the particles.
For the method described in this work, we noted that, for cases where the effects of surface conductivity are negligible and thus α = 1, by combining Equations 5 & 7 the relation shown in Equation 11 is obtained:
 \begin{equation}\begin{array}{*{20}{c}}
{\ln \left( {{K_{\text{s}}}} \right) = \ln \left( {{K_1}} \right) + k\ln \left( {1 - {{\varphi }}} \right)}
\end{array}\end{equation}
For suspensions of randomly orientated particles of different volume fractions with constant background conductivity K 1, the parameter k can therefore be determined from a plot of ln(K s/K 1) against ln(1 – φ). AR is obtained directly from the gradient k using Equation 9; note that the background conductivity does not affect the gradient, so, provided that it is constant for all measurements, it is not necessary for it to be known accurately.
Previous methods of estimating particle AR from suspension conductivity
Cremers & Laudelout (Reference Cremers and Laudelout1966) prepared sodium-exchanged montmorillonite and kaolinite samples, added sodium chloride at a range of concentrations to them, then converted them to gels at particle volume fractions of up to 50% by centrifugation and filter pressing. They constructed curves of gel conductivity against background conductivity for different volume fractions and electrolyte concentrations. They fitted these curves to Fricke’s (Reference Fricke1924) theory, from which they calculated a value for the axial ratio assuming that the particles were ‘randomly stacked’ oblate spheroids. More recently, Weber et al. (Reference Weber, Heuser, Mertens and Stanjek2014) prepared homoionic potassium-exchanged kaolin suspensions in water at ∼2 wt.% and titrated them with KCl to determine suspension conductivity as a function of background conductivity. Samples were gently stirred, and particle orientation was therefore assumed to be random. The background conductivity was determined by a blank titration performed in parallel without the kaolin particles. Using the Dukhin & Derjaguin (Reference Dukhin, Derjaguin and Matijevic1974) model (Equation 5), and assuming α = 1, they determined F, and then used Equation 7 to determine k and thus AR. The use of the blank titration was preferred over centrifuging after each KCl addition and measuring the supernatant conductivity to determine K 1, although they noted that this required thorough pre-washing of the kaolin particles to eliminate the release of electrolyte from them. They also measured suspension conductivity at very low concentrations of KCl to determine the isoconductance point and thus the minimum concentration that would satisfy the approximation that α = 1. For their homoionic kaolin suspensions, isoconductance occurred at 200 µS cm–1, and the titrations were performed over a range of conductivities up to 10 000 µS cm–1.
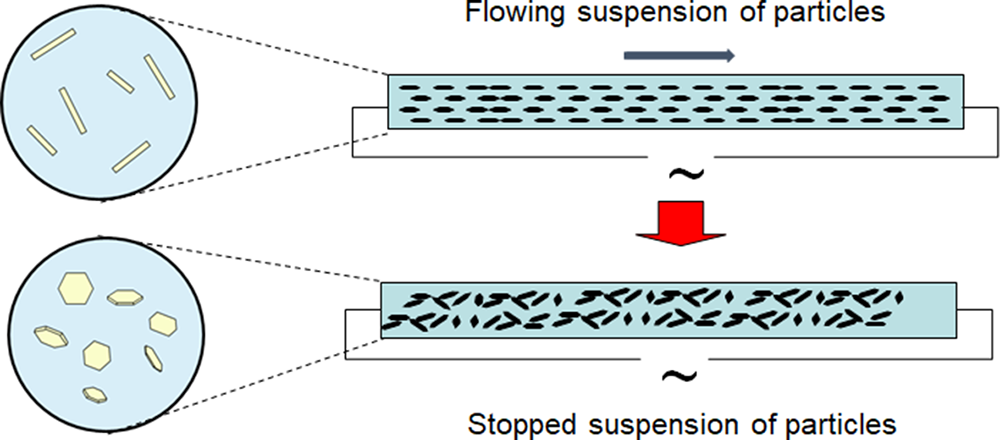
The instrument developed by English China Clays in the 1990s for determining the AR of kaolin samples (Gate & Webb, Reference Gate and Webb1992; Paynter, Reference Paynter1997) measures the conductivity of a suspension firstly with particles aligned by flow with the electric field and then with the particles orientated randomly, and it uses Fricke’s (Reference Fricke1924) theory to calculate the AR of the particles from the ratio of the two measurements. The method is referred to as ‘stopped-flow conductivity’. Figure 3 provides a schematic diagram of the instrument. Electrodes are placed at the ends of a narrow tube along which the particles flow, and thus they measure conductivity in the flow direction. Particles are aligned with their major axis parallel to the direction of flow. The flow is then stopped, and the particles are allowed to relax into a random orientation by Brownian motion. The second measure of conductivity is made once the particles are fully reorientated, typically after 30 s. A higher conductivity ratio indicates higher AR particles; for spherical particles no alignment by the flow is possible and thus the conductivity remains constant. A suitable flow rate is calculated such that the flow is laminar and the shear rate across 95% of the tube cross section is greater than the particle rotational diffusion coefficient for discoid particles of diameter greater than 0.5 µm, thus ensuring their alignment. This requires a narrow tube of ∼2.5 mm diameter. For particles with a sedimentation esd of greater than ∼7 µm, the effects of sedimentation begin to interfere with the relaxation into random orientation by rotational diffusion, which limits the applicability of the instrument to finer particle sizes.
Working principle of the stopped-flow conductivity device.

Provided that the particles are well dispersed and the background conductivity lies within the measurement range of the instrument, is does not need to be controlled. No independent measurement of surface conductivity is made for each sample. However, in the development of the instrument it was observed that the ratio of conductivity in flowing and quiescent conditions was independent of background conductivity over the range of values accessible to the instrument, implying that the surface to background conductivity ratio was also constant; the Fricke (Reference Fricke1924) equations predict a larger effect of surface conductivity on the conductivity of suspensions of randomly orientated particles than aligned ones. A fixed value for the ratio of the surface conductivity to the background conductivity is therefore used in the Fricke analysis; this was estimated to be 0.1 based on measurements also performed by Fricke (Fricke & Curtis, Reference Fricke and Curtis1936). It was assumed that the reason why this ratio remained constant was due to increased ion adsorption at the particle surfaces (and thus increased surface charge) as the electrolyte strength increased, although this was not verified. As the calculated AR is very sensitive to the ratio of surface to background conductivity value used, in Paynter’s thesis (Paynter, Reference Paynter1997) and in publications in which its values have been used (Preston et al., Reference Preston, Nutbeem, Heard and Wygant2007; Bollström & Toivakka, Reference Bollström and Toivakka2013) it was quoted as a ‘shape factor’ rather than as an AR due to the associated uncertainty. Nevertheless, Paynter compared shape factors with AR values obtained from shadowed TEM analysis and found them to be similar.
Materials
Kaolin, talc, mica and spherical silica (Teco-sphere Micro, 5 µm median diameter) samples were a mixture of commercial and development products, all sourced from Imerys. Sodium hexametaphosphate and potassium chloride were obtained from Sigma Aldrich UK. A polyethylene oxide/polypropylene oxide/polyethylene oxide (PEO/PPO/PEO) triblock copolymer (Pluronic PE6200) and sodium polyacrylate (Dispex N40) were obtained from BASF. A trimethoxysilane-terminated short-chain PEO (Dynasylan 4148) was obtained from Evonik. Polypropylene copolymer (PP56M10) was obtained from Sabic.
Conductivity was measured with a Mettler-Toledo FiveEasy F30 temperature-compensated meter with an LE703 conductivity/temperature probe and corrected to 20°C. Suspension densities were measured with an Anton Paar DMA35 portable density meter. Particle-size distribution was measured by laser diffraction with a Malvern 2000 instrument and by sedimentation with a Micromeritics SediGraph III Plus. Selected mica samples were compounded into polypropylene copolymers using a Coperion ZSK compounder at 230°C and injection moulded into test pieces using an Arburg Allrounder 320M injection moulder. The flexural modulus of the test pieces was measured on a Tinius Olsen HK10KS tensiometer in three-point bend mode.
Method for measuring the AR of clay mineral suspensions
In this work, we demonstrate an alternative approach for measuring AR, in which suspension conductivity, K s, is measured as a function of volume fraction at constant K 1. Each mineral sample is suspended at ∼10% solids content in a solution of KCl of sufficient conductivity such that the assumption that α = 1 in Equation 5 can be made, and this is left for ∼30 min to equilibrate any ions contained in the sample with the solution. The range of suitable conductivity values was investigated as part of this study, and typically ∼5000 µS cm–1 was used. Suspensions are then centrifuged to separate the sample into a soft sediment and a clear supernatant solution. Using this approach, the background electrolyte concentration and conductivity is the same for both fractions. The clear supernatant is transferred by pipette to a beaker with a magnetic stirrer and its conductivity measured. The remaining sediment is stirred to ensure uniform composition and to eliminate size segregation effects. Measurements of conductivity against volume fraction at constant K 1 can then be made by adding back aliquots of the sediment to the supernatant and mixing well, measuring suspension density (using an oscillating U-tube density meter) and conductivity at each point. Volume fraction is calculated from the density measurements, and the values obtained are plotted according to Equation 11; the AR is determined from the gradient of the plot. Filtration was also evaluated for the separation step, but for fine, dispersed clay minerals it can be very slow, and centrifugation proved to be more reliable.
Results and discussion
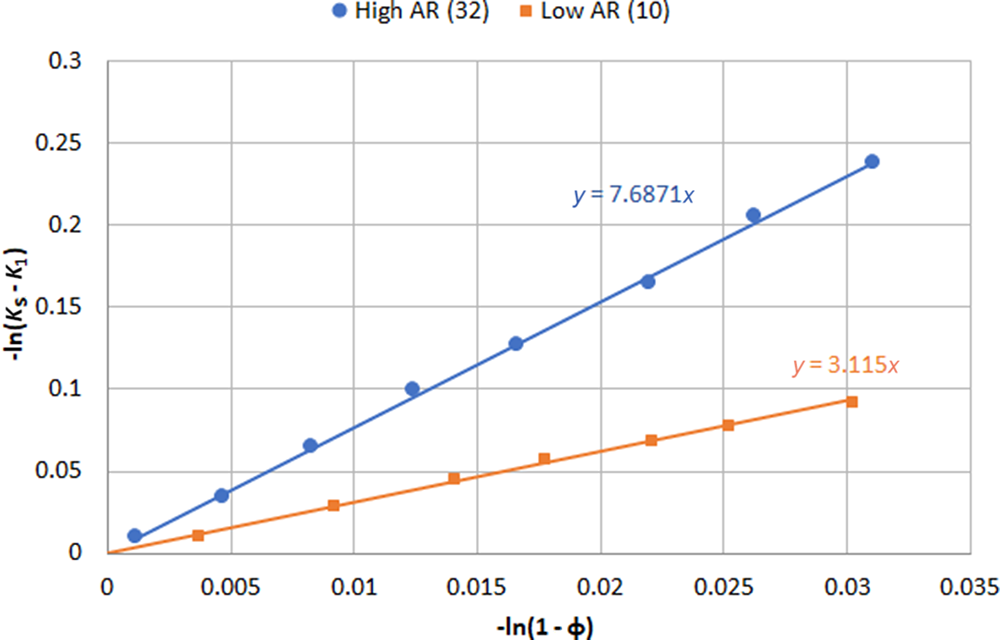
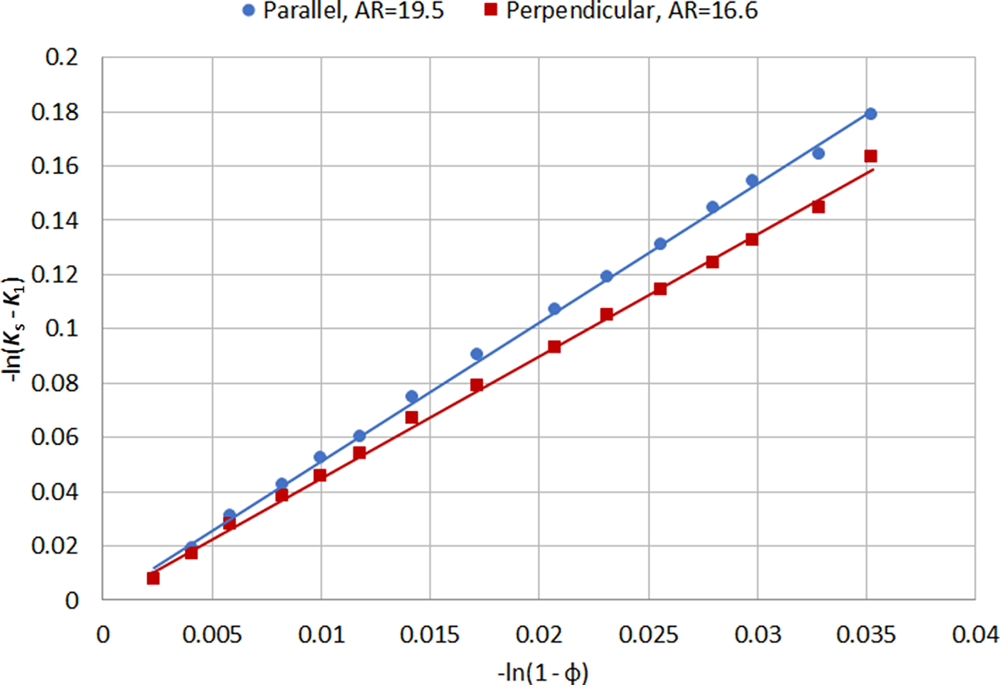
Figure 4 shows typical plots from Equation 11 for high- and low-AR mica samples. Plots of this type generally show very good linear fits with correlation coefficients in excess of 0.99 for solids contents between 0% and 10%, and multiple measurements give values of AR with a reproducibility of ±10%.
Conductivity and volume fraction plots of Equation 11 for mica samples of different ARs. Note that both terms are plotted as negatives to allow origin at the bottom left.

Verification of assumptions
Two critical assumptions using this method are that the particles are randomly orientated and that the effects of surface conductivity can be neglected. Experiments were carried out to investigate both of these assumptions. The conductivity probe used contains a parallel-sided channel through which the liquid can flow, with the electrodes mounted on either side of the channel. Figure 5 shows the effect of orientation of the conductivity probe: when the electrodes are parallel to the flow direction of the suspension, so that the electric field between them is perpendicular to it, particles may be orientated along this direction so that their major axis is perpendicular to the direction of measurement, which leads to a larger decrease in conductivity and thus an artificially high value for the AR. When the probe is turned perpendicular to the flow, the suspension enters the channel between the electrodes from both ends, thus causing turbulence between the electrodes and ensuring random particle orientation. Note that the difference shown in Fig. 5 is relatively small; even with the probe parallel the flow in the suspension is quite turbulent, so the alignment effect is small.
Effect of orientation of the conductivity probe on the measured conductivity and calculated AR.

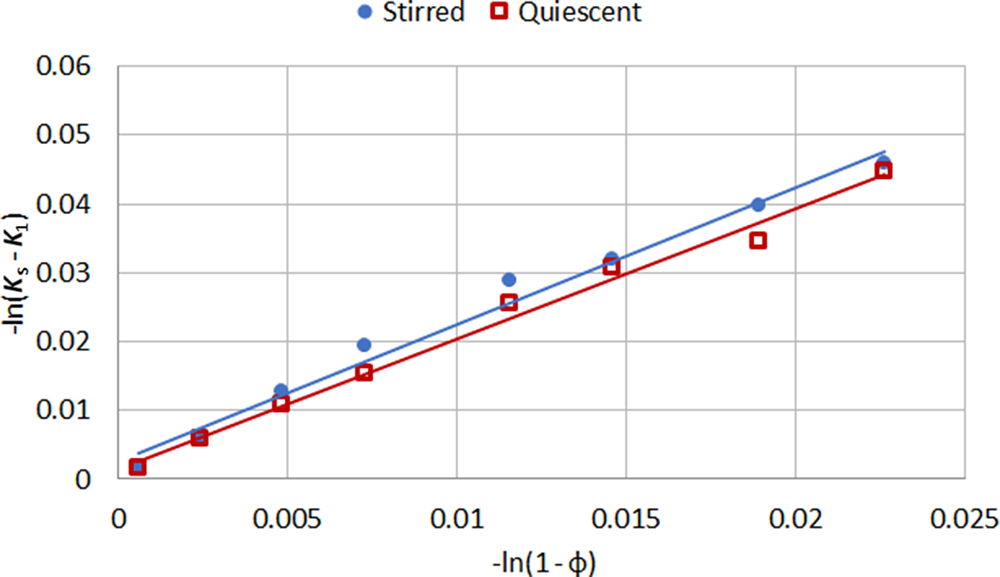
Figure 6 shows similar plots using stirred and quiescent suspensions (for which the stirrer was turned off for 30 s) of ultrafine kaolin particles (median size by sedimentation 0.2 µm), which should rapidly reach random orientation by rotary diffusion. The plot gradients are identical within experimental error, indicating that the particle orientation is the same in each case.
Conductivity of stirred and quiescent suspensions of ultrafine kaolin measured with the probe perpendicular to the flow orientation.

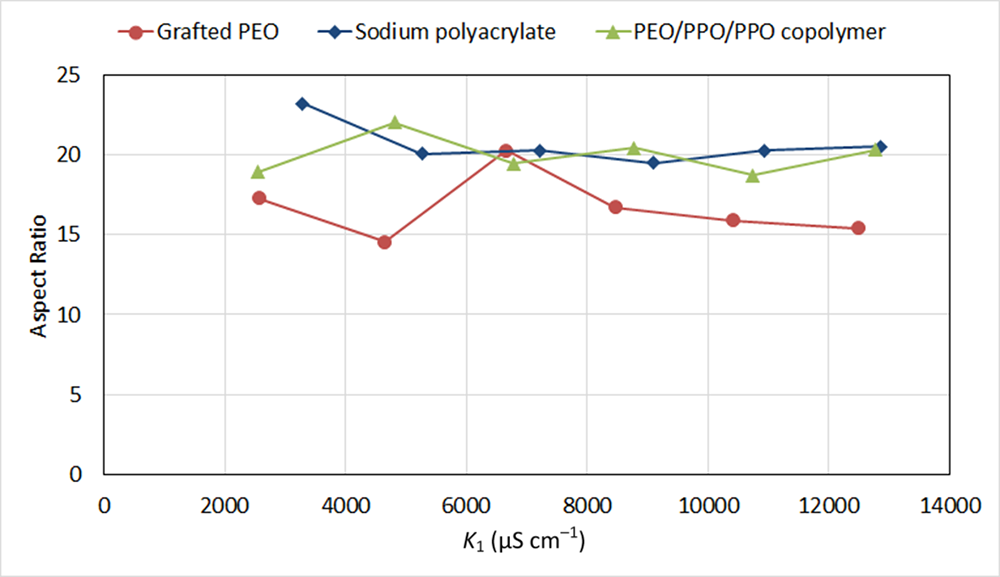
According to Equation 11, the measured AR is independent of the level of background conductivity used, provided that it is sufficiently high to ensure the effects of surface conductivity can be neglected. The ionic strength also has to be low enough not to prevent adequate particle dispersion. To assess the effect of surface conductivity, suspensions of a high-AR talc (median size: 11 µm by laser diffraction, 2.0 µm by sedimentation) were prepared using three different dispersant types. Sodium polyacrylate is a standard anionic clay dispersant that has been shown to create interparticle repulsion by both electrostatic and steric mechanisms (Mogridge et al., Reference Mogridge, Phipps, Rogan, Skuse and Skuse2002). Non-ionic triblock PEO/PPO/PEO copolymers have been shown to adsorb to clay surfaces via the central PPO block (Nelson & Cosgrove, Reference Nelson and Cosgrove2005) and to create steric repulsion between particles due to the PEO blocks that extend into the solution. A similar dispersion mechanism should in principle be achieved by grafting PEO chains to the particle surface, which in this case was done by dry coating a short-chain, trimethoxysilane-terminated PEO dispersant onto the particles and allowing it to react. Both types of PEO-based dispersant would be expected to reduce or at least screen any charge on the particle surfaces and thus minimize surface conductivity. Figure 7 shows the measured AR of the talc over a wide range of background conductivities for the three different types of dispersant. In all cases, the measured value is independent of background conductivity, suggesting that the surface conductivity does not affect the result and thus its contribution can be neglected. Note that the measured AR was consistently lower with the grafted PEO than with the other dispersants. This is believed to be due to incomplete dispersion of the particles, which was identified both visually and by comparison of the particle-size distribution by sedimentation with the different dispersants. The sodium polyacrylate continued to provide adequate dispersion even at very high conductivity, which is believed to be due to its generation of steric repulsion.
Effect of increasing ionic strength on the measured AR of high-AR talc as a function of background conductivity using three different dispersants.

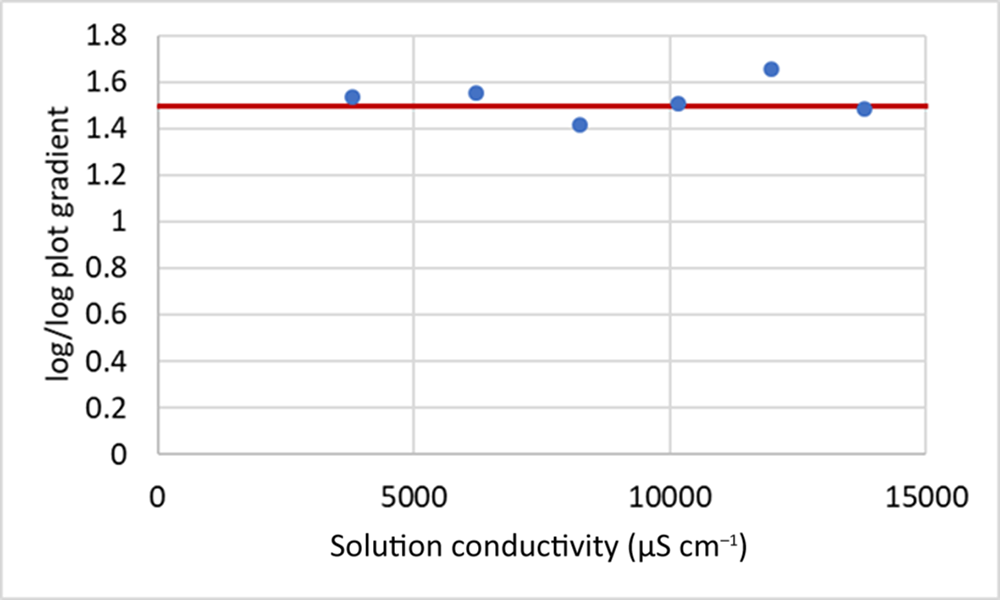
As a further test of the influence of surface conductivity, a sample of 5 µm spherical silica particles was prepared and treated with a standard clay dispersant, sodium hexametaphosphate, which is suitable for both. According to Dukhin & Derjaguin’s (Reference Dukhin, Derjaguin and Matijevic1974) analysis, when surface conductivity effects can be neglected and thus α = 1 in Equation 5, the value of k (the gradient of the plot used in the current analysis) should be 1.5. Figure 8 shows the measured gradient as a function of solution conductivity; it is indeed 1.5 within experimental error. Although this predominantly ionic dispersant may not be very effective at the higher values of ionic strength, it appears that the shear applied to the suspension is sufficient to break up any flocs that may form and to maintain the particles dispersed between the electrodes of the conductivity probe, as the gradient remains constant even as the background conductivity approaches 15 000 µS cm–1.
Gradient of ln(K s/K 1) against ln(1 – φ) for spherical silica particles at a range of conductivities. The red line shows the theoretical value of 1.5 for spheres.

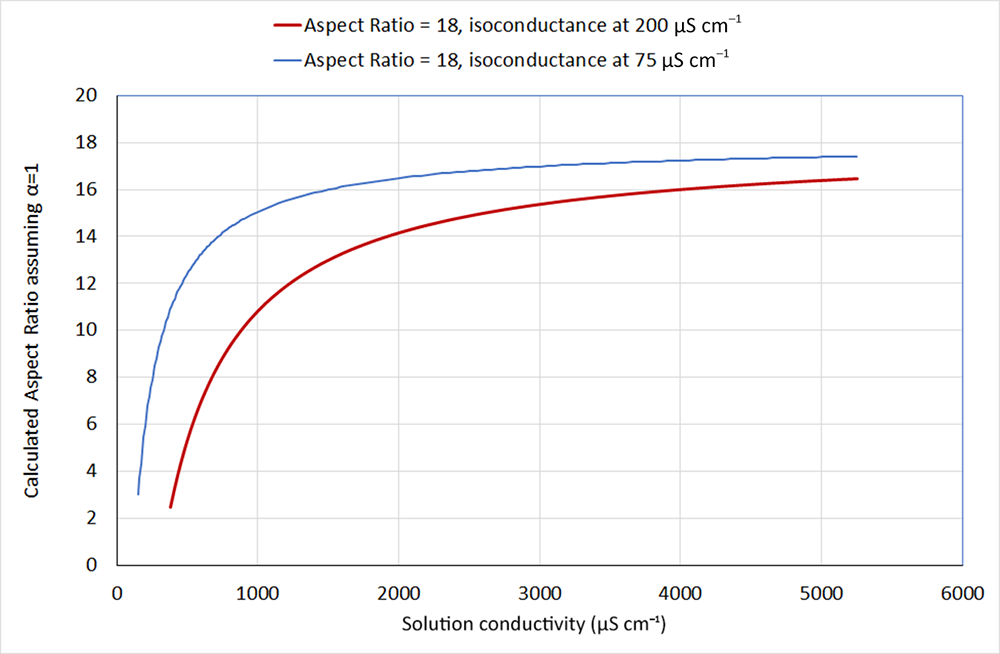
Figures 7 & 8 show that, experimentally, background conductivities in the range of 2000–12 000 µS cm–1 give approximately constant values for AR and thus appear to be suitable for this method. Weber et al. (Reference Weber, Heuser, Mertens and Stanjek2014) measured the isoconductance point for their potassium-substituted homoionic kaolin samples to be 200 µS cm–1, so it seems reasonable to assume that the background conductivity in the measurements shown here is sufficiently high to be able to neglect the effects of surface conductivity. Using the isoconductance point as an estimate for the surface conductivity, a value of α can be calculated from Equation 6 for a given AR, volume fraction and background conductivity. This can then be used in Equation 5 to calculate the suspension conductivity, and the apparent AR that would result from the assumption that α = 1 then can be calculated from Equations 5, 7 & 9. Figure 9 shows the recalculated AR assuming α = 1 for suspensions of particles of AR = 18 as a function of the background conductivity for two different values of isoconductance. Using the value of 200 µS cm–1 from Weber et al. (Reference Weber, Heuser, Mertens and Stanjek2014), the calculated AR does not reach an apparent plateau until above 4000 µS cm–1, so for the samples shown in this paper it seems probable that the presence of polymeric dispersants that may hinder the movement of ions at the particle surfaces reduces the effective surface conductivity to lower than this value. Nevertheless, the calculation does support the use of the approximation that α = 1 for background conductivities in the region of 5000 µS cm–1, which were typically used in this work.
Recalculated AR assuming α = 1 for particles of AR = 18 as a function of background conductivity, using different values of surface conductivity.

Many of the early studies of clay suspension conductivity examined smectite clays, which carry much higher surface charges than the minerals used in this work. Cremers & Thomas (Reference Cremers and Thomas1966) measured the isoconductance point of sodium-exchanged montmorillonite suspensions between 1 and 4 wt.% clay to be ∼5000 µS cm–1, which is more than an order of magnitude higher than Weber et al.’s (Reference Weber, Heuser, Mertens and Stanjek2014) value for kaolinite. Therefore, it seems questionable that the assumption of α = 1 could be made for this type of clay unless extremely high-ionic-strength solutions are used, in which case the particles would be difficult to maintain in a dispersed state using the method demonstrated here. In the early work of Cremers and co-workers (Cremers & Laudelout, Reference Cremers and Laudelout1966; Cremers et al., Reference Cremers, Van Loon and Laudelout1966), clay suspensions were pressed into high-solids-content gels, and background conductivities of up to 150 000 µS cm–1 were used. Their work appear to have assumed random orientation of the particles; however, given the high pressures required to expel the electrolyte and achieve the desired solids, this may be questionable.
Comparison with other estimates of AR
The AR values measured by the simple conductivity technique described earlier were compared with other measures used previously. The ARs of a range of samples of kaolin, talc and mica were measured using the stopped-flow conductivity apparatus, using the Fricke (Reference Fricke1924) analysis as previously but setting the ratio of surface to background conductivity to zero in the calculation, in accordance with the observations described earlier.
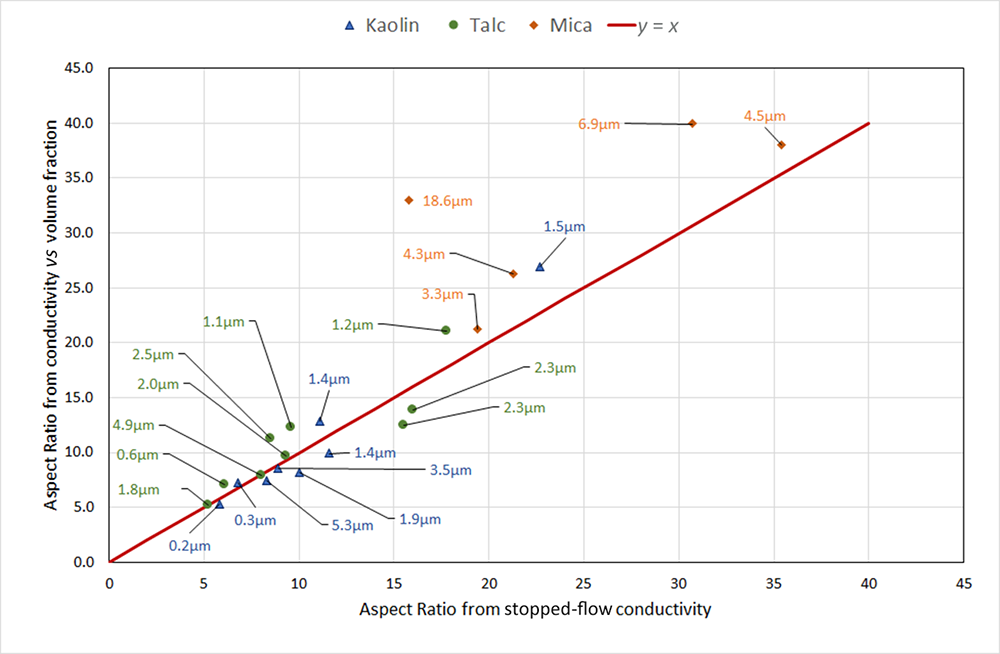
Figure 10 is a plot of the AR measured by the simple conductivity method against the values from the stopped-flow conductivity apparatus. Agreement between the two techniques is generally very good, except for the coarser mica samples, for which the simple method gives significantly higher values. This was expected, since in the stopped-flow apparatus the larger particles do not reach random orientation within the measurement time, and thus the change in conductivity between flowing and stopped suspensions is smaller than it should be and the calculated AR is lower.
Comparison of ARs of clay mineral samples measured by the handheld technique with values from the stopped-flow conductivity apparatus. Labels show the median size of each sample by sedimentation.

Figure 10 Long description
The title reads: Comparison of ARs of clay mineral samples measured by the handheld technique with values from the stopped-flow conductivity apparatus. The x-axis label is: Aspect Ratio from stopped-flow conductivity. The x-axis ranges from 0 to 45 with tick marks every 5. The y-axis label is: Aspect Ratio from simple conductivity method (handheld). The y-axis ranges from 0 to 45 with tick marks every 5. A legend at the top lists three point categories: Kaolin, Talc and Mica. A red diagonal line labeled y equals x runs from the lower left toward the upper right. Data points are plotted as colored markers with nearby text labels showing sizes in micrometer. Several points lie close to the y equals x line between about x equals 5 to x equals 20 and y equals 5 to y equals 20. Additional points appear above the y equals x line at higher x values, including points around x in the mid 20s to mid 30s with y values in the low 30s to around 40. Multiple arrows point from the left side toward a cluster of low x and low y points, each arrow ending near a marker with a micrometer label.
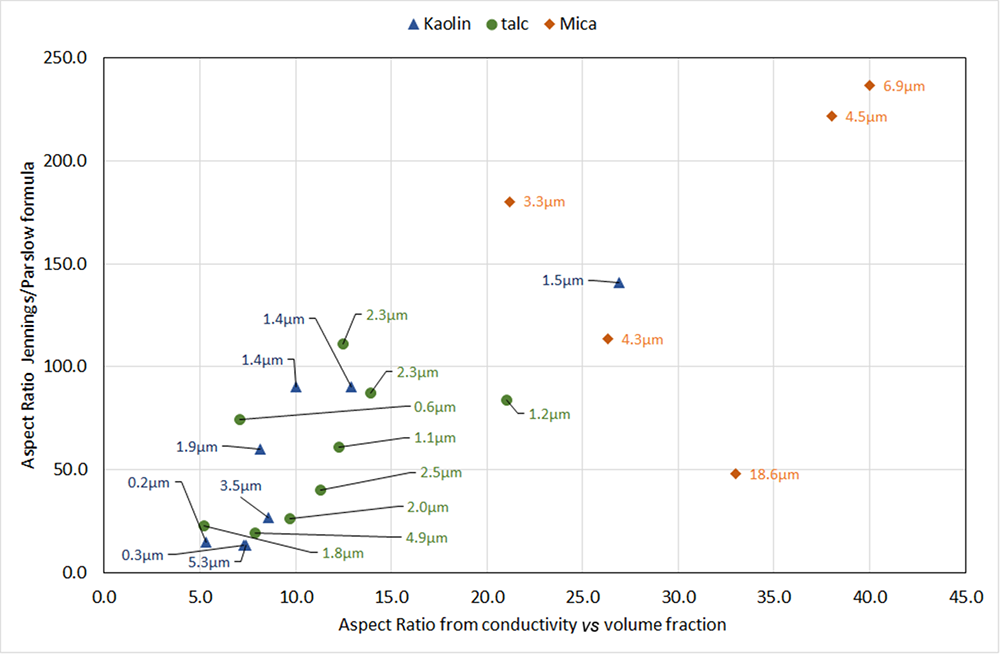
Figure 11 compares AR measured with the new conductivity method with the value obtained from the median (d 50) esd values by laser diffraction and sedimentation using Equation 4. There is reasonable correlation, but the values are much more scattered, and the values of AR from Equation 4 are between 2 and 10 times higher than those measured by the conductivity method. In many cases, particularly for some of the micas, the values calculated from Equation 4 are unrealistically high. For the very coarse mica sample, Equation 4 gives a relatively low value for the AR compared with other samples, which is most probably due to the limitations of both particle-size techniques for samples of coarse particles with broad distributions: deviations from Stokes’ law in the case of sedimentation and the dominance of the scattering of larger particles in the case of laser diffraction. In the evaluation of many mica samples, we have observed much less consistent values for AR calculated from laser diffraction and sedimentation measurements than is typical for finer kaolin or talc materials, as well as much poorer correlation with performance in their applications. However, with the conductivity method, AR values are much more consistent, and they correlate well with application performance.
Comparison of ARs of clay mineral samples measured by the handheld technique with values calculated from the median esd values from laser diffraction and sedimentation (Equation 4). Labels show the median size of each sample by sedimentation.

Figure 11 Long description
Insufficient visual information to describe this element accurately.
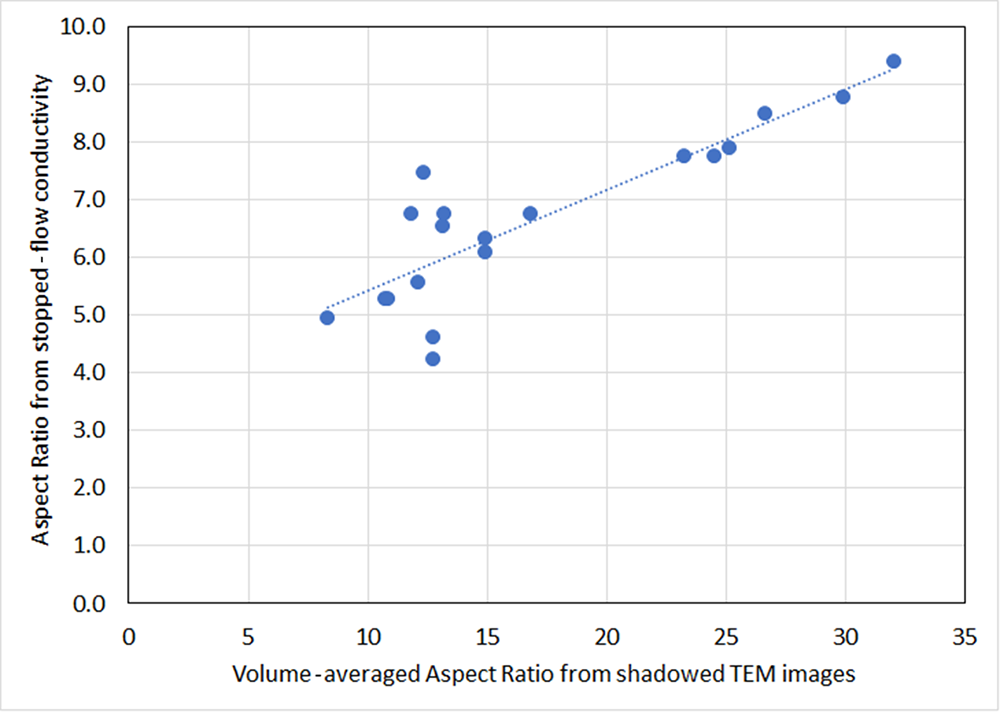
A comparison of AR measured by the conductivity method with shadowed electron microscope images was beyond the scope of this study. However, given the good agreement between the AR values measured with this method and those measured with the stopped-flow conductivity instrument (Fig. 10), it was instructive to re-examine the data generated during the development of the instrument, in which shadowed TEM images of many of the samples used were analysed (Paynter, Reference Paynter1997). Figure 12 shows a comparison of the AR from the TEM images with the recalculated AR from the stopped-flow instrument, assuming no contribution of surface conductivity, for a range of very narrow size distribution kaolin samples that were prepared for the original study. In the development of the instrument, these data were used to validate the estimate of the surface to background conductivity ratio, showing good agreement between the ‘shape factor’ from the instrument and the AR from the TEM data.
Comparison of ARs from shadowed TEM images against values from the stopped-flow conductivity apparatus recalculated assuming zero surface conductivity. Data recalculated from Paynter (Reference Paynter1997).

With the assumption that the effect of surface conductivity can be neglected, the recalculated AR values become much lower than those from the TEM images. The higher values from the TEM images are perhaps a consequence of the adhesion of fine, low-AR particles to larger, higher-AR ones noted earlier and illustrated in Fig. 1, as the finer particles do not show up well in the images and are therefore not included in the analysis. Nevertheless, the large discrepancy between the ARs from the images and the values from the conductivity analysis does call into question whether the values from conductivity can be considered to be measures of the actual particle ARs. The approximation of clay particles as discs is clearly a limitation that may influence this. Figure 11 does show, however, that there is a strong correlation with the AR from microscopy, and thus the conductivity techniques provide a very useful comparison between samples.
Effect of AR on the stiffness of filled polypropylene
It is well established that the reinforcement of plastics by particulate fillers is dependent upon their AR, and several theories (Padawer & Beecher, Reference Padawer and Beecher1970; Affdl & Kardos, Reference Affdl and Kardos1976) include it as an important parameter. Most predict a strong increase in modulus (flexural or tensile) with increasing AR, which then levels off above an AR value of ∼30 for volume fractions above 10%. For typical clay mineral fillers, both theory and experimental data from filled polymers show an approximately linear relationship between modulus and loading up to 30% loading, so the effect of a filler can be measured at a single loading or as the gradient of a plot of modulus vs filler loading. For this work, samples of mica-filled polypropylene were made at loadings of 10%, 20% and 30% and the gradient of modulus against loading was measured.
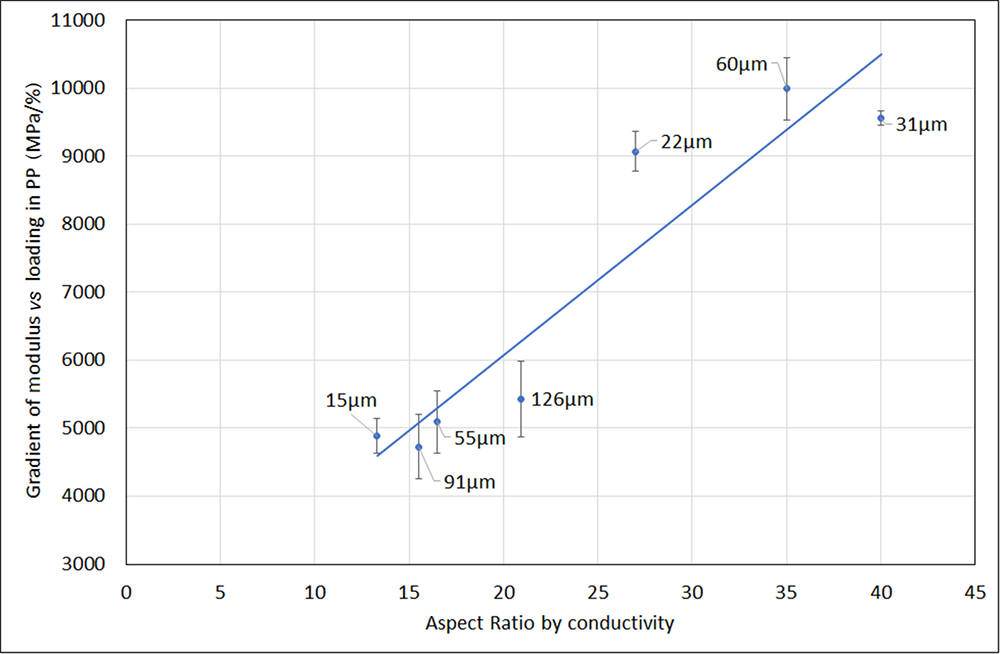
Figure 13 shows this for a range of mica samples of different sizes and ARs as measured by the conductivity method. There is a strong correlation between modulus and AR as expected, which is independent of particle size.
Plot of AR vs stiffness in mica-filled polypropylene (PP). Labels show median size (d 50) by volume measured by laser diffraction.

Conclusions
The simple method presented allows the measurement of the average AR of lamellar clay minerals using well-established relationships between AR and the electrical conductivity of suspensions of well-dispersed, randomly orientated, disc-shaped particles. It requires minimal sample preparation and can be used with industrial samples containing dispersants or other adsorbed species, and for a wide range of particle sizes. Both the theory used and the experimental results support the assumption that the AR measured by conductivity is independent of particle size and thus is suitable for coarse samples and broad distributions of particle sizes, which are challenging to characterize using combinations of laser diffraction and sedimentation or by shadowed electron microscopy techniques. Experimentation with various dispersants and over a wide range of background conductivities supports the assumption that the effects of the surface conductivity of particles can be neglected with the addition of a suitable concentration of background electrolyte. AR measured this way agrees well with the values obtained from the ratio of the conductivity of suspensions of aligned and randomly orientated particles, and it correlates approximately with values obtained from the comparison of particle sizes measured by laser diffraction and sedimentation. The flexural modulus of polypropylene filled with coarse mica particles correlates well with AR measured by conductivity for a wide range of particle sizes.
Competing interests
The authors declare none.