Introduction
Around the world, politicians with violent linkages win political office. In Providence, Rhode Island, after being “indicted on charges including extortion, kidnapping and assault,” mafia-tied Mayor Vincent “Buddy” Cianci won reelection (Smerling and Stuart-Pontier Reference Smerling and Stuart-Pontier2018). In the Philippines, citizens elected the “death squad mayor” Rodrigo Duterte, responsible for paramilitary forces' spree of extrajudicial killings. In India, as of May 2011, approximately 30 per cent of the 545 elected lawmakers in the lower house had cases pending against them for criminal linkages, many involving violence (Chemin Reference Chemin2012). In Kenya, Mexico, Iraq, El Salvador, Afghanistan, and Northern Ireland, local politicians with known ties to violent militias have regularly won elections (Bekoe Reference Bekoe2012; Hafner-Burton, Hyde, and Jablonski Reference Hafner-Burton, Hyde and Jablonski2014; Marten Reference Marten2007).
In sum, candidates with violent connections and allies win political office in all parts of the globe. While some win through manifest coercion, many others win through relatively free democratic elections. From normative and rule-of-law perspectives, this seems undesirable. Some pundits even criticize electoral democracy and point to the need for systems in which the “ignorant masses” are not allowed to vote—they make bad decisions (Brennan Reference Brennan2016). At the same time, while it has been remarked upon that citizens vote for and elect these politicians with coercive linkages, we do not fully understand the implications of their electoral selection on security and welfare.
I argue that politicians with coercive linkages generate a reduction in crime and insecurity, but have pernicious effects on the provision of other public goods. These politicians perform well in the domain in which they have a (perverse) comparative advantage, competence, and expertise: security. Their comparative advantage derives both from motivation—the prioritization of stability—and capacity—the wider repertoire of security enforcers upon which they can draw. In particular, they can deploy their connections with coercive actors to help keep sources of disorder under an iron fist and to restrain themselves (Gambetta Reference Gambetta1996; Lessing Reference Lessing2017). This is not to suggest that they necessarily govern in such a fashion only for benevolent purposes: to provide public security. Indeed, they may do so for private gain.
At the same time, politicians with violent ties tend to underperform in development and public goods provision relative to their noncoercive counterparts. I argue that these politicians' prioritization of security leads them to divert funding from development to licit and illicit security provision. This shift in resources from “butter” to “guns” erodes social welfare (Powell Reference Powell1993; Sexton, Wellhausen, and Findley Reference Sexton, Wellhausen and Findley2019). What results is a perverse cycle in which politicians with coercive linkages improve security in an oftentimes ethically perplexing fashion (Ahnen Reference Ahnen2007) and nurture their reputation as being competent on security issues, and this comes at the long-term cost of other public goods. This suggests that citizens often trade off not only justice, human rights, and legitimate rule of law by electing politicians with coercive linkages, but potentially also development.
This argument finds company in studies on the governance implications of elections that bring into positions of political power politicians with alternative violent linkages: to former military regimes,Footnote 1 to rebel groups,Footnote 2 and to cartels and gangs.Footnote 3 These studies similarly find that actors with varied coercive linkages often prove adept at keeping instability and violence at bay—engendering and sustaining a form of social order—but prove detrimental to provision of other public services.
One of the challenges in studying rule by politicians with coercive linkages, however, is endogeneity bias. A variety of factors may influence both the likelihood of them winning elections and of them governing in a specific fashion. The election of politicians is nonrandomly assigned and sound instrumental variables are unlikely. Therefore, understanding the causal effects of these significant elections becomes elusive. I seek to overcome this challenge by analyzing Colombian mayoral elections between 1997 and 2015 with a regression discontinuity (RD) design to compare paramilitary candidates for mayor who barely won with those who barely lost the elections.
The Colombian context offers a fertile environment in which to explore the question of violent-linked politician governance because it offers an ability to compare the administrations of a sufficient number of coercive politicians with those of politicians without coercive ties. Colombia has remained an electoral democracy throughout its violent history and has politicians both with and without connections to actors with blood on their hands (for additional context, see the Online Appendix). This article looks, in particular, at what has become known as “parapolítica” (“paramilitary politics”)—an illegal process of alliance between politicians and nonstate armed actors. According to Antonio Calvo, there was “no border” between the paramilitary groups and parts of the democratically elected political elite in which one could say, “this was the oil and this was the water”; rather, they were allied and “never detached.”Footnote 4 Parapolíticos formed the militia groups,Footnote 5 created political pacts with them, received their support, were themselves part of the paramilitary structures,Footnote 6 and were implicated in their atrocities (Daly Reference Daly2016; López Reference López2010; Romero Reference Romero2007).Footnote 7 Between 1988 and 2015, I find a total of 1,200 paramilitary-politicians in national and local politics.Footnote 8 The sizeable number of observations in the paramilitary-politics phenomenon at the local level—784—allows a RD design to overcome inference challenges and enables analysis of a usually intractable and yet important question: the implications for governance and public goods provision of the commonplace election of violence-linked leaders. I return to the key question of generalizability in the Conclusion.
The original dataset includes information on all paramilitary-tied candidates in mayoral elections during 1988–2015.Footnote 9 The RD design enables me to examine the administrations in municipalities ruled by paramilitary-politicians and those ruled by politicians without violent ties, where the treatment—a paramilitary-politician barely winning or losing an election—can be considered as if randomly assigned (Eggers et al. Reference Eggers2015; Lee Reference Lee2008). Accordingly, the design allows me to isolate the causal effects of having a paramilitary-politician in local office on governance outcomes.
In the first part of the article, I test whether being assigned a paramilitary-mayor influences security and public goods provision in the municipality during the mayor's term. Consistent with the theory, I find that these politicians improve security outcomes while degrading development ones. For example, on average, municipalities under the rule of a paramilitary-mayor that is barely elected experience not only an 85 per cent reduction in thefts, but also a reduction in social services, specifically, a 17 per cent drop in education coverage, compared to similar municipalities in which paramilitary candidates barely lose.
In the second part of the study, I conduct several analyses to probe the two mechanisms of the proposed explanation: capacity and motivation. Guided by my framework, I explore whether the effects of a narrow paramilitary-politician win on insecurity is more pronounced for those with the strongest coercive linkages with violent actors. I find that paramilitary-politicians' pacts with illegal enforcers seemingly enable them to dampen crime and insecurity irrespective of the exact nature of these pacts. Their moderating effect on crime also seems to derive from their licit alliances, which allow them to build up law enforcement capacity. Analysis of police reinforcements demonstrates that, relative to their nonparamilitary counterparts, paramilitary-politicians prove able to significantly augment their local police forces.
Additionally, I examine municipal government expenditures and find that paramilitary-politicians and nonparamilitary-politicians allocate resources in different ways, indicating that the paramilitary-politicians' prioritization of and resulting greater devotion of resources to (licit and illicit) security crowds out spending on public goods. Analysis of 195,715 paramilitary-politicians' Twitter posts illustrates that paramilitary-tied politicians tend to emphasize security over social welfare in their public discourse.
In the third part of the study, I exploit a most-similar research design of two, comparable municipalities in the northern Colombian department of El Cesar—Astrea and El Copey—in which a paramilitary-tied mayor narrowly won and narrowly lost the elections. I tease out how these politicians' coercive alliances and diversion of development funding to security forces influenced local governance outcomes on the ground. The qualitative analysis relies on fieldwork and interviews with paramilitary commanders and paramilitary- and nonparamilitary-politicians. The article concludes with the implications of the project for existing and future research.
How Do Politicians with Coercive Linkages Govern?
Scholars of political and criminal violence highlight the trade-offs, tensions, and dilemmas inherent in the inclusion of politicians with coercive linkages in democratic politics. Existing literatures focus on politicians' linkages to militaries, rebels, and organized crime, leaving those to militias underexplored. On the one hand, scholars express concerns that, absent safeguards, the election of politicians with coercive connections emboldens violence and jeopardizes welfare (Mansfield and Snyder Reference Mansfield and Snyder2007; Paris Reference Paris2004). Skeptics claim that the political inclusion of characters with violent ties further undermines the power of “liberal, programmatic political” actors (Reilly Reference Reilly2002). Chemin (Reference Chemin2012) and Prakash, Rockmore, and Uppal (Reference Prakash, Rockmore and Uppal2019) posit that politicians with coercive linkages also rule in a fashion that is particularly detrimental to development. In India, these politicians increase levels of crime, contribute to corruption, decrease consumption by vulnerable sections of society, and undermine provision of public goods, such as roads and nighttime lights.Footnote 10 Arias (Reference Arias2006) argues that the election of politicians linked to violent traffickers engenders persistently high levels of violence in Rio de Janeiro's favelas. Most closely related to my context, Fergusson et al. (Reference Fergusson2021) propose that, armed with private militias, the traditional elite's loss of elections to excluded left-wing parties in Colombia increases right-wing violence. Scholars hurl similar critiques at militarized security and mano duro (iron-fist) policies, which undermine human rights and replace alternative crime-reduction strategies, such as human capital enhancement and community policing (Ahnen Reference Ahnen2007; Arias and Ungar Reference Arias and Ungar2009; Rivera and Zarate-Tenorio Reference Rivera and Zarate-Tenorio2016).
On the other hand, scholars observe that pacts between politicians and violent actors have, at times, reduced insecurity in places as diverse as Chicago (where the former commissioner of police admitted: “We do not mind if the gangs engage in illicit activities as long they keep a lid on violence”Footnote 11), Italy (where regions governed by mafia-linked politicians experienced low levels of petty crimeFootnote 12), and El Salvador (where the government-brokered truce between the Mara Salvatrucha and Mara 18 gangs halved killingsFootnote 13). Similarly, in contexts of political violence, ceding to rebel and militia governance, under certain conditions, has had the effect of establishing and sustaining social order (Arjona Reference Arjona2016; Staniland Reference Staniland2012). Researchers have promoted provisions transforming nonstate armed actors into politicians in order to sustainably end violence (Hartzell and Hoddie Reference Hartzell and Hoddie2007; Matanock Reference Matanock2017; Walter Reference Walter1999). Indeed, citizens tend to vote prospectively in this fashion, electing militarily winning belligerent successor parties because they are deemed best able to provide security and order (Daly Reference Daly2019). While associated mano duro policies have been unequivocally critiqued on human rights grounds, few systematic studies have assessed the effect of these policies on public security and development (Ahnen Reference Ahnen2007).
In sum, the scholarly literature on elections of politicians with varying, violent linkages converge on the belief that these politicians have an effect on levels of insecurity and public goods provision during their administrations, but there exists disagreement about the direction of this effect. Importantly, it could be that places in which these politicians win are those that exhibit higher levels of violence, crime, and poverty, and lower levels of stability and public services, suggesting that these electoral outcomes are the result, rather than the cause, of poor governance. Moreover, the mechanisms by which these politicians with coercive linkages influence the quality of governance and democracy remains underspecified. Is it through their backgrounds and experience, their emphasis and prioritization, or their alliances and resources that they affect these outcomes (McDermott and Panagopoulos Reference McDermott and Panagopoulos2015; Teigen Reference Teigen2013)?
Theoretical Framework
To understand puzzling votes for successor parties to coercive actors that used violence against the civilian population, Daly (Reference Daly2019) demonstrates that citizens elect these actors because they perceive them to be the most credible providers of future security: Restrained Leviathans. Daly (Reference Daly2019), however, leaves unanswered whether, in hindsight, electing actors with coercive linkages on promises of stability and order proves correct. Do these politicians, in fact, realize their campaign promises and at what cost to citizen welfare?
I propose that electing politicians with coercive linkages does have a stabilizing effect on insecurity but a pernicious one on other public services. These politicians influence governance outcomes through two mechanisms. One is capacity—the power “to overawe,” which paramilitary-tied mayors enjoy due to their connections with strongmen and the coercive apparatus; the second is motivation—paramilitary mayors prioritize security over other public goods and engage in butter to (illicit) guns transfers. I elaborate on each mechanism in turn.
Once in political office, paramilitary-mayors' coercive allies tie their own violent hands and wreak less havoc. Given their contribution to insecurity, this self-restraint checks violence. They also, however, reduce general instability and crime. Paramilitary-politicians' dampening, if chilling, effect on crime results from the wider array of security providers upon which they can call. In particular, they enjoy pacts with illegal nonstate security forces able to provide order over the criminal underworld (Moncada Reference Moncada2013; Ungar Reference Ungar2007). Their prioritization of security aligns their interests with the prerogatives of licit security forces, enabling their administrations to build up local law enforcement.
I argue that these positive short-term effects on security may come at a long-term significant cost. First, tough-on-crime approaches erode public safety over the long term (Ahnen Reference Ahnen2007; Lessing Reference Lessing2017). These politicians may reduce levels of crime, but by sowing further terror, they likely end up undermining the rule of law over time. Moreover, paramilitary-politicians' prioritization of security over other public goods crowds out social development expenditures. They intentionally emphasize security issues over civilian welfare ones and divert funds intended for welfare to sponsor (often illicit) security forces. In particular, as Eaton (Reference Eaton2006) and Ch et al. (Reference Ch2018) illustrate, they use their control of subnational offices to appropriate fiscal transfers intended for social public goods (education, health, and infrastructure) to instead fund military operations. The systematic practice of siphoning funds intended for social welfare to finance paramilitary forces means that in paramilitary areas, as Acemoglu, Robinson, and Santos (Reference Acemoglu, Robinson and Santos2013) reveal, “citizens obtain fewer public goods.” Such a budget reallocation, even if small, cannibalizes spending on social services and results in catastrophic welfare outcomes, as Sexton, Wellhausen, and Findley (Reference Sexton, Wellhausen and Findley2019) demonstrate with the case of infant mortality rates in Peru. Similar butter-to-guns trade-offs (and tragedies) have been found to manifest in other contexts (Mintz Reference Mintz1993). Lack of education spending, in particular—shown to be an important antidote to crime—reduces public safety over time (Rivera and Zarate-Tenorio Reference Rivera and Zarate-Tenorio2016).Footnote 14 The election of politicians with coercive linkages therefore serves to dampen crime but has likely detrimental implications for social development.
Data on Governance of Paramilitary-Tied Mayors
I explore these tensions between security and nonsecurity public service provision in the context of Colombia's paramilitary-linked mayors. I constructed an original database of militia-tied mayors and their governance records. To do so, I first consulted official data I requested from the Colombian Supreme Court on politicians who were being investigated or were convicted by the judicial authorities for relationships with illegal armed groups from January 1980 to February 2016. These politicians ran both on established right-wing and center-right party lists and on paramilitary party tickets, including those of Alas Equipo Colombia, Colombia Viva, Convergencia Ciudadana, Partido de Integración Nacional, Partido de Opción Ciudadana, Colombia Democrática, and Partido Opción Ciudadana.Footnote 15 I digitalized the responses to these “derechos de petición” (rights to petition) and reviewed 42,000 pages of sentencing documents to ensure inclusion of all politicians suspected, under investigation, or convicted of paramilitary linkages. I then examined public datasets and research reports, including the 2013 Verdad Abierta Parapolíticos project, 2013 Misión de Observación Electoral's data, Congreso Visible reports, Fundación Paz y Reconciliación (PARES) publications, and multiple secondary sources to verify information for each individual paramilitary-politician case.Footnote 16 The article focuses on mayoral elections through the year 2015. Therefore, it is possible to review judicial records and verify that the militia mayors were not maliciously or incorrectly accused of paramilitary linkages, in which case they would likely have been exonerated by 2021. I exclude such cases from the analysis, providing greater confidence in the coding of the paramilitary mayors. The participation of several coders enhanced intercoder reliability.
After completing and verifying the names of the paramilitary-tied politicians, I gained information about their judicial status from 60 sentences of the Supreme Court, totaling nearly 6,000 pages, provided to me by the Fiscalia General de la Nación. For information about the candidates' individual characteristics, I used the datasets listed earlier and national and regional newspapers and journals, including El Espectador, El Tiempo, El Pilón, Heraldo, La Silla Vacía, Verdad Abierta, La Nación, Revista Semana, Diario del Norte, Hoy Diario del Magdalena, El País, Vanguardia, El Nuevo Día, La Patria, Prensa Libre Casanare, Diario de Casanare, El Heraldo de Urabá, El Diario del Llano, and El Universal. Electoral data were derived from the Centro de Estudios sobre Desarrollo Económico and cross-checked using the original records of the Registraduría Nacional del Estado Civil. For missing election data, I consulted newspapers and contacted political party offices. The individual-level dataset registers 784 paramilitary mayors. I restrict the analysis to the post-1997 data for which runner-up local election results and municipal-level governance data are available for all 1,122 Colombian municipalities.Footnote 17
I seek to analyze how these paramilitary-tied mayors governed. To do so, I explore two dimensions of governance: provision of public security and provision of other public services. To measure levels of insecurity and crime, I use three main indicators: (1) the total number of thefts (of cars, motorcycles, stores, people, banks, and residences); (2) the number of robberies against people; and (3) the number of incidents of bodily harm (interpersonal violence). These data derive from the Policía Nacional.Footnote 18
I pause to consider whether these data are reliable and whether paramilitary mayors may have manipulated how the data were recorded. Could these mayors have discouraged local police from recording cases or otherwise altered crime reporting such that, rather than actually solving security problems, they just cooked the books? In this case, any finding of security improvements would be a mere artifact of the data.
There are several pieces of evidence that moderate these concerns of bias. I outline them here and engage in more extensive validity tests in the Online Appendix. First, in Colombia, crime statistics are highly centralized through the Criminal, Contraventional, and Operational Statistical Information System of the National Police (SIEDCO). Patrols submit a report to the Automatic Dispatch Center (CAD), which immediately enters the information into the national SIEDCO system, based in Bogotá. Crime reporting is therefore systematized, does not pass through the local mayor's office, and, given rigorous controls, is not likely to be easily altered (Policía Nacional de Colombia 2021). Additionally, the National Police Central Command in Bogotá sets national goals upon which local police commanders are evaluated and rewarded, rendering the incentives for manipulation the same across the treated and control samples. The same goals and crime-communication practices thus apply to localities governed by paramilitary-mayors as to those of their nonparamilitary counterparts.Footnote 19 Moreover, as I show in Table A.2 in the Online Appendix, localities where the paramilitary-mayors won and where they lost were equally impacted and controlled by the paramilitaries.
Second, I evaluate alternative sources of crime and violence statistics—those of Colombia's National Forensics Institute, its National Center for Historical Memory, and its Victims Unit. I find that these data correlate with the National Police data equally where paramilitary mayors narrowly won and where they narrowly lost (see the Online Appendix). I also find that the results hold if I use alternative sources of crime statistics as the outcomes in my main analyses. Finally, I reviewed a random sample of the judicial sentences, searched eight years of national and local news, and engaged in in-depth interviews with experts on Colombian policing. I find little systematic evidence of paramilitary-mayors' interfering in police crime reporting. Among experts, there emerges a consensus, well described by one: “There are always biases and issues with data, but these are evenly distributed. There is no reason to think they were more pronounced where paramilitary-mayors governed.”Footnote 20 I therefore follow convention among scholars of violence in Colombia, who “regard the police data as high quality” (Avellaneda Reference Avellaneda2009), and use these data in the main analyses.
I calculate the averages of the crimes during the mayors' tenures in office. The crime variables are computed as rates per 1,000 inhabitants. Given the level of skewness in these indicators, I take the log of each of the three measures, which facilitates the interpretation of the treatment effects as percentage changes.
For municipal performance in nonsecurity public goods provision, I examine levels of development, as captured by infant mortality rates from Departamento Administrativo Nacional de Estadística (DANE)'s Estadísticas Vitales. I also derive the rate of educational coverage calculated as the total number of enrolled students divided by the total number of school-age individuals, provided by the Colombian Ministerio de Educación. For these measures, I compute the averages during the mayors' administrations. Although spending is a mechanism of the theory, given the slow-moving nature of development indicators, I also examine expenditures as a proxy for nonsecurity public goods provision.Footnote 21
Research Design
This project uses a RD design. Conditions of insecurity and lack of development could facilitate the electoral success of politicians with coercive linkages, rather than these politicians causing changes in insecurity and development. Moreover, there could be unobserved factors determining both the election of these types of politicians and governance outcomes. The RD design enables the estimation of the treatment effect in a nonexperimental setting where treatment is determined by whether an observed “assignment” variable exceeds a known cutoff point, with individuals with scores just below the cutoff serving as good comparisons to those just above the cutoff. While electoral performance is determined by a multitude of factors, including those of an institutional, economic, political, and social nature, the precise vote totals are subject to a “nontrivial random component,” and candidates cannot fully control how many votes they receive on Election Day (Lee Reference Lee2008, 684). As such, whether a candidate barely wins or barely loses an election may be viewed “as if” it was a random event, which permits the credible estimation of the causal effects of this electoral victory. Many have used this design to study the effect of holding office on different political outcomes (Eggers et al. Reference Eggers2015; Erikson and Titiunik Reference Erikson and Titiunik2015; Galasso and Nannicini Reference Galasso and Nannicini2011; Klasnja and Titiunik Reference Klasnja and Titiunik2017; Lee Reference Lee2008; Querubin Reference Querubin2016).
I use this strategy to compare the governance outcomes in places in which paramilitary-politicians narrowly won against those in places in which paramilitary-politicians narrowly lost. In these elections, the distribution of potential outcomes is a smooth function of the vote margin. On either side of the threshold, the outcomes of winners can be viewed as valid counterfactuals for the outcomes of losers. In the analysis, the unit of analysis is the municipality. I take all mayoral elections in Colombia during 1997–2015 and restrict the sample to the races in which a paramilitary-politician and a nonparamilitary-politician were the top two finishers (515 observations). I look at the paramilitary-politician's vote share minus that of their strongest contender. The margin of victory therefore ranges from −1 to 1; the paramilitary-politician won when their vote margin was positive and lost when it was negative. I examine the local average effects on security and public goods outcomes at the cutoff of a locality being “treated” with a paramilitary-mayor against the “control” case in which it received a nonparamilitary-mayor.
RD designs can be invalid if individuals can precisely manipulate the “assignment variable.” To test the validity of the design, I follow now-common practice and first analyze the density in the margin of victory for the paramilitary-tied politicians.Footnote 22 I look for an abnormal number of observations immediately above or below the threshold, which would suggest that the candidates, particularly the paramilitary ones, could manipulate the election results. Figure A.1 in the Online Appendix shows the graphical results of the McCrary test, which analyzes possible anomalous jumps in the distribution of the running variable. The jump at the threshold is not statistically significant (the p-value of the log difference in heights is higher than 0.1), suggesting that it is a normal jump that also exists at different values of the distribution. This indicates that candidates could not precisely influence close elections and that mayors' administrations on either side of the cutoff may be comparable (McCrary Reference McCrary2008). I also use Cattaneo, Frandsen, and Titiunik's (Reference Cattaneo, Frandsen and Titiunik2015) local polynomial density estimator to estimate whether the density of the margin-of-victory variable is continuous in the neighborhood of the threshold. The p-value of 0.34 confirms that the test fails to reject the null hypothesis that the density of the running variable is continuous at the cutoff.
I engage in a second check of the validity of the design in which I verify whether there is a correlation between other pre-treatment variables and the margin-of-victory outcome. To be considered as if random, whether a paramilitary candidate barely wins or barely loses a mayoral election should be unrelated to variables that occurred and were captured before the election occurred; there should be no discontinuities in the distribution of these other factors. In Table A.1 in the Online Appendix, I estimate the RD model using one-period-lagged outcomes as the dependent variable to check whether there is a significant effect of having a paramilitary-mayor on pre-treatment outcomes. None of the RD estimates are significant, suggesting that there is not a pre-trend on the outcomes that may explain the treatment effects. In Table A.2 in the Online Appendix, I show the results of the RD models on pre-treatment outcomes and an additional set of covariates: population, log of urban population, and log of gross domestic product (GDP) per capita. None of these estimates is statistically significant, indicating that there are no systematic baseline differences among municipalities that barely elected a paramilitary-mayor and those that did not. In the placebo tests, there exist no discontinuities, further validating the RD design and suggesting, in particular, that places with paramilitary- and nonparamilitary-mayors did not differ in their pre-treatment levels of insecurity and public goods provision.Footnote 23 All five outcome variables of interest are balanced at the baseline; prior to electing or not electing a paramilitary-mayor, the municipalities in the sample showed no systematic differences in terms of thefts, robberies, bodily harm, education, and infant mortality. This bolsters the idea that the findings would not be a statistical aberration, but are, instead, evidence that the type of mayor elected has a direct impact on governance.
The paramilitaries were known to have engaged in a wide variety of electoral coercive practices (Acemoglu, Robinson, and Santos Reference Acemoglu, Robinson and Santos2013), rendering the assumption of the RD design potentially violated. I analyze if there was also balance in the pre-treatment levels of paramilitary violence and control [and Fuerzas Armadas Revolucionarias de Colombia (FARC) violence and control] in the municipalities in which the paramilitary-politicians barely won and lost. Table A.2 in the Online Appendix shows no significant difference in rates of attacks from these illegal armed groups or in their levels of territorial control. This suggests that there are no discernable pre-treatment differences in armed group coercion or intimidation. As a robustness check, I further exclude the municipalities flagged as exhibiting medium to high risk of electoral fraud according to the Misión Observatorio Electoral (MOE). To do so, I digitized the MOE reports of each Colombian municipality for each election and extracted an index of not only “active” risk factors—electoral violence (assassination attempts, threats, homicides, and kidnappings of candidates or current politicians; forced displacement; and illegal armed group presence)—but also “passive” ones more imperceptible to electoral observers, including atypical electoral participation, anomalies in null votes, limitations on electoral competition, unusual rates of candidate withdrawal, and voter intimidation. Excluding places with electoral risk, I find that the results described in the next section hold (see Table A.5 in the Online Appendix).Footnote 24 It is important to note that this article is not advancing that no electoral coercion took place, but rather that there also existed political competition and voter choice in these municipalities.Footnote 25
Analysis
To analyze the effect of a violent politician barely winning or losing a mayoral election on governance outcomes, I estimate the following RD model:
yit = f (margin)it + β1 (parapol)it + ɛ,
where: yit is the outcome of interest in time t for municipality i; f(margin)it is a function of the paramilitary-politician margin of victory (the forcing variable) in the municipal election; and (parapol)it is an indicator variable equal to 1 if the paramilitary-politician candidate won and 0 otherwise. The coefficient B1 represents the local average treatment effect (LATE) at the threshold of the margin-of-victory forcing variable, which is the difference between the local regressions' two estimated intercepts. For the RD estimation, I first use local polynomial methods with optimal bandwidths and robust standard errors (Calónico, Cattaneo, and Titiunik Reference Calónico, Cattaneo and Titiunik2014). Typically, an optimal bandwidth obtained by minimizing the mean-squared error would lead to a relatively large window. Thus, I present the results using robust confidence intervals (Calónico, Cattaneo, and Titiunik Reference Calónico, Cattaneo and Titiunik2014). I also estimate the RD effect using predetermined bandwidths of 10 and 5 percentage points from the threshold, and I estimate the models with the inclusion of controls, using Calónico et al.'s (Reference Calónico2018) covariate-adjusted RD.
The Governance Records of Colombian Paramilitary-Mayors
Table 1 shows the difference in means across the governance outcomes in the sample of municipality-years used for the RD models: those in which a paramilitary-candidate competed for office. In general, paramilitary-mayors' municipalities exhibit lower crime rates—lower total thefts, robberies, and interpersonal violence per 1,000 inhabitants. At the same time, relative to their nonparamilitary counterparts, these mayors tend to perform poorly in terms of social welfare, with, on average, higher infant mortality rates and lower educational coverage and expenditures.
Difference in means: security and public goods outcomes

Notes: Standard errors in parenthesis. Thefts, robberies, and bodily harm are measured in logs per person. * p < 0.1; ** p < 0.05; *** p < 0.01.
Table 2 shows the RD coefficients for the security outcomes. For all three outcomes—thefts, robberies, and personal injuries—and for every bandwidth choice, there is a negative effect of a narrow paramilitary-tied politician win, suggesting that having this type of mayor in office causes a reduction in crime and improvement in security. As the dependent variable is logged, for substantive interpretation, I exponentiate the coefficients. The analysis presented in the first column reveals that, when a paramilitary-mayor barely wins an election, the municipality experiences, on average, a (exp(−1.90) – 1) × 100 = 85 per cent reduction in thefts, compared to when this type of politician barely loses the election. This effect is statistically significant at the 0.05 level for the three models. Moreover, we see that these effects are also pronounced and significant for rates of victimization and bodily harm. Figures 1 and 2 illustrate the jump at the discontinuity with a RD plot of personal injuries and thefts, where the dots are optimally chosen binned means and the line is a linear fit that includes the 95 per cent confidence interval. These effects hold when I use alternative security indicators from the police, Defense Ministry, and victims' registry (see Table A.12 in the Online Appendix).
RD estimates: security outcomes

Notes: Standard errors in parentheses. Columns 1, 4 and 7 use the package “rdrobust” developed by Calonico et al. (Reference Calonico, Cattaneo, Farrell and Titiunik2017), the computed optimal bandwidth and a triangular kernel; these columns report robust point estimates and standard errors. The other models use a local linear regression with robust standard errors. *** p < 0.01; ** p < 0.05; * p < 0.1.
RD effect of paramilitary-mayor winning on bodily harm.
Note: The horizontal axis displays the winning margin of the paramilitary-mayors (winners and runners-up). The dashed lines are the linear fit. The solid lines are the 95 per cent confidence intervals at both sides of the threshold.

RD effect of paramilitary-mayor winning on thefts.
Note: The horizontal axis displays the winning margin of the paramilitary-mayors (winners and runners-up). The dashed lines are the linear fit. The solid lines are the 95 per cent confidence intervals at both sides of the threshold.

At the same time, the analyses in Table 3 show that a paramilitary-tied politician barely winning a closely fought election tends to harm the municipality on dimensions of public goods, such as education coverage, though the results are weaker. All the point estimates are consistently negative. Models 1 and 3, in particular, show that among municipalities that elected paramilitary-mayors, educational coverage is 17 percentage points lower compared to municipalities in which such mayors narrowly lost. The coefficients on education in these specifications are significant at conventional levels. For infant mortality rates, we see that the effect points in the same direction: paramilitary-mayors tend to increase these rates, but the results are not statistically significant. These effects on education coverage and infant mortality rates are illustrated in Figures 3 and 4. These variables tend to be slow to change and are measured over the mayors' short administrations. In the following section, I analyze the effect of a narrow paramilitary-mayor win on expenditures on public goods, a variable more mutable over a mayor's term. I find a strong negative effect. The coefficients and differences in the means on public services and spending on these services may indicate, though by no means prove, that paramilitary-politicians' rule produces longer-term adverse effects on development outcomes.
RD estimates: public goods outcomes

Notes: Standard errors in parentheses. Columns 1 and 4 use the package “rdrobust” developed by Calonico et al. (Reference Calonico, Cattaneo, Farrell and Titiunik2017), the computed optimal bandwidth and a triangular kernel; these columns report robust point estimates and standard errors. The other models use a local linear regression with robust standard errors. *** p < 0.01; ** p < 0.05; * p < 0.1.
RD effect of paramilitary-mayor win on education coverage.
Note: The horizontal axis displays the winning margin of the paramilitary-mayors (winners and runners-up). The dashed lines are the linear fit. The solid lines are the 95 per cent confidence intervals at both sides of the threshold.

RD effect of paramilitary-mayor win on infant mortality rate.
Note: The horizontal axis displays the winning margin of the paramilitary-mayors (winners and runners-up). The dashed lines are the linear fit. The solid lines are the 95 per cent confidence intervals at both sides of the threshold.

Given the limited sample size, these are strong results on security and education. I show that they are robust to the inclusion of covariates, using Calónico et al.'s (Reference Calónico2018) covariate-adjusted RD, which increases precision (see Tables A.6 and A.7 in the Online Appendix). In sum, politicians with ties to armed militias do indeed influence governance outcomes. They tend to dissuade and mitigate crime and insecurity, but this likely comes at a cost to social welfare.
Why Paramilitary-Politicians Reduce Insecurity and Hamper Development
Why and how do these narrow wins by paramilitary-tied mayors influence crime rates and the provision of nonsecurity public goods in the observed fashion? This section uses data on politicians' ties to the paramilitaries, police reinforcements, municipal expenditures, transparency, party affiliation, and public discourse to evaluate the framework's proposed mechanisms of security capacity—power to self-restrain and to “overawe” threatsFootnote 26—and security prioritization—diversion of social spending from other public services—and to test alternative pathways. I then turn in the article's final section to qualitative case studies to further probe the mechanisms.
Mechanism 1: Capacity—Licit and Illicit Security Alliances
I argue that politicians with violent linkages have a comparative advantage in the provision of security because of the coercive capacity afforded by their wider repertoire of (legal and illegal) security enforcers. If alliances with illicit armed actors partially underpin the paramilitary-politicians' moderating effect on crime and insecurity, we would expect to see evidence of such pacts, and we might anticipate the effect on security to be even greater among the politicians with the densest ties to coercive actors able to check their own violence and deter that of others.
All “paramilitary-mayors” had established linkages to the paramilitaries, but there were differences in the degree and strength of these ties. Some of the mayors were part of the armed paramilitary structures or were responsible for founding the paramilitary forces, whereas others had looser alliances with the paramilitaries: the paramilitaries backed them and conspired with them, but they were neither paramilitaries themselves nor their creators. To better differentiate the strength of the linkages and to provide evidence of the systematic use of pacts in localities governed by paramilitary mayors, I returned to the judicial sentences and extracted information on the exact pacts, including Pacto de Uraba, Pacto de Chivolo, Pacto de Ralito, Pacto de Barranco de Loba, Pacto de Casanare, Pacto de Granadazo, Pacto de Marizco, Pacto de Pijivay, Pacto de Díficil, Reunión de las Canarias, and Pacto Uraba Grande Unida y en Paz. A total of 74 per cent of the paramilitary-mayors were signatories to these pacts; the remaining 26 per cent fell outside of these formal agreements to found and grow the paramilitaries, but were nonetheless charged with ties to the paramilitary forces. Table 4 presents an RD model in which the treatment variable (barely winning the election) is interacted with a dummy variable indicating the mayor's links with the paramilitary structure. The results suggest that all paramilitary-mayors—irrespective of the density of their linkages—benefit from their alliances with these illegal enforcers, which facilitate their production of iron-fist security.
RD estimates by strength of violent linkage

Notes: Standard errors in parentheses. All models use a local linear regression with robust standard errors. *** p < 0.01; ** p < 0.05; * p < 0.1.
If paramilitary-politicians' dampening effect on insecurity and crime stems from a broader repertoire of security providers, including licit law enforcement, we should observe divergence in security policies among localities in which paramilitary mayoral candidates barely won and those in which they barely lost the elections. In Colombia, mayors control local security policy and spending.Footnote 27 However, police deployment is decided by the centralized National Police, with mayors only able to request new police officers from Bogotá police headquarters (Eaton Reference Eaton2006). At the beginning of the period of analysis, as many as 200 or approximately 20 per cent of all municipalities were without police protection.Footnote 28 I propose that paramilitary-politicians' emphasis on stability and order—even if for different and nefarious reasons—aligned their prerogatives with those of the National Police, giving them greater access to request and be granted law enforcement deployment.Footnote 29 To explore this mechanism, I examine data from Cortés et al. (Reference Cortés2012) on police reinforcements, which capture the number of years of a mayor's term in office that the municipality received reinforcements from the National Police, with a maximum of four. In a simple difference-in-means test, municipalities under paramilitary-politician rule augment their police presence. Likewise, in Table 5, I exploit an RD approach and compare the increases in police presence in municipalities with narrowly elected paramilitary- and nonparamilitary-mayors. Table 5 provides evidence that having a paramilitary-tied mayor causes an increase in police reinforcements.Footnote 30
RD estimates on police reinforcements

Notes: Standard errors in parentheses. Model 1 uses a local linear regression with robust standard error. *** p < 0.01; ** p < 0.05; * p < 0.1.
While paramilitary-politicians, on average, reduce levels of insecurity and crime, in electing these mayors, the evidence suggests that citizens opt for administrations that tend to produce adverse effects on other governance outcomes, notably, education, which is considered the optimal indicator of municipal performance (Avellaneda Reference Avellaneda2009). Why do politicians with coercive linkages, who are seemingly successful at security provision, perform relatively poorly on this other governance outcome?
Mechanism 2: Motivation—Crowding Out Spending on Citizen Welfare
To test whether the negative social welfare effects stem from paramilitary-mayors' prioritizing and allocating budgets away from and misappropriating public funds intended for social services, I compare the municipal spending on education of violence-linked mayoral candidates who barely won and lost the elections. These data derive from the Panel de Buen Gobierno data of the Universidad de los Andes. Table 6 presents RD models on this expenditure outcome, measured in logs per person. The first column shows that paramilitary-mayors spend approximately (exp(−0.94) – 1) × 100 = 60.9 per cent less on education. This diversion of funds away from social welfare (most often funneled to armed groups) could help explain the adverse implications for public goods outcomes described earlier. Figure 5 illustrates this result. In the Online Appendix, I further verify that this divergence in public goods expenditures does not derive from differential fiscal performance. There appears to be little difference between barely elected paramilitary- and nonparamilitary-mayors on the maintenance of a balanced budget (see Table A.8 in the Online Appendix).
RD estimates on spending and corruption variables

Notes: Standard errors in parentheses. Columns 1 and 4 use the package “rdrobust” developed by Calonico et al. (Reference Calonico, Cattaneo, Farrell and Titiunik2017), the computed optimal bandwidth and a triangular kernel; these columns report robust point estimates and standard errors. The other models use a local linear regression with robust standard errors. *** p < 0.01; ** p < 0.05; * p < 0.1.
RD effect of paramilitary-mayor winning on education spending.
Note: The dashed line is the linear fit on both sides of the threshold. The solid line is the 95 per cent confidence interval.

Anecdotal evidence is consistent with the crowding-out and diversion logic (for additional examples, see Table A.16 in the Online Appendix). Paramilitary-mayor Angel Villarreal Barragán, for instance, used 47 million pesos from public works and infrastructure contracts to fund security forces, likely also providing his comrades employment. In Santander, through bureaucratic payroll and public contracts, mayors diverted 40 per cent of their local budgets to fund private security forces (Periódico Portada 2013). In Santa Marta, Francisco “Chico” Zúñiga's government redirected funds from the health promotion agency Sol Salud to finance the paramilitaries,Footnote 31 while in Riohacha, Mayor Wilder Ríos was detained for diverting 148 million pesos destined for healthcare to instead finance militia groups.Footnote 32 Judicial records reveal how Gabriel Antonio Rivera Cueto and Nilson Navajas sponsored paramilitary groups by diverting public social resources in Suan, Atlántico, and Coveñas, Sucre, respectively.Footnote 33 A report by the Comptroller General of the Republic found: “Of the total royalties received by the [Cesar] departmental government during the period 1998–2002, only one quarter was allocated to the basic sectors required under the current legislation.… For this reason, the advances … in the sectors of education, health, aqueduct and sewage are not the expected ones.”Footnote 34
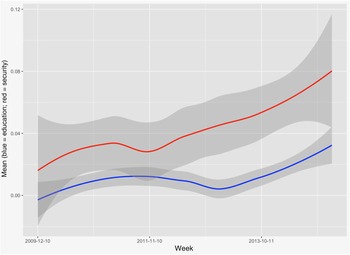
If paramilitary-politicians' impact on public goods outcomes stems from their emphasis on security over education, we would expect to observe, at a minimum, evidence of this prioritization in their public discourse. Their rhetoric should also likely diverge from that of nonparamilitary-politicians. I have data only on the 195,715 Twitter posts of paramilitary-politicians, and given the life span of Twitter, these include only a relatively recent period (post-2010). I nonetheless see whether their propaganda follows the anticipated pattern. Figure 6 shows the average weekly tweets devoted to public goods and demonstrates that paramilitary-politicians allocated, on average, twice as many tweets to security as to education.Footnote 35
Paramilitary-politicians' tweets on security and education. The gray shading denotes 95% confidence intervals for the average Tweets over time.

Alternative Mechanisms: Corrupt, Inept, or Ideological?
The framework suggests that the paramilitary-politicians' public goods record results from (illegal) butter-to-guns transfers rather than from these politicians' general kleptocratic management of resources and “plunder[ing of] public finances.”Footnote 36 If a general corruption mechanism were operative, we should observe significant differences in levels of corruption in treated and control municipalities. I use the Procuraduria indicator, “Indice de Gobierno Abierto,” ranging from 0 to 100, which captures the levels of transparency and corruption of the local governments. Models 4–6 in Table 6 suggest that municipalities governed by paramilitary-politicians tend to suffer on transparency, but the effect is not significant by conventional standards. That the paramilitary-tied politicians spend less on social welfare further suggests that the mechanism underpinning their poor public goods record is also not mere ineptness (Avellaneda Reference Avellaneda2009; Boyne Reference Boyne2003).
It may be that these politicians undercut public services because of their anti-redistributive ideology. Across Latin America, the political Right has been associated with mano dura (iron-fist) policies and coercive responses to crime, and the Left with noncoercive crime-reduction strategies, including social welfare policies and human capital enhancement (Ahnen Reference Ahnen2007; Holland Reference Holland2013; Rivera and Zarate-Tenorio Reference Rivera and Zarate-Tenorio2016). The paramilitary-politician pacts sought to “refound the country” and consolidate a conservative, right-wing platform centered on the “natural right of legitimate self-defense” and the state's responsibility to defend its citizens (López Reference López2010; Romero Reference Romero2007). Rural elites created paramilitaries to protect elite interests (Romero Reference Romero2007). Consistent with this, Ch et al. (Reference Ch2018) demonstrate that locations with paramilitary violence experienced, for example, greater land formalization. At the same time, in the highly competitive districts upon which this article focuses, paramilitary- and nonparamilitary-mayors oftentimes occupied similar positions on the ideological spectrum, as indicated by their comparable party affiliations shown in Figure A.2 in the online Appendix.Footnote 37 Paramilitary-mayors' coercive linkages and priorities, rather than their partisanship, I argue, drive their impact on public goods.
Probing the Mechanisms of Paramilitary-Politician Governance in Cesar
To further construct how mayors with and without paramilitary linkages govern, I engage in controlled, most-similar comparative case studies of two municipalities in the northern Colombian department of Cesar: Astrea and El Copey. Separated by less than 100 km, the municipalities exhibit many similarities that make them good cases for comparison. They have comparable population sizes, share a local economy based on cattle ranching and mining, and experienced a common history of politics and violence.Footnote 38 Especially relevant is that the two cases comprised part of the baptized “G8” localities: a paramilitary pact to seize political power by placing mayors in each municipality.Footnote 39 Astrea and El Copey therefore prove well matched in terms of violent, criminal efforts at manipulating elections. However, in 2007, the two municipalities diverged.
In this year, the paramilitary-candidate Edgar Orlando Barrios Ortega narrowly won the mayoral race in Astrea. He was convicted of crimes, including forced displacement of civilians and alliances with illegal armed groups to commit violence.Footnote 40 In El Copey, in the same year, the paramilitary-candidate Wilfrido Enrique Ruiz Rada narrowly lost the mayoral contest to a nonparamilitary-candidate, Pablo Emilio Ordonez Simanca, by a mere 394 votes.Footnote 41 Governance outcomes between these mayors' administrations mirrored those across the full sample of close elections. In Astrea, the paramilitary-mayor oversaw reductions in crime and insecurity but also eroded social welfare relative to El Copey. To illustrate the mechanisms that generated these governance outcomes, I conducted interviews with violent and nonviolent politicians and paramilitaries, and drew on local press, judicial sentences, paramilitary testimonies under the Justice and Peace Law, and victim reports for the Centro de Memoria del Conflicto project.
Why did nonparamilitary-tied Ordonez Simanca outperform paramilitary-tied Barrios Ortega on social welfare? In El Copey, no evidence exists of the diversion of public resources or crowding out of development spending under the nonparamilitary-mayor.Footnote 42 In contrast, in Astrea, resources were diverted away from public goods to fund illegal security forces. The two mayors' social-spending patterns diverged, with El Copey's nonsecurity public goods' expenditures surpassing Astrea's. However, more importantly, resources were diverted from social welfare to security in Astrea. For example, Astrea's hospital and healthcare funding was put at the paramilitaries' disposal for medical services for the self-defense groups.Footnote 43 Barrios Ortega ran the hospital before assuming the mayorship. Rather than serve the community, it instead provided medical attention and medicine to irregular soldiers.Footnote 44 At the same time, public contracts and mining royalties were shifted away from their intended destination of nonsecurity public goods enhancement to instead finance private security services.Footnote 45 Royalties for the exploitation of resources, in particular, intended to be used for basic public services, did “not ha[ve] the destination established by law” (United Nations Development Program, Colombia 2010, 52).Footnote 46
Qualitative evidence further suggests that Barrios Ortega emphasized security and relied on coercive allies to keep violence under an iron fist.Footnote 47 Both Astrea and El Copey fell within the strengthened 10th Armored Brigade's deployment range. However, whereas the nonparamilitary-mayors' key objectives in their municipal development plans did not include the word “security,” “security” appeared in the first item of the Fundamentals' section of the paramilitary-mayors' plans.Footnote 48 Astrea's, for example, promised to implement “a security program with the help of the police and the army in order to reduce the indices of insecurity in the municipality” and “consolidate equality, peace, and security.” To do so, Barrios Ortega relied not only on the armed forces, but also on the full repertoire of security enforcers at his disposal, including the self-defense forces.
In 2000, the paramilitaries entered Astrea with barbarism, executing eleven campesinos in the public plaza of Santa Cecilia.Footnote 49 With paramilitary-politicians in office, “the fighting ceased.”Footnote 50 Following the Colombian proverb, “Between firemen, we do not step on the hoses” (Guillén Reference Guillén2008), Mayor Barrios' pactFootnote 51 with paramilitary Numa Pompilio Cortez MendozaFootnote 52 established:
a form of social control … exercising “justice” … imposing specific standards of mandatory compliance for the entire population.… The imposition of rules determined the hours to be in the fields or in public spaces.… In Astrea, no one could be outside before six in the morning and after seven at night.Footnote 53
There was “continuous monitoring” and “institutional control of the population” with the complicity and cooperation of the public authorities. In this way, under paramilitary-mayor Barrios, crime and violence were kept to a minimum and there existed “[coerced] peace in the region.”Footnote 54 In El Copey, Mayor Ordonez Simanca not only placed less emphasis on security, but also had a narrower repertoire of actors and alliances with which to clamp down on insecurity and crime.
Conclusion
This article analyzes all Colombian mayoral elections from 1997 to 2015 that paramilitary- politicians barely won or lost, and shows that their close wins resulted in significant governance implications: reductions in insecurity and common crime but also in human capital. I propose that the pathway by which the violence-linked characters in office influenced government outcomes was through security alliances and diversion of resources from social investment to illicit security. Analyses of the mayors' spending patterns, security policies, paramilitary ties, corruption levels, Twitter feeds, and a comparative case study provide results consistent with this interpretation.
There are particularities to the case of paramilitary politics in Colombia. The paramilitaries were not just violent, but brutal and indiscriminate in their atrocities, and highly criminalized in their operations. The security provision of politicians with linkages to actors more restrained in their use of violence might assume different forms. The paramilitary-political phenomenon constituted an illegal system of alliances, rather than an open, legal process of reincorporation that might provide measures geared precisely at reducing the trade-offs implicit in including actors with violent linkages in democratic politics. Rebel movements, such as the FARC, have been shown to have engaged in similar takeovers of local political office and, despite espousing a left-wing ideology, similar diversion of public investment from social development to military operations and similar provision of local order. However, FARC politicians relied only on illicit linkages and lacked access to licit security providers until, in 2018, they openly entered the political arena (Eaton Reference Eaton2006). In other contexts, paramilitaries are instead a legal part of the official state apparatus (for example, the Italian Carabinieri) and may therefore enjoy the full coercive strength of the state apparatus but be limited in their ability to use all means necessary—including illicit ones—to control the criminal underworld. Pacts between government and militia belligerents are under-studied, often involve gray areas, and merit further scholarly attention, as do the implications of using such illicit security forces in democracies.
Despite these limitations, the study likely has empirical and theoretical generalizability beyond Colombia's paramilitary politics. It may inform debates raging in the literatures on democracy, war, peace, crime, and governance about whether and how to politically include potential spoilers of stability, particularly those with citizens' blood on their hands: whether to create pacts with them; whether to allow them to run for office; and whether to guarantee them political power. Critical to these debates is an understanding of what happens if the coercive politicians go on to win the elections (How will they rule?), and very often, they do win the elections (Daly Reference Daly2019; Loxton and Mainwaring Reference Loxton and Mainwaring2018). We have little leverage over this question of their rule because these politicians do not win randomly. By taking advantage of a rare opportunity, this article sheds light on this important debate. In support of arguments favoring the inclusion of candidates with violent linkages in office, my findings suggest that it has stabilizing effects. However, consistent with criticisms of this policy, I demonstrate that in gaining security, citizens forgo not only justice and human rights, but also public goods and social welfare. This likely undermines longer-term citizen safety and well-being.
From a theoretical perspective, security voting, violent pacts, and crowding out development spending are also not unique to Colombia. Actors with coercive linkages are seen as credible on security around the world, and transfers of butter to (licit and illicit) guns undermine welfare in many violent contexts. In India, violent criminals are elected because they signal that they will be hard on crime (Vaishnav Reference Vaishnav2017). Across 57 countries during 1970–2015, belligerent successor parties won at the ballot box because they were deemed the most competent providers of societal peace (Daly Reference Daly2021). At the same time, by prioritizing security over development, these politicians with coercive linkages tend to undermine their administrations. This suggests, on the one hand, that pernicious cycles may result, in which violence-tied politicians seek to show deliverables on the issue on which they have a comparative advantage and to endogenously raise the salience of security deliverables in voters' minds to enable their reelection. On the other hand, it indicates that their poor performance on other public goods should lead to a negative incumbency advantage over time. Future research should seek to follow the political accountability process and probe if and how citizens reward or sanction politicians with coercive linkages for their performance in office over the longer term.
The article also raises questions about what makes politicians deemed credible and competent on security issues and use of force. Should those with (para)military experience or ties to violent actors be good at solving the country's problems, including those related to national defense and law and order (Tomz, Weeks, and Yarhi-Milo Reference Tomz, Weeks and Yarhi-Milo2020)? Mano dura may work in the short run, but does it work in the long run. And are pacts with violent actors sustainable ways of bringing down violence? When these policies fail, do politicians with violent linkages lose their ownership over the security issue? Understanding the underpinnings of votes for politicians with coercive ties and inheritance is a topic worthy of continued, future inquiry.
Supplementary Material
Online appendices are available at: https://doi.org/10.1017/S0007123421000521
Data Availability Statement
Replication data for this article can be found in Harvard Dataverse at: https://doi.org/10.7910/DVN/K1A9U0
Acknowledgments
I thank Pablo Argote Tironi and Juan Diego Duque for exceptional research assistance. I also appreciate the research support of Pooja Patel, Lorena Perdomo Charris, Merlin Heidemanns, and Mariana Pulecio Díaz. I received productive feedback from participants at the Berkeley Comparative Politics Colloquium and annual meeting of the International Studies Association. I am particularly grateful to Juan Albarracín, Allison Carnegie, Alisha Holland, Gwyneth McClendon, Juan Morales, Natalia Garbiras, Tara Slough, Juan Vargas, Michael Weintraub, Leopoldo Fergusson, Pablo Querubín, and the anonymous reviewers for their valuable comments.
Financial Support
This work was supported by: a Carnegie Corporation of New York Andrew Carnegie Fellowship; a Minerva–United States Institute of Peace and Security Early Career Scholar Award; and a research grant from the Helen Kellogg Institute for International Studies at the University of Notre Dame. The statements made and views expressed are solely my responsibility.
Competing interests
None.
Ethical standards
The research was conducted in accordance with the human subjects protocols approved by the institutional review boards of the Massachusetts Institute of Technology, University of Notre Dame, and Columbia University.