The commonly accepted view amongst scholars is that in the Victorian and Edwardian eras family control of public companies resulted in British public companies performing poorly. It is alleged that they had amateurish and unsophisticated managers, and family owners were more interested in paying out a substantial proportion of company earnings as dividends rather than retaining funds to grow the business (Chandler Reference Chandler1990, p. 240; Wilson Reference Wilson1995, p. 154). Indeed, some scholars have even attributed Britain's relative economic decline in the twentieth century to the problems with family-controlled companies (Elbaum and Lazonick Reference Elbaum and Lazonick1984; Chandler Reference Chandler1990).
Leslie Hannah (Reference Hannah2007), James Foreman-Peck and Hannah (Reference Foreman-Peck and Hannah2012), and Graeme G. Acheson et al. (Reference Acheson2015) have challenged this conception or caricature of the U.K.'s corporate economy in the Victorian and Edwardian periods as being dominated by family-owned public firms. These studies find that, in many cases, ownership was divorced from control. However, this separation of ownership from control may have created an agency problem, in that the executives of these public companies mismanaged them, and did not run them in the interests of shareholders. Notably, the diffuse ownership structure of British Victorian and Edwardian railways has been highlighted as a contributing factor to their poor performance (Crafts, Mills, and Mulatu Reference Crafts, Mills and Mulatu2007; Crafts, Leunig, and Mulatu Reference Crafts, Leunig and Mulatu2008; Mitchell, Chambers, and Crafts Reference Mitchell, Chambers and Crafts2011).
We contribute to this debate by examining the relationship between ownership structure and different measures of firm performance, using hand-collected data for 345 Victorian public companies. This unique dataset enables us to test whether diffuse, or family, ownership affected firm performance.
The idea that ownership structure affects corporate performance has a long academic pedigree. For example, in their classic study, Adolf A. Berle and Gardiner C. Means (Reference Mitchell, Chambers and Crafts1932) argued that the separation of ownership from control created an incentive problem in that managers would not necessarily act in the best interests of owners.Footnote 1 Large blockholders, which we define as someone who owns 10 percent or more of the company, may help to reduce this managerial agency problem because they have the incentive and power to monitor managers (Shleifer and Vishny Reference Shleifer and Vishny1986, Reference Shleifer and Vishny1997). However, blockholders, in turn, may put their own interests ahead of those of minority shareholders (Chandler Reference Chandler1990, p. 292).
Conceptually, directors who are independent of large owners could protect minority shareholders from expropriation by blockholders. However, the perception of boards of directors in the Victorian era is somewhat mixed. A contemporary judge believed that independent directors assured minority shareholders (Kennedy Reference Kennedy1987, p. 126), whereas a contemporary legal writer saw independent directors as incompetent or pre-occupied (Chadwyck-Healey Reference Chadwyck-Healey1884) or ornamental rather than playing any useful economic function (Campbell and Turner Reference Campbell and Turner2011; Chandler Reference Chandler1990, p. 242).
Our findings imply that it is not ownership itself that mattered in Victorian Britain, but rather the interaction between ownership and control. Although broad ownership measures are unrelated to firm performance, the presence of large active family blockholders is associated with a better operating performance, as measured by a higher return on assets (ROA). A possible explanation for this is that large active family blockholders in Victorian Britain effectively reduced managerial expropriation by helping to mitigate agency costs. However, this does not translate into greater market values, as measured by Tobin's Q, possibly reflecting minority shareholders’ fears of blockholder expropriation.Footnote 2 By way of contrast, the presence of directors who were not blockholders has little effect on operating performance but is associated with relatively higher market values. This implies that independent directors in Victorian Britain may have provided credible commitments against family blockholder expropriation, but were less effective at reducing managerial expropriation.
This article also contributes to the literature on the evolution of the U.K. capital market by looking at control of public companies following the liberalisation of incorporation law in 1856.Footnote 3 To date, the extant literature has focused on the performance and growth of the equity market (Grossman Reference Grossman2002), the expansion of the investor franchise (Rutterford et al. Reference Rutterford, Green and Maltby2011), and the development of stock exchanges (Thomas Reference Thomas1973; Michie Reference Michie1999). We contribute to the understanding of how the U.K. capital market transformed from one where shareholders had direct and personal knowledge of a company's operation and management to one where shareholders did not have such personal knowledge. Additionally, this article augments studies that look at the ownership-performance nexus from an historical perspective. For example, Foreman-Peck and Hannah (Reference Foreman-Peck and Hannah2013) find that, for the largest U.K. companies in 1911, diffuse ownership did not operate against shareholders’ interests, suggesting that agency problems were somehow reduced.Footnote 4
Examining corporate ownership structure in the Victorian era is enlightening for contemporary economists because the period under examination was one where the investor protection environment was very weak by modern standards (Campbell and Turner Reference Campbell and Turner2011).Footnote 5 Since investor protection laws can affect ownership structure (La Porta et al. Reference La Porta1998; La Porta, Lopez-De-Silanes, and Shleifer Reference La, Florencio Lopez-De-Silanes and Shleifer1999), the Victorian period provides us with a natural experiment where we can observe the relationship between structure and performance in a laissez-faire company law regime.
BACKGROUND, HYPOTHESES, AND CONCEPTUAL ISSUES
The Liberalisation of Incorporation in the United Kingdom
Prior to the liberalisation of incorporation law in the middle of the nineteenth century, the right to incorporate in the United Kingdom was controlled by Parliament and the Crown. From 1844 onwards, there were a series of acts, which made incorporation, and limited liability, easier to obtain. The 1862 Companies Act saw a consolidation of existing pieces of legislation and was the capstone on the liberalisation process. The ownership and control of the companies that incorporated under the 1862 Act, and raised share capital from the market, are the focus of this study.
Manager-Owner Conflict
Many of the companies incorporated under the 1862 Companies Act had diffuse ownership (Acheson et al. Reference Acheson2015). Such a separation of ownership from control allows specialisation in share ownership (or residual risk-bearing) and in managerial control (Fama and Jensen Reference Fama and Jensen1983). With the liberalisation of U.K. incorporation law, this specialisation was available to every firm. However, this specialisation may give rise to an agency problem, in that managers pursue their own interests and do not act in the interests of shareholders (Berle and Means Reference Berle and Means1932; Jensen and Meckling Reference Jensen and Meckling1976). Examples of managerial inefficiency in the late Victorian era have been highlighted by a number of authors looking at the railway industry (Arnold and McCartney Reference Arnold and McCartney2005; Crafts, Leunig, and Mulatu Reference Crafts, Leunig and Mulatu2008; Mitchell, Chambers, and Crafts Reference Mitchell, Chambers and Crafts2011).Footnote 6 A possible solution to the managerial agency problem may be provided by monitors who have the incentive to collect information about the firm, and the power to influence managers.
In this study, we categorise the key monitors into three groups: large active family blockholders, large passive blockholders, and directors who are not blockholders. A blockholder is a shareholder controlling more than 10 percent of the company. We hypothesise that the presence of large active blockholders will reduce the conflict between managers and owners, and raise profitability as measured by ROA. These large active blockholders have the incentive and the power to reduce managerial agency costs and raise operating profits. They may run the firm on a day-to-day basis, or at least be closely involved in it, ensuring that all other managers and employees maximise their efforts, and minimise costs. On the other hand, large passive blockholders, with less involvement in the monitoring of managers will not have such an effect.
Directors who are not blockholders often have little impact on the manager-owner conflict. In dispersed-ownership companies, Eugene F. Fama and Michael C. Jensen (Reference Fama and Jensen1983) have argued that it is natural that the most influential members of the board will be internal managers as they have the most information about the firm, and they are also well placed to nominate outside directors. Alternatively, the directors may be independent of management, but they do not have the day-to-day involvement in the firm, which would be required to reduce the agency problem. Their real influence would be at a strategic level, on major issues that came before the board, not on everyday issues.
To summarise, we use ROA as our measure of operating performance to show how efficiently a company uses its assets to earn a profit. The greater the managerial expropriation, the lower the return on assets. If large active blockholders can reduce managerial expropriation, then, ceteris paribus, ROA will be higher. On the other hand, large passive blockholders and directors who are not blockholders should have had no impact on ROA.
Blockholder-Minority Shareholder Conflict
Although large active blockholders may be able to discipline managers, they may focus on their own interests and attempt to maximise these at the expense of minority shareholders (Shleifer and Vishny Reference Shleifer and Vishny1997). This introduces an additional risk factor that investors must consider in their valuations. If they are concerned about expropriation, then the high profitability earned in companies with large active blockholders may not necessarily translate into higher share prices. However, if investors feel protected from expropriation then they may reward the firm with a relatively higher valuation. The blockholder-minority shareholder conflict generally concerns strategic decisions, rather than day-to-day management, and would be typically dealt with at board level. Consequently, having an independent board could help promote good practice and increase shareholder value. Boards with more directors who are not blockholders could be viewed as a commitment that there is a low risk of blockholder expropriation, as collusion would be much more difficult. The result is that, ceteris paribus, valuations (as measured by Tobin's Q) should be higher.
There were numerous ways in which blockholders could put their own interests before those of minority shareholders First, the active blockholder could engage in tunnelling (or related party transactions),Footnote 7 by getting the company to lend money at low rates, or buy assets at inflated prices. These would typically affect only the balance sheet, rather than profitability, in the short term. Another form of tunnelling can occur when the blockholder gets the company to trade with other firms that he owns. The company is then charged inflated prices and the benefits are earned by the blockholder's other firms, at the expense of the minority shareholders. Even if this did not immediately occur but investors understood that it could occur in the future, it would mean that current profitability could remain high, but the share price would be discounted to reflect the additional risk. An example of this type of tunnelling was seen in the case of the Grosvenor Hotel; R. C. Drew was the largest shareholder and exercised control over a small board, who colluded with him to obtain most of the supplies for the hotel from a butcher, grocer, and laundry all owned by Drew.Footnote 8
Blockholders could also put themselves first by withholding information. As insiders, they had detailed knowledge about the performance of the firm, which they could use to inform their decisions on whether to buy or sell stock in it (insider trading). They could deny much of this information to others, placing the minority shareholders at a disadvantage. For example, The Financial Times remarked about the Globe Cotton Spinning, a company in our sample, that it paid a dividend by forwarding “a cheque to each shareholder for whatever amount may be due to him at a rate the Directors fix on … Apparently no accounts are circulated … No information is obtainable beyond the capital subscribed and a few office particulars.”Footnote 9 This secrecy would tend to raise the risk for minority shareholders, and lower valuations, despite the profitability of the company.
Active blockholders could also continue in their position within the company, even when it was no longer performing well. The removal of a large active blockholder, as managing director, would likely have been much more difficult than the removal of someone who was not a blockholder. The Financial Times reported on the Aylesbury Dairy implying that the severe difficulties it faced were related to the past decisions of its active blockholder, G.M. Allender, who it referred to as the “Life Managing Director.”Footnote 10 A similar problem could arise if the active blockholder used his power to appoint some of his family as his replacement. In a similar vein, if there was a risk that the blockholder would engage in empire-building, it could be detrimental to shareholder value. Foreman-Peck and Hannah (Reference Foreman-Peck and Hannah2015, p. 20) note the example of Samuel Waring who engaged in a disastrous expansion and acquisition plan with the furniture company Waring & Gillow. Finally, and most blatantly, the active blockholders could attempt to deceive the minority shareholders by falsifying financial statements, to attract capital.
The potential for these abuses by large active blockholders, even if they did not materialise, raised the risks faced by minority shareholders. We hypothesise that even though large active blockholders may raise profitability (ROA), they do not necessarily raise firm value (Tobin's Q). Large passive blockholders, who have no effect on profitability, should have no effect on value, because they do not exercise enough power to engage in expropriation. However, having a board with many directors who are not themselves blockholders will significantly increase the value of the firm, as collusion on expropriation would be much more difficult. If their focus is on major strategic decisions, rather than the minutiae of day-to-day decisions, such directors may have little influence on profitability, but they can provide safeguards against systematic expropriation.
Empirical Framework
We examine the relationship between the governance structure and performance of non-statutory public companies in Victorian and Edwardian England. Our estimating equation takes the form

We use ROA and Tobin's Q as performance measures, and the dependent variables, in our post-1880 performance sample. ROA is measured as:

and Tobin's Q is calculated as follows:

where MVEq = year-end market value of firm's common stock; Pref = year-end value of firm's preferred stock; Debt = year-end value of firm's total debt; and BV Assets = total assets of firm. Controls on age, size, location, growth, industry, ownership structure, and corporate control measures are described in the next section.
The main threat to validity that has been identified in studies of ownership structure is that of causality: does ownership structure affect performance or performance ownership structure (Cho Reference Cho1998; Demsetz and Villalonga Reference Demsetz and Villalonga2001). Harold Demsetz and Belén Villalonga (Reference Demsetz and Villalonga2001, p. 221) argue that “compensation plans, insider trading possibilities, and corporate takeovers suggest that firm performance may influence ownership structure as well as be influenced by it.”
However, there are several reasons to believe that reverse causality in a Demsetz and Villalonga world was not a major issue in the Victorian context. First even if some related-party transactions or tunnelling could be seen as affecting compensation, directors in our firms were paid said salaries and performance related bonuses, none of which resulted directly in changes of ownership, unlike modern equity-based plans. Second, hostile takeover bids and accumulation of stakes by potential acquirers were very rare in this era (Cheffins Reference Cheffins2008, p. 79; Hannah Reference Hannah1974, Reference Hannah1976, p. 150, Reference Hannah, Green, Owens, Maltby and Rutterford2011, p. 241). Third, Fabio Braggion and Lyndon Moore (Reference Mayer2013) find that while insider trading was not illegal, it rarely happened. Fourth, institutional investors were very small players and typically only invested in fixed-interest securities such as corporate and government bonds, not equities (Cheffins Reference Cheffins2008, p. 190; Raynes Reference Raynes1928).Footnote 11
Indeed, in the Victorian context, it was difficult for changes in ownership structure to occur quickly, as stock was often not as actively traded.Footnote 12 This meant that large one-off changes in ownership structure were not possible. We are not suggesting that blockholder changes were uncommon. However, it would have taken investors a long time to accumulate a block-holding stake in a company to fundamentally alter the ownership structure.
The absence of such mechanisms does not completely eliminate the reverse causality issue. One potential source of reverse causality is where a blockholder may be more likely to take a position on the board when companies are more profitable. In a robustness check, we find very little evidence of large passive blockholders rotating in or out of directorships, but we cannot conclusively rule this possibility out. However, it could be argued that blockholders might be more likely to take a seat on the board if profitability was low and the company was not performing well, in the hope of improving performance. A finding that active blockholders are associated with high profitability runs counter to what would be expected from results driven by endogeneity.
As an additional robustness check, we use a different measure of performance, which should be less prone to the reverse causality problem, namely firm outcome. It seems plausible that ownership structure could affect the final status of the company. However, it is unlikely that the future state of the company would affect current ownership. Firm outcome differs from our other measures of performance, ROA, and Tobin's Q, in that conceptually, we are measuring performance or success purely in terms of survival (Alchian Reference Alchian1950). We are posing the following two questions: (a) Was a specific type of ownership structure a survivable trait of firms over the long run? (b) Did a certain type of ownership structure make it more likely for a firm to fail for explicit performance reasons?Footnote 13
Although reverse causality should not be a major issue in this analysis, there may be unobserved factors that jointly cause performance and ownership structure. There may also be issues in terms of whether certain conditions led to different ownership configurations. For example, a firm founder who was likely to obtain high rents, and therefore high ROA, may keep a large block of shares to extract as much value as possible. The founder of a firm with high capital expenditures, and who needed to repeatedly raise more capital from minority shareholders, would be more likely to initially configure the firm with independent directors. For firms that were expected to be more successful, there may have been stronger demand for shares from subscribers, so that ownership became less concentrated. These issues mean that, ultimately, the most that we can say about any relationships we find is that they are correlations, and do not necessarily imply causality.
DATA
Sample
Our main sources of ownership data are the Companies Registration Office files held at the National Archives in London (BT31 series) and the National Archives of Scotland (BT2 series). Companies registered under the 1856 and the 1862 Companies Act were required annually to return a list of their ordinary and preference shareholders to the Registrar of Companies. Up until 1970, whenever a company was dissolved in the United Kingdom, its ownership records were placed within the Companies Registration Office files.Footnote 14
Because we are interested in the ownership of publicly-listed companies, we collected the names of all U.K. companies issuing common stock between 1862 and 1900 from the Course of the Exchange (COE) and the Investor's Monthly Manual (IMM). Unfortunately ownership returns were extensively weeded by archivists so that, for any one firm, only a small sample of years was preserved. We collected ownership returns for 1865, 1870, 1880–1884, 1890, and 1900 or one or two years either side of these sample years if the return existed. If a company had ownership returns that fell outside the selected sample years, we collected a return for each decade between 1860 and 1900, where available.
The ownership returns report the cash-flow rights of shareholders, but not the voting rights of shareholders or the names of directors. We therefore hand collected data on each company's voting rights for each year for which we had an ownership return from Burdett's Official Intelligence (BOI), Stock Exchange Official Intelligence (SEOI), or a company's articles of association, usually available with the ownership returns. The names of directors for the relevant years were obtained from the same sources. In order to ascertain the share ownership of each director, we manually checked each set of ownership returns.
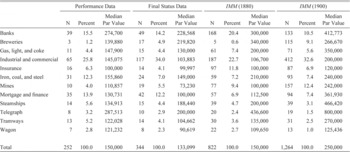
As noted previously, we use three performance measures. The accounting data to calculate Tobin's Q and ROA comes from Burdett's collection of company accounts stored in the Guildhall Library in London, while the market value of the firm's securities is obtained from the December issue of the relevant IMM.Footnote 15 As Burdett's accounting data is only available from 1880 onwards, our first sample is restricted to the post-1880 period and contains 252 firm-years, consisting of 186 unique firms, 11 with three observations, 44 with two observations, and 131 with one observation. Within our sample, 34.1 percent of firm years come from the 1880s, 40.5 percent from the 1890s, and 25.4 percent from 1900–1901. The four most represented industry sectors, as shown in Appendix Table 1, are industrial and commercial firms comprising 25.8 percent of our sample, banks comprising 15.5 percent, mortgage and finance companies comprising 13.9 percent, and iron, coal, and steel companies comprising 12.3. The remainder of the sample is spread across eight other industry sectors. We obtain survival/failure date from the Register of Defunct Companies, which lists any company delisted from the stock exchange from 1875 onwards with the reason for delisting.Footnote 16 We are able to trace the year of delisting as well as the ultimate fate of 344 companies.
SUMMARY STATISTICS

Notes:
Data is winsorised at the 1st and 99th percentiles.
Source:
See text.
Compared to the total population of publicly-quoted companies listed in BOI, our sample is a relatively small proportion. According to Essex-Crosby's data, there were 1,585 and 2,581 non-railway companies listed in 1885 and 1895, respectively (Jefferys Reference Jefferys1977, p. 458). In terms of the number of unique companies quoted in the COE and IMM between 1862 and 1901, we estimate that there were 2,664 companies excluding railways, quoted at some point during this period. In Appendix Table 1, we present a detailed breakdown of how our sample compares to non-railway companies listed in the IMM. The median par value of IMM firms in 1880 was £150,000 and in 1900 was £250,000. Our performance data sample firms have a median par value of £150,000, while our final status sample firms have a median par value of £133,099, implying that our sample is more weighted towards small- and medium-sized public companies. When compared to all of the non-railway companies in BOI, which included more of the small firms, our sample is fairly representative. The average paid-up capital of our companies for the ROA and Tobin's Q sample is £256,700, and for the final status sample is £216,560, which are similar to the average paid-up capital of non-railway companies in BOI in 1885 and 1895, which were £209,752 and £262,340, respectively (Jefferys Reference Jefferys1977, p. 458).
There were some substantial changes in industrial composition during this period, as seen from Appendix Table 1, but the only industry which seems to be under-represented in our sample in both 1880 and 1900 is mining. The commercial and industrial sector, which consisted mainly of manufacturing and processing companies, is the largest sector in our sample, which is unsurprising since this was a growth sector in the stock market (Grossman Reference Grossman2002, p. 130). In terms of those listed in BOI, our sample under-represents the commercial and industrial sector and over-represents banking. This is again unsurprising because banks were more likely than other companies to have a large shareholder base and have their shares traded on public markets, whereas industrial and commercial public companies were more likely to be small and not regularly traded.
Ownership Variables
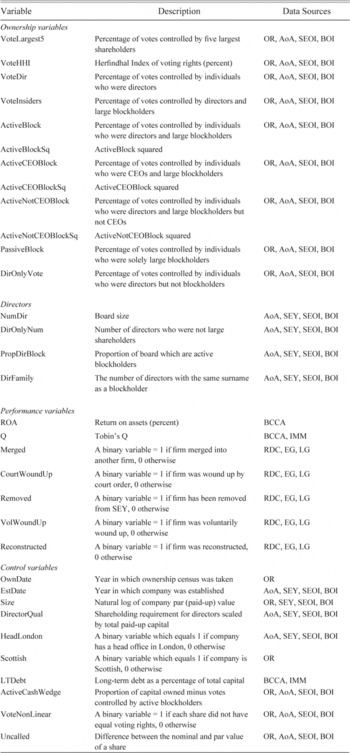
The richness of our data permits a wide variety of measures of ownership structure. Following Demsetz and Kenneth Lehn (Reference Demsetz and Lehn1985) and Demsetz and Villalonga (Reference Demsetz and Villalonga2001), we looks at the ownership of the five largest shareholders as this may proxy the ability of shareholders to control managers. We can also construct a Herfindahl Index of ownership. We describe ownership by the board of directors as a whole, and of insiders that embraces both directors and blockholders. We then split this insider category into three types of individuals. Large active blockholders (i.e., individuals who owned more than 10 percent of capital or voting rights and were on the board), large passive blockholders (i.e., individuals who owned more than 10 percent of capital or voting rights and were not on the board), and directors who were not blockholders. The variables are described in Appendix Table 2.
SUMMARY STATISTICS

Notes:
The propensity for a director to be a large blockholder is calculated as (ActiveBlockholder)/(Solely Director + ActiveBlockholder) and the propensity for a large blockholder to be a director calculated as (ActiveBlockholder)/(Passive Blockholder + Active Blockholder).
Source:
See text.
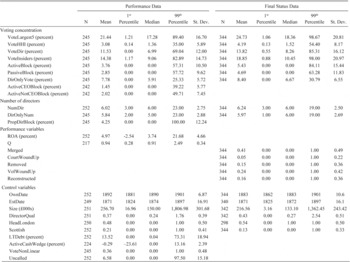
Summary statistics are presented in Table 1, VoteLargest5 and VoteHHI variables both indicate that corporate ownership was relatively diffuse in our sample. Notably, the average of the VoteLargest5 variable at 21.44 percent is very similar to the capital owned by the five largest shareholders in modern studies (e.g., Demsetz and Villalonga Reference Demsetz and Villalonga2001; Davies, Hillier, and McColgan Reference Davies, Hillier and McColgan2005; Maury Reference Maury2006). In our regression analysis, we take log values of VoteLargest5 and VoteHHI to obtain symmetric distributions. Directors, on average, control a fairly small proportion of voting rights in our sample, with the averages of VoteDir being 11.53 percent, not dissimilar to that reported by Foreman-Peck and Hannah (Reference Foreman-Peck and Hannah2012) for the 337 largest British firms in 1911. We also summarize the ownership of large active blockholders who were directors, the ownership of large passive blockholders who were not directors, the ownership of directors who were not blockholders, and the ownership of all insiders i.e., directors plus large blockholders. The mean and median of VoteInsiders, which measures the votes of both directors and large shareholders, are 14.38 and 9.06 percent, respectively. ActiveBlock and PassiveBlock averages imply that a minority of firms had someone who was a large blockholder. However, the mean votes controlled by those blockholders was 24.87 percent, and for those firms that had a passive blockholder, the mean votes controlled by those blockholders was 24.90 percent. The DirOnlyVote variables show that directors who were not large blockholders, on average, held a total of 7.78 percent of voting rights between them.
Although not reported separately, there is little difference between the concentration of capital and voting, and, if anything, voting is slightly less concentrated than capital. Many companies had voting regimes with caps limiting the total votes of each investor or which skewed the voting scale in favour of small investors and discriminated against large shareholders (Campbell and Turner Reference Campbell and Turner2011).Footnote 17
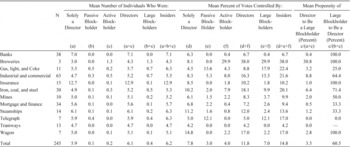
In Table 2 we describe how ownership by directors and large blockholders varies across industry. Four things are worthy of note. First, very few firms in any sectors had large blockholders. Second, there was a very small propensity for directors to be large blockholders, but a higher propensity (60.5 percent) for large blockholders to be directors, which implies that the majority of such shareholders wanted to maintain control over the company. Third, the vast majority of directors were not blockholders, with the average board having 6.1 directors and, on average, 5.9 of these were not large blockholders. Fourth, there is some variation across industries in terms of the percentage of voting rights controlled by large blockholders, with breweries, iron, coal, and steel companies, and industrial and commercial companies having higher blockholder ownership than other industries.Footnote 18
Performance Variables
As noted previously the main performance measures are ROA and Tobin's Q. In our regression analysis, we winsorize each of the variables at the 1st and 99th percentiles to deal with outliers and use industry-adjusted Tobin's Q and industry-adjusted ROA whereby Tobin's Q, and ROA are adjusted using industry averages as per the industrial sectors in Table 2.Footnote 19
Our robustness check on performance is firm status. The Register of Defunct Companies explains why firms delisted. We use this information to create variables about the ultimate fate or final status of our sample companies. We find that 41 percent of firms merged with other companies and disappeared as separate entities; 5 percent of firms were wound up by court orders; 15 percent of firms were removed from the stock exchange yearbook; 24 percent of firms were voluntarily wound up by their shareholders; 16 percent of firms were reconstructed (see Table 1).
In terms of ex ante optimality for shareholders, if a firm were to disappear, the worst outcome would have been a court order to wind up, followed by a voluntary winding up. In the former, larger losses would usually have been incurred by shareholders, whereas the losses may not have been as severe in the case of a voluntary winding up. Removal from the Stock Exchange Yearbook usually occurred because a firm had failed, which again suggests poor performance. The best outcome would be a merger. The extensive rationalisations and merger movements in many of the industries at the turn of the twentieth century (Sykes Reference Sykes1926; Supple Reference Supple1970, pp. 273–96; Hannah Reference Hannah1974, Reference Hannah1976) suggest that few mergers were for explicit performance reasons. Reconstruction of companies also does not necessarily imply performance issues with firms, and would lie between the best outcome (i.e., merger) and the worst outcomes (i.e., winding up or removal).Footnote 20
We include two variables to capture governance and control, Board size (NumDir) ranged from 3 to 23, with a mean and median of 6.0.Footnote 21 Independence is captured by the number of directors who are not also large blockholders (DirOnlyNum) and ranges from 2 to 23, with a mean of 5.8 and median of 5.0 (See Table 1).
We use the establishment year of the company to capture the maturity of the firm (EstDate). We control for cyclical variations in ROA and Tobin's Q by using dummies for the years in which the data was obtained, and capture a time effect (OwnDate) for the final status of the company. We control for firm size by including the natural logarithm of a firm's paid-up capital in our regressions (Size) and a leverage ratio (LTDebt).Footnote 22
Since directors in this era were usually required to own a certain number of shares, which was usually low relative to the capital of the firm (Campbell and Turner Reference Campbell and Turner2011), we include a director qualification variable (DirectorQual) because this may have affected the relationship between ownership and performance. The mean, median, and range suggest that director qualifications were not a high proportion of the firm's par (paid-up) capital. Indeed, on average, 29.3 percent of shareholders had enough shares to qualify as a director.
We also control for whether or not a firm had London headquarters because such firms may have had greater access to capital markets and oversight by professional investors (HeadLondon). As our data comes from two different archives, we control for any possible effect this might have on the relationship between ownership and performance by including a binary variable which takes the value of one if our firm was Scottish, zero otherwise. In our regressions where ownership is regressed on Tobin's Q, we also control for the ROA, allowing us to analyse the determinants of firm value after controlling for differences in operating performance.
THE RELATIONSHIP BETWEEN OWNERSHIP AND PERFORMANCE
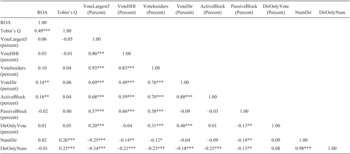
Table 3 contains pairwise correlations between our performance and ownership variables. Although there is a positive correlation between Q and ROA, they are not highly correlated, suggesting that they are measuring different aspects of firm performance. Second, ActiveBlock is positively correlated with ROA, implying having directors with more than 10 percent of the capital are associated with higher accounting profits. Third, there is a positive correlation between Tobin's Q and DirOnlyNum, implying that boards with more directors who are not also large blockholders are associated with a higher Tobin's Q.
PAIRWISE CORRELATIONS BETWEEN PERFORMANCE AND OWNERSHIP CONCENTRATION MEASURES

Notes:
*** p<0.01, ** p<0.05, * p<0.1. ROA and Q are industry adjusted and outliers have been winsorized at the 1 percent and 99 percent levels.
Source:
See text.
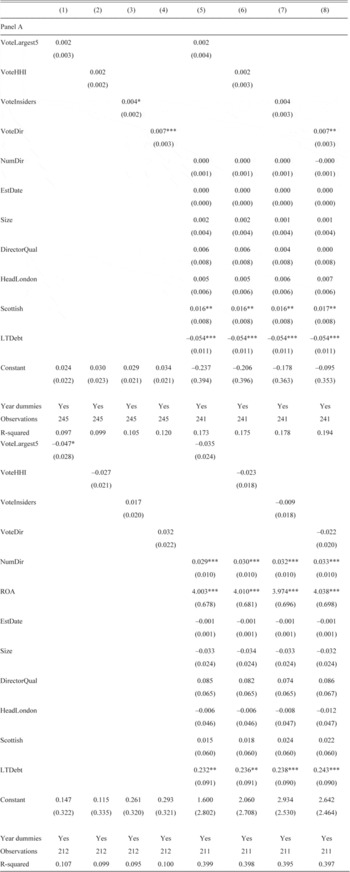
In Table 4, we show the results for various specifications of voting concentrations on ROA (panel A) and Tobin's Q (panel B). VoteLargest5 and VoteHHI, are uncorrelated with ROA implying that ownership structure, in a very broad sense, is unrelated to operating performance as measured by ROA. However, the positive coefficient on the VoteDir variable, which remains even when control variables are introduced, suggests that greater ownership in the hands of directors is associated with higher ROA. In panel B, we find a suggestion of a negative relationship between the broad ownership measures and Tobin's Q, but only one of the ownership measures is weakly significant.
DETERMINANTS OF RETURN ON ASSETS AND TOBIN’S Q

Notes:
In Panel A industry-adjusted ROA is the dependent variable and in Panel B industry-adjusted Tobins's Q is the dependent variable. *** p<0.01, ** p<0.05, * p<0.1. Robust standard errors are in parentheses.
Source:
See text.
The results also reveal that NumDir (board size) has little effect on ROA, but a highly significant positive effect on Q. One interpretation is that larger boards may have acted as a check on large blockholders expropriating minority shareholders, and was therefore valued by them. Overall these results imply a complex relationship between ownership by large shareholders, ownership by directors, and the number of directors.Footnote 23
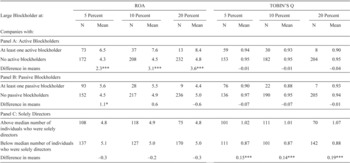
To analyse the interaction between these factors more precisely, each insider is categorised as either an active blockholder, a passive blockholder, or a director who was not a blockholder. We begin with a simple difference-in-means test between companies with and without each type of blockholder, and above and below median numbers of individuals who were solely directors (see Table 5). We classify a blockholder as having 10 percent of voting rights, but since our findings may be sensitive to this definition, we check the robustness of our results using 5 and 20 percent levels (see Holderness Reference Holderness2009, p. 1399). The ROA for companies with at least one active blockholder is statistically and economically greater than that for companies without, irrespective of what definition of large blockholder we use. In addition, Tobin's Q for companies with above median number of individuals who were solely directors is statistically greater than that for companies below the median for all three definitions.Footnote 24
DIFFERENCES IN PERFORMANCE WITH ALTERNATIVE CONCENTRATION MEASURES

Notes:
*** p<0.01, ** p<0.05, * p<0.1.
Source:
See text.
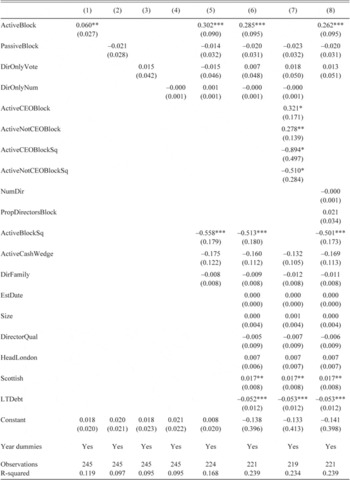
In Tables 6 and 7, we refine our analysis of the interaction between performance and governance. The most noteworthy finding in Table 6 is the positive and statistically significant coefficient on ActiveBlock, which implies that firms with blockholders who are also directors perform better in terms of ROA than other firms. The coefficient on ActiveBlock suggests that a 1 percent increase in the votes of active blockholders increases ROA by about 0.3 percent. This is consistent with the idea that such owners have the incentives and power to make sure than the firm is efficiently run to produce a high ROA.
DETERMINANTS OF RETURN ON ASSETS, DISTINGUISHING THE INTERACTION BETWEEN LARGE BLOCKHOLDERS AND DIRECTORS

Notes:
*** p<0.01, ** p<0.05, * p<0.1. Robust standard errors are in parentheses. Dependent variable is industry-adjusted ROA. All outliers have been winsorized at the 1 percent and 99 percent levels.
Source:
See text.
Previous research has indicated that the relationship between ownership and performance may be non-linear (Morck, Shleifer, and Vishny Reference Morck, Shleifer and Vishny1988; McConnell and Servaes, Reference McConnell and Servaes1990), so we include a squared term (ActiveBlockSq). The results indicate that ActiveBlockSq is significant and negative, indicating that active blockholder ownership is beneficial up to a point, but may become less useful at very high levels. Differentiating and solving suggests that the optimum level of active blockholder ownership is 27.1 percent. Because the difference between voting rights and cash-flow rights may be influential (Claessens et al. Reference Claessens, Djankov and Joseph2002; Gompers, Ishii, and Metrick Reference Gompers, Ishii and Metrick2010), we include the ActiveCashWedge variable, which calculates cash-flow rights minus voting rights for active blockholders. This is not significant. In robustness regressions, reported later, we find that using capital concentration does not change the results.
We go further, attempting to determine whether the active blockholders were fulfilling the role of the primary manager, essentially acting as a chief executive officer (CEO).Footnote 25 We assume that the Chairman fulfils the role of a modern CEO, unless another Managing Director (MD) is named in which case that person is seen as CEO. In our sample, we have 34 firm-years with active blockholders where either the Chairman and/or MD is named. Of these, in 18 firm-years the role of CEO was taken on by the active blockholder. These could be thought of as family firms, where the largest owner was also the manager. To investigate their impact on performance, we split our ActiveBlock variable into two parts, ActiveCEOBlock and ActiveNotCEOBlock, and re-run the regressions (see column 7 of Table 6). We find that both have a similar positive and significant impact on ROA.
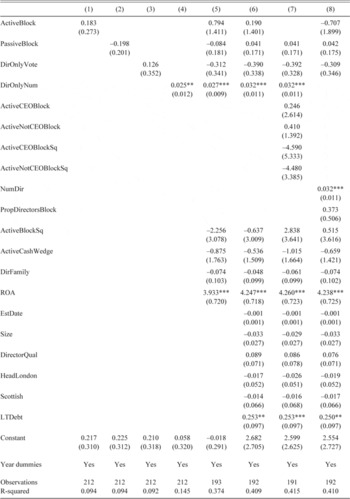
Despite the positive impact that active blockholders have on ROA, there appears to be an insignificant relationship between ActiveBlock and Tobin's Q, (Table 7), implying that minority shareholders do not value having a large blockholder who is also a director. The coefficient on the PassiveBlock variable suggests that large shareholders who do not take on a monitoring role have little effect on performance or firm value.
DETERMINANTS OF TOBIN'S Q, DISTINGUISHING THE INTERACTION BETWEEN LARGE BLOCKHOLDERS AND DIRECTORS

Notes:
*** p<0.01, ** p<0.05, * p<0.1. Robust standard errors are in parentheses. Dependent variable is industry-adjusted Q. ROA is the industry-adjusted ROA. All outliers have been winsorized at the 1 percent and 99 percent levels.
Source:
See text.
Having directors who are not blockholders (DirOnlyNum) has no effect on ROA, but it has a positive and significant effect on Tobin's Q, which implies that the number of directors who are not blockholders matters. The size of the coefficient implies that adding one more independent director increases Tobin's Q by about 0.03 (see Table 7). This would imply that a company which started with the average Tobin's Q of 0.94 could increase it to 0.97, meaning that firm value would rise by about 3.2 percent by adding another independent director. This finding is consistent with the view that an independent board may play a role in constraining large blockholders from expropriating small shareholders.
We also reformulate our DirOnlyNum variable into two parts, with variables for both the total number of directors (NumDir) and the proportion of the board that are active blockholders (PropDirBlock). This approach may suffer from a multi-collinearity problem as the correlation between ActiveBlock and PropDirectorsBlock is 0.857. The issue is similar if we use the proportion of directors who are not blockholders, just the direction of correlation is reversed. The results suggest again that having a greater number of directors is significantly and positively related to Tobin's Q (see column 8 of Table 7) which is consistent with the view that collusion is more difficult in larger groups. Having a larger board appears to make it more challenging to expropriate shareholders.
The ActiveCashWedge variable, which had no effect on ROA, does not have a significant impact on Tobin's Q. These results are interesting because they suggest that voting rights that limited the power of large shareholders might not have been important covariates of valuation. One potential explanation is that most company constitutions permitted voting at AGMs to be by a show of hands and the complicated voting weights would only be applied if specifically requested, which may have somewhat attenuated the power of voting schemes which limited the power of large shareholders. In addition, there was a rapid decline in AGM attendance in Victorian Britain (Jefferys Reference Jefferys1977, p. 396), which may have further blunted the power of voting schemes. The lack of influence of voting powers stands in contrast to the positive impact of independent directors. This is likely because it was the directors who were responsible for making almost all strategic decisions, with a vote at a company meeting usually only called to ratify what the directors had suggested.
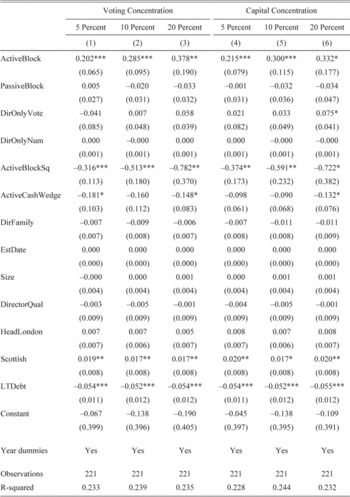
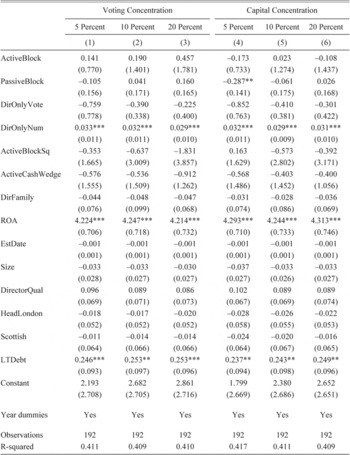
We carry out a series of robustness checks using alternative cut-off levels for a large blockholder. We consider cut-off points at the 5, 10, and 20 percent levels, using both voting concentration and capital concentration measures. In Table 8 where ROA is the dependent variable, there are positive and statistically significant coefficients on ActiveBlock. This confirms that large blockholders who are also directors have a positive effect on operating performance, and this finding is robust to alternative definitions of what constitutes a large blockholder. Table 9 reveals that the relationship between the DirOnlyNum variable and Tobin's Q is not affected by changing the definition.
ROA ROBUSTNESS TESTS – ALTERNATIVE DEFINITIONS OF LARGE BLOCKHOLDERS

Notes:
*** p<0.01, ** p<0.05, * p<0.1. Robust standard errors are in parentheses. Dependent variables are industry-adjusted ROA and Q. All outliers have been winsorized at the 1 percent and 99 percent levels.
Source:
See text.
TOBIN'S Q ROBUSTNESS TESTS—ALTERNATIVE DEFINITIONS OF LARGE BLOCKHOLDERS

Notes:
*** p<0.01, ** p<0.05, * p<0.1. Robust standard errors are in parentheses. Dependent variables are industry-adjusted ROA and Q.
Source:
See text.
As a further robustness check, we consider whether large passive blockholders in this study may have been rotating in and out of a directorship and therefore may have actually been active blockholders. To ensure this is not the case, we check all such blockholders for two years either side of each observation, using the Stock Exchange Yearbook and Directory of Directors, and find only three examples of a large passive blockholder being a director in this window. Where we have multiple observations, we also conducted analysis for those companies, which either gained or lost an active blockholder. We have three occasions where the company gains an active blockholder. The average increase in ROA is 7.9 percentage points. At the same time, Tobin's Q declines 0.18. We have five occasions where the company loses an active blockholder. The average decline in ROA is 4.2 percentage points, and an average increase in Tobin's Q of 0.10. These results are exactly in line with our hypotheses and our empirical results. However, given the small sample sizes, we do not want to put too much emphasis on these findings. Our results are also robust to the exclusion of banks and insurance companies.Footnote 26
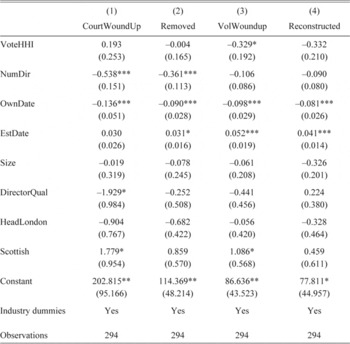
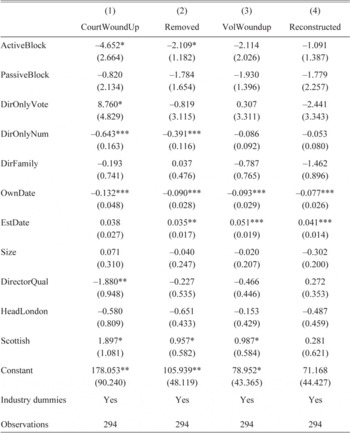
As noted earlier, we use the final status of the company as a dependent variable to carry out a further robustness check. We use multinomial logit regressions to examine how ownership affects the ultimate fate of the company. The results shown in Tables 10 and 11 reveal whether ownership structure made a company more or less likely to experience a particular outcome, relative to the base outcome, which we have chosen as merging with another firm.
The first thing to note from Table 10 is that there is little statistical or economic relationship between broad ownership structure, as measured by VoteHHI, and the final status of the company; only VolWoundUp is significant and only at the 10 percent level. Using different measures of ownership structure, give similar results and are not reported separately. The proportion held by insiders (VoteInsiders) is only significant against VolWoundUp, while the proportion held by the five largest shareholders (VoteLargest5), or by directors (VoteDir), are not significant predictors of any outcome. The negative coefficient on NumDir in specifications 1 and 2 suggests that the greater the number of directors a company had, the less likely they were to be wound up by a court, or to be removed from the stock exchange.
MULTINOMIAL LOGIT REGRESSIONS—FINAL STATUS OF THE COMPANY

Notes:
These are the results from a multinomial logit regression that has the final status or ultimate fate of the company as a dependent variable and where we have one observation per company rather than one observation per ownership sample. Companies that merged are taken as the base group. *** p<0.01, ** p<0.05, * p<0.1. Robust standard errors are in parentheses and the pseudo R-squared = 0.139.
Source:
See text.
In Table 11 we examine the interaction of final status and director/blockholder interactions. We find negative coefficients on the DirOnlyNum variable for those companies whose ultimate fate was to be wound up by a court or removed from the Stock Exchange Yearbook, implying that the greater the number of directors who were not large blockholders, the less likely that the company was to experience failure. In addition, the presence of large active blockholders is correlated with a lower probability of a company experiencing a negative ultimate outcome, although the coefficient on the ActiveBlock variable is only significant at the 10 percent level. This would again suggest, consistent with the previous results that the presence of a large active blockholder may have a positive influence on how the firm operates.
MULTINOMIAL LOGIT REGRESSIONS—FINAL STATUS OF THE COMPANY, DISTINGUISHING THE INTERACTION BETWEEN LARGE BLOCKHOLDERS AND DIRECTORS

Notes:
These are the results from a multinomial logit regression that has the final status or ultimate fate of the company as a dependent variable and where we have one observation per company rather than one observation per ownership sample. Companies that survived are taken as the base group. *** p<0.01, ** p<0.05, * p<0.1. Robust standard errors are in parentheses and the pseudo R-squared = 0.153.
Source:
See text.
We also conducted a survival analysis to examine if any of the governance variables had an impact on how long the company survived independently. However, none of the governance variables were significant, possibly because a large proportion of our sample companies ended by merging with another firm, or being acquired. This makes it difficult to interpret survival time, as companies that merged quite early did not necessarily have poor performance.
In summary, the results suggest that the presence of someone who is both a large shareholder and a director is associated with a higher ROA and less likelihood of experiencing a negative future state, but it does not result in a higher Tobin's Q. This implies that large active blockholders alleviate managerial agency problems and have a desire for survival in the long run, but their presence is not necessarily valued by other shareholders. The number of directors who are not large shareholders is positively correlated with a higher Tobin's Q and a lower probability of failure in the long run, which may imply that they were effective at preventing expropriation by large shareholders.
CONCLUSION
This article has addressed the debate of whether ownership structure mattered for firm performance in Victorian Britain. Our basic finding is that it was not the broad structure of corporate ownership that mattered for the performance of Victorian public companies, but whether a family blockholder had a governance role. Our results suggest that large family blockholders who were directors ensured that firms were well run and alleviated managerial agency problems. However, minority shareholders in Victorian Britain appear not to have placed a high value on such firms, possibly because of the potential threat of expropriation. Indeed, minority shareholders seemed to prefer boards dominated by independent directors and not by large shareholders. This implies that independent directors played a useful economic function in Victorian Britain and were not just ornamental.
Firms dominated by family blockholders were relatively uncommon before the 1890s, as many public companies launched on the stock market from scratch before that time. However, blockholders became much more common from the 1890s onwards as the newly-listed firms in this era were typically conversions of long-established firms, which had previously been partnerships (Acheson et al. Reference Acheson2015; Cheffins Reference Cheffins2008, p. 181). The implications of this change in the nature of stock-market flotation for British capital markets and economic development are something to be addressed in future research.
Appendix
COMPARISON OF SAMPLE DATA TO INVESTOR'S MONTHLY MANUAL DATA

VARIABLE DEFINITIONS AND SOURCES