I. INTRODUCTION
The microstrip transmission line is the basic component of microstrip technology. The microstrip line theory has been developed and may be found in standard references [Reference Hoffmann1, Reference Gupta, Garg and Bahl2]. The multiplicity of restrictions and the difficulty of representing the scattering parameters of passive devices by an analytical function reduced the choice to the black-box models. A black-box model describes any system (static or dynamic), and the problem is to find the model that suits.
Recently, several techniques have been developed for passive device modeling. Typical approaches for the realization of this crucial method for accurate and fast circuit simulation have included table-based models with various interpolation techniques, polynomial curve-fit techniques, and an electrical analysis tool such as electromagnetic (EM) simulation techniques [Reference Djordjevic, Harrington and Sarkar3]. Table look-up techniques have been used to reduce the CPU time of circuit simulation. These techniques are fast, but the table size grows exponentially with the addition of each variable and becomes the limiting factor in the modeling accuracy; hence, the memory requirements are large. Polynomial representations are generally capable of handling only mild nonlinearity with a few variables. However, EM simulation techniques, while very accurate, suffer from the large run-time memory requirements of simulation and are not practical for interactive computer aided design (CAD) environment and optimization techniques.
Several techniques based on fuzzy systems [Reference Miraftab and Mansour4], space mapping [Reference Koziel and Bandler5], and neural networks [Reference Harkouss, Ngoya, Rousset and Argollo6, Reference Zhang, Gupta and Devabhaktuni7] have been developed to model microwave devices and circuits, and have been found to be useful tools of the above described problems.
Fuzzy systems are expert systems, meaning they are modeled on the expert experience of real people. The important step in the construction procedure of a fuzzy system is to incorporate such experience in defining the rule-base. The rule-base is a set of fuzzy If–Then rules. The key components in a fuzzy system are fuzzy rules and fuzzy inference system(FIS). The choice of these elements critically affects the performance of fuzzy systems.
Space mapping assumes the existence of “fine” and “coarse” models. The “fine” model may be a high fidelity CPU-intensive EM simulator, undesirable for direct statistical analysis and design. The “coarse” model can be a simplified representation such as an equivalent circuit with empirical formulas. The standard space-mapping modeling methodology is based on setting up the surrogate model using a small amount of fine-model data. Extraction of the model parameters is performed over the whole set of these data. This methodology is simple and gives reasonable accuracy, which, however, may not be sufficient for some applications. To improve modeling performance, additional fine model information needs to be involved. Unfortunately, this approach to space mapping is not able to effectively harness a large amount of data, i.e., increasing the number of base points does not help if the number of space-mapping parameters (model flexibility) remains unchanged. Space-mapping modeling with variable weight coefficients is aimed at overcoming these limitations. It indeed provides much better accuracy than the standard method, however, at the expense of significant increase of the evaluation time, which is due to a separate parameter extraction required for each evaluation of the surrogate model. This limits potential applications of the method.
Neural approaches offer accurate neural models whose complexity is less sensitive to the input dimension. But these models offer significant drawbacks, which are:
1) The building process of the neural model is very time consuming, since the optimal number of hidden neurons is not known in advance and it must be determined by trial and error.
2) The learning process of the neural model is slow comparing to the learning technique used for the model proposed in this paper.
New modeling approaches that are accurate in nature and cost-effective, from both time and monetary point of view, are in demand.
This paper describes a new and accurate model for efficient CAD modeling of microwave devices. This model is inspired by both the FIS and artificial neural networks (ANNs) theory [Reference Jang8, Reference Jang, Sun and Mizutani9]. The adaptive neuro-fuzzy inference system (ANFIS) combines the benefits of ANNs and FISs in a single model. It can be trained with no need for the expert knowledge usually required for the standard fuzzy logic design. The ANFIS modeling technique is presented in Section II. Results with neuro-fuzzy modeling method for microstrip filter are listed in Section III. Section IV presents the results of the optimization process of microstrip filter using neuro-fuzzy model. Finally, conclusions are presented in Section V.
II. ADAPTIVE NEURAO-FUZZY INFERENCE SYSTEM
In this section, we describe ANFIS structural issues to better understand what neuro-fuzzy networks are and why they have the ability to represent microwave device behaviors.
A) ANFIS for microwave modeling
Component modeling is one of the most important areas of microwave CAD. The efficiency of CAD tools depends largely on speed and accuracy of the component models.
Let X be a vector containing physical/geometrical parameters of a microwave component. Let O be a vector containing the responses of the component under consideration (S-parameter). The physics/EM relationship between X and O can be represented as O = f(X). The theoretical model for f(X) may be computationally too expensive for online microwave design and repetitive optimization (3D full-wave EM analysis inside a Monte Carlo statistical design loop). The objective now is to develop a fast model that will accurately represent the original X–O relationship. Since neuro-fuzzy networks are efficient computational tools that can easily handle nonlinear and multidimensional problems, they become good candidates to replace the original EM models during microwave design. The ANFIS model for the component is given by: O ANFIS = f ANFIS(X, P) where P is the vector containing all the parameters representing the ANFIS model. The ANFIS approach is a new type of modeling approach where the ANFIS model can be developed by learning from accurate data of the microwave components. After training, the ANFIS model becomes a fast and accurate model representing the original component behaviors. ANFIS models can be used in circuit design and optimization.
B) ANFIS structure
ANFIS is a FIS implemented in the framework of an adaptive fuzzy neural network, and is a very powerful approach for building complex and nonlinear relationship between a set of input and output data [Reference Yildiz, Guney, Turkmen and Kaya10–Reference Gaoua, Ji Cheng, Mohammadi and Yagoub15]. It combines the explicit knowledge representation of FIS with the learning power of ANNs. ANFIS is a multilayer feedforward network which implements fuzzy decision rules and reveals its decision criterion.
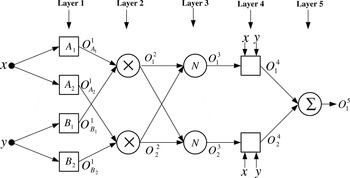
A typical architecture of ANFIS with two inputs and one output is shown in Fig. 1. It consists of five layers: fuzzy layer (layer 1), product layer (layer 2), normalized layer (layer 3), de-fuzzy layer (layer 4), and summation layer (layer 5).
Architecture of ANFIS.

In this paper, the rule base would contain many fuzzy if–then rules of Takagi and Sugeno's type [Reference Harkouss, Ngoya, Rousset and Argollo6]. A common rule set with two fuzzy if–then rules can be expressed as:

where A i and B i are labels of fuzzy sets, and p i, q i, and r i are the design parameters that are determined during the training process. As in Fig. 1, the ANFIS consists of five layers:
Layer 1: This layer implements fuzzy decision rules by means of membership functions (MFs):
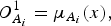

O A i1 (O B i1) specifies the degree to which the input x (y) satisfies the quantifier A i (B i) by means of MF μA i (x) (μB i (y)). In this work, the following generalized Gaussian MF is used:

where input = x or y and {c j, σj} are the parameter set that changes the shape of the jth MF of the input x or y. Parameters in this layer are named as the premise parameters.
Layer 2: Every node i in this layer calculates the firing strength of a rule via multiplication:

Layer 3: Each node i of this layer calculates the normalized firing strength:

Layer 4: Every node i in this layer is an adaptive node:

Parameters in this layer are referred to as the consequent parameters.
Layer 5: The single node in this layer computes the overall output as the summation of all incoming signals:

The output O 15 is a real number. It is evident that this formula is much easier to compute than numerically solving theoretical EM or physics equations. This is the reason why ANFIS models are much faster than numerical models of microwave devices. The hybrid learning (HL) algorithm [Reference Jang8] combining the least square method (LSM) and backpropagation (BP) algorithm is used to fast train and adapt the ANFIS. This algorithm converges much faster since it reduces the dimension of the search space of the BP algorithm. During the learning process, premise parameters in layer 1 and consequent parameters in layer 4 are tuned until the desired response of FIS is achieved. The HL algorithm has a two-step process. First, while holding the premise parameters fixed, the functional signals are propagated forward to layer 4, where the consequent parameters are identified by the LSM. Then, the consequent parameters are held fixed while the error signals, the derivative of the error measure with respect to each node output, are propagated from the output end to the input end, and the premise parameters are updated by the standard BP algorithm.
III. MODELING OF MICROSTRIP BANDPASS EDGE-COUPLED FILTER
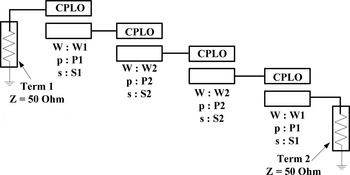
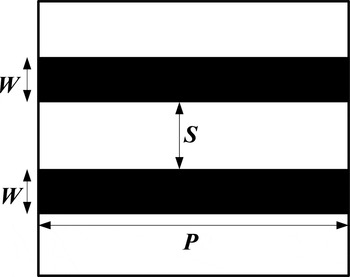
The ANFIS approach described in the previous section is applied to accurately model the scattering parameters of the edge-coupled 2.4 GHz microstrip filter. The schematic of this filter is shown in Fig. 2. The filter uses four CPLO (coupled parallel lines with open ends) elements to form the two-port filter circuit. Figure 3 shows the coupled microstrip lines structure. Because the filter is symmetrical, its inner and outer CPLO pairs take identical microstrip line width (W), spacing between the coupling lines (S) and coupling length (P) values. W, S, and P for the outer pair of CPLOs are parameterized as W1, S1, and P1; for the inner pair, as W2, S2, and P2. The responses of each passive device used in the circuit simulation consisted of the complex value of S ij scattering parameters at the specified frequencies.
Structure of edge-coupled microstrip filter.

Structure of coupled microstrip lines.

A) Neuro-fuzzy CPLO model
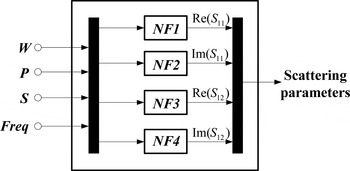
Each passive element of the filter shown in Fig. 2 is modeled by a black box for which S ij scattering parameters are evaluated through four neuro-fuzzy networks for each CPLO (S 11 = S 22 and S 12 = S 21). The input vector for each S ij neuro-fuzzy network consists of four parameters: conductor width W, conductor length P, spacing S, and frequency Freq. The output vector of the block containing the four neuro-fuzzy networks, as shown in Fig. 4, consists of scattering parameters (S-parameters): Re(S 11), Im(S 11), Re(S 12), and Im(S 12).
Global neuro-fuzzy CPLO model.

B) Training and test data sets
The S-parameters used to train and test each neuro-fuzzy network are obtained through repeated off-line simulation, using an accurate simulation technique such as the EM simulations technique. The training data set (or the test data set) can also be obtained as a collection of data from actual measurements. The strength of the neuro-fuzzy approach is that only a minimum number of EM simulations of passive devices are required to capture critical input–output relationships (S-parameters), and the neuro-fuzzy networks, once constructed, operate in an interactive CAD application with a computation time that is negligible compared to the EM simulation techniques. A neuro-fuzzy network that is designed to generalize well will produce a correct input–output mapping, even when the input is slightly different from the examples used in the training set. We give here the training and test data sets used, and the results obtained for the CPLO.
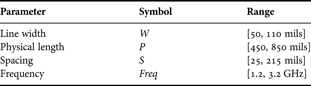
In this case, 6375 examples (5 × 5 × 5 × 51), that we refer to as the training data, are used for training neuro-fuzzy networks whose input vector is X = (W, P, S, Freq)T (training example = (X, d) where d is the desired output of the neuro-fuzzy network). The obtained networks are tested on another set of simulation data that we refer to as the test data set. This test set consisted of 918 examples (2 × 3 × 3 × 51). Training and test data sets are generated using Serenade SV simulator [16]. Testing identified neuro-fuzzy networks on a set of ‘fresh’ data is called validation process. It is a commonly used method for evaluating the performance of identified neuro-fuzzy networks. Table 1 lists the input parameters and their ranges used to generate the training and test data sets.
Input parameters ranges.

C) Building process of neuro-fuzzy networks
The overall model architecture of each CPLO is composed of four ANFISs (Fig. 4). All the FIS structures generated are based on the grid partitioning method. Each of the neuro-fuzzy networks uses Gaussian-type input MFs and a linear-type output MF.
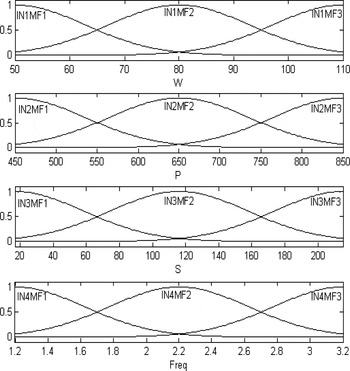
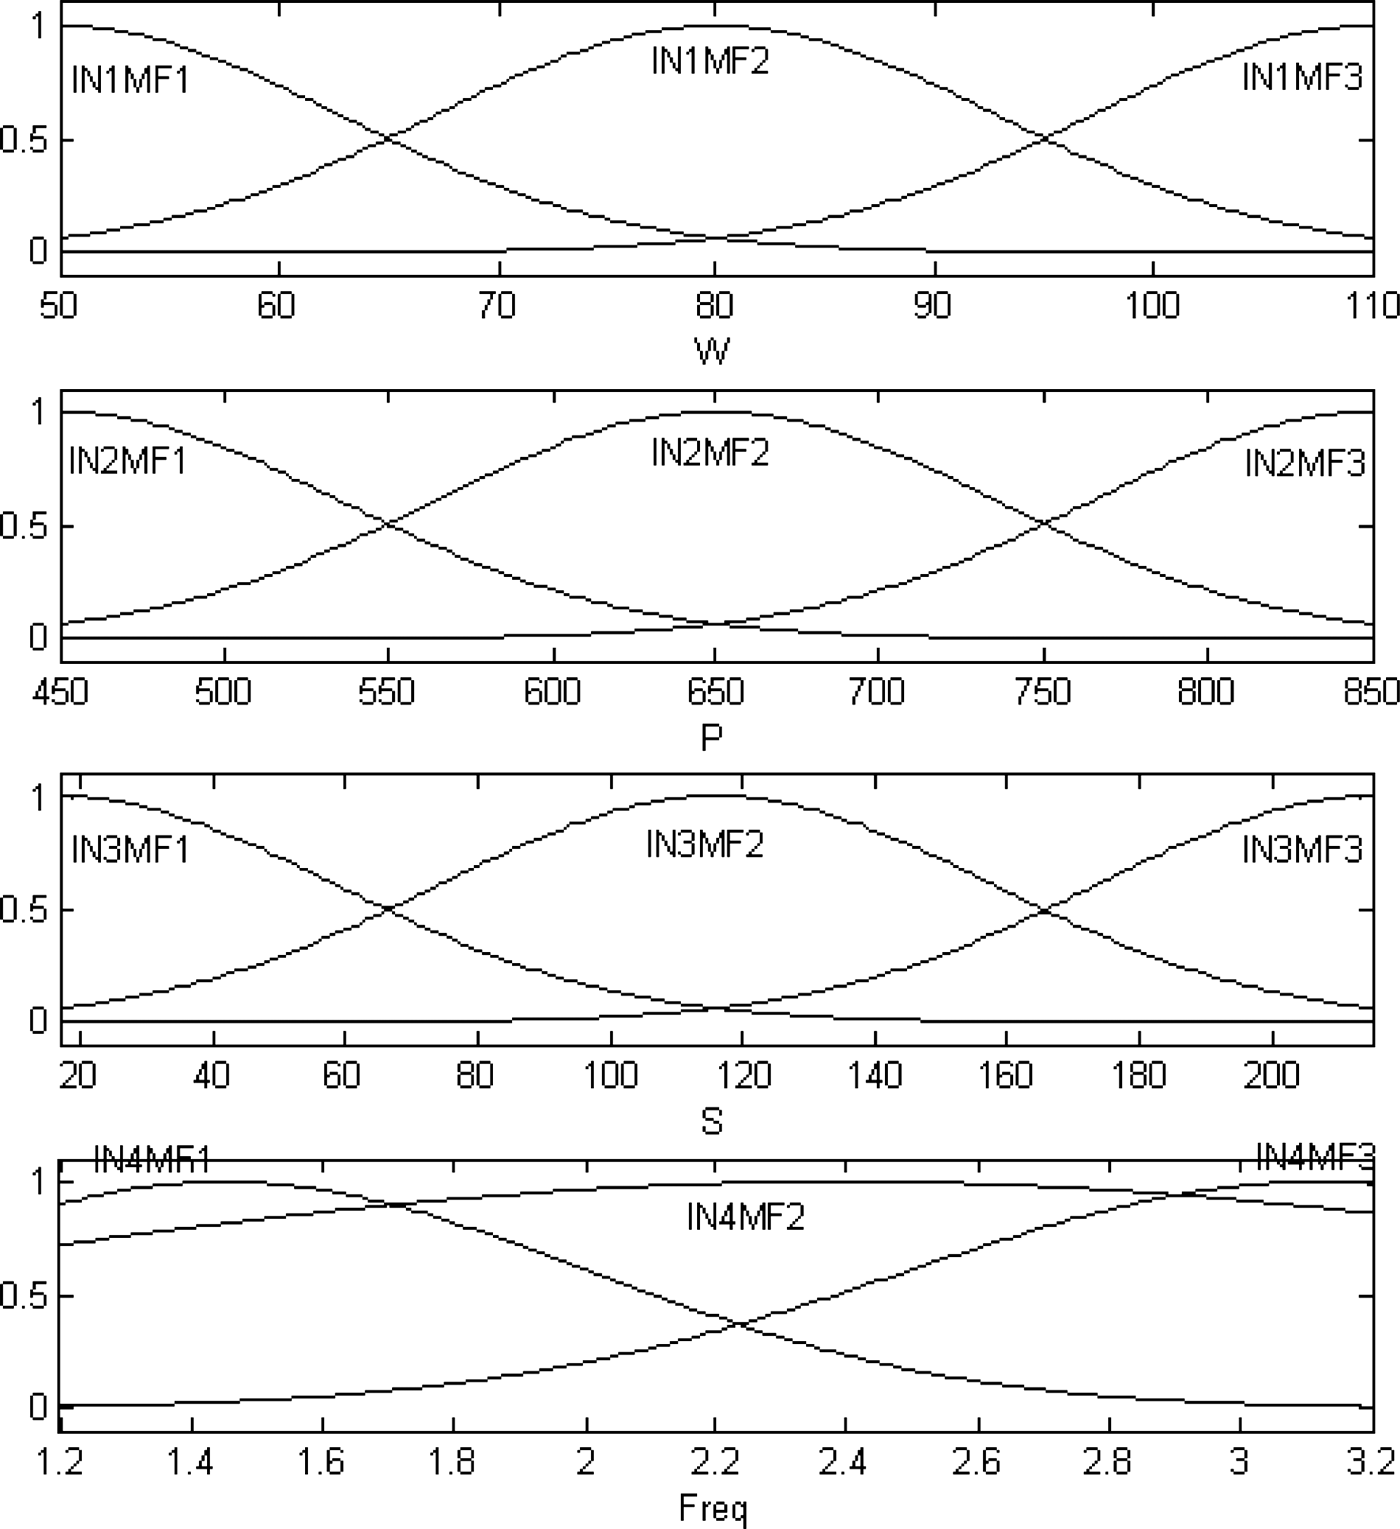
To start the training, we need a FIS structure that specifies the structure and initial parameters of the FIS for learning. Figure 5 shows the initial MFs of the Re(S 11) ANFIS. INiMFj denotes the jth (j= 1, 2, 3) MF of the input i (i= 1, 2, 3, 4) of the Re(S 11) ANFIS. The number of if–then rules is then 81 (3 × 3 × 3 × 3) as in the following equations:
Initial MFS of the Re(S 11) ANFIS.

Rule 1: if (W is IN1MF1 and P is IN2MF1 and S is IN3MF1 and Freq is IN4MF1), then

Rule 2: if (W is IN1MF1 and P is IN2MF1 and S is IN3MF1 and Freq is IN4MF2), then

Rule 3: if (W is IN1MF1 and P is IN2MF1 and S is IN3MF1 and Freq is IN4MF3), then

Rule 4: if (W is IN1MF1 and P is IN2MF1 and S is IN3MF2 and Freq is IN4MF1), then


Rule 81: if (W is IN1MF3 and P is IN2MF3 and S is IN3MF3 and Freq is IN4MF3), then

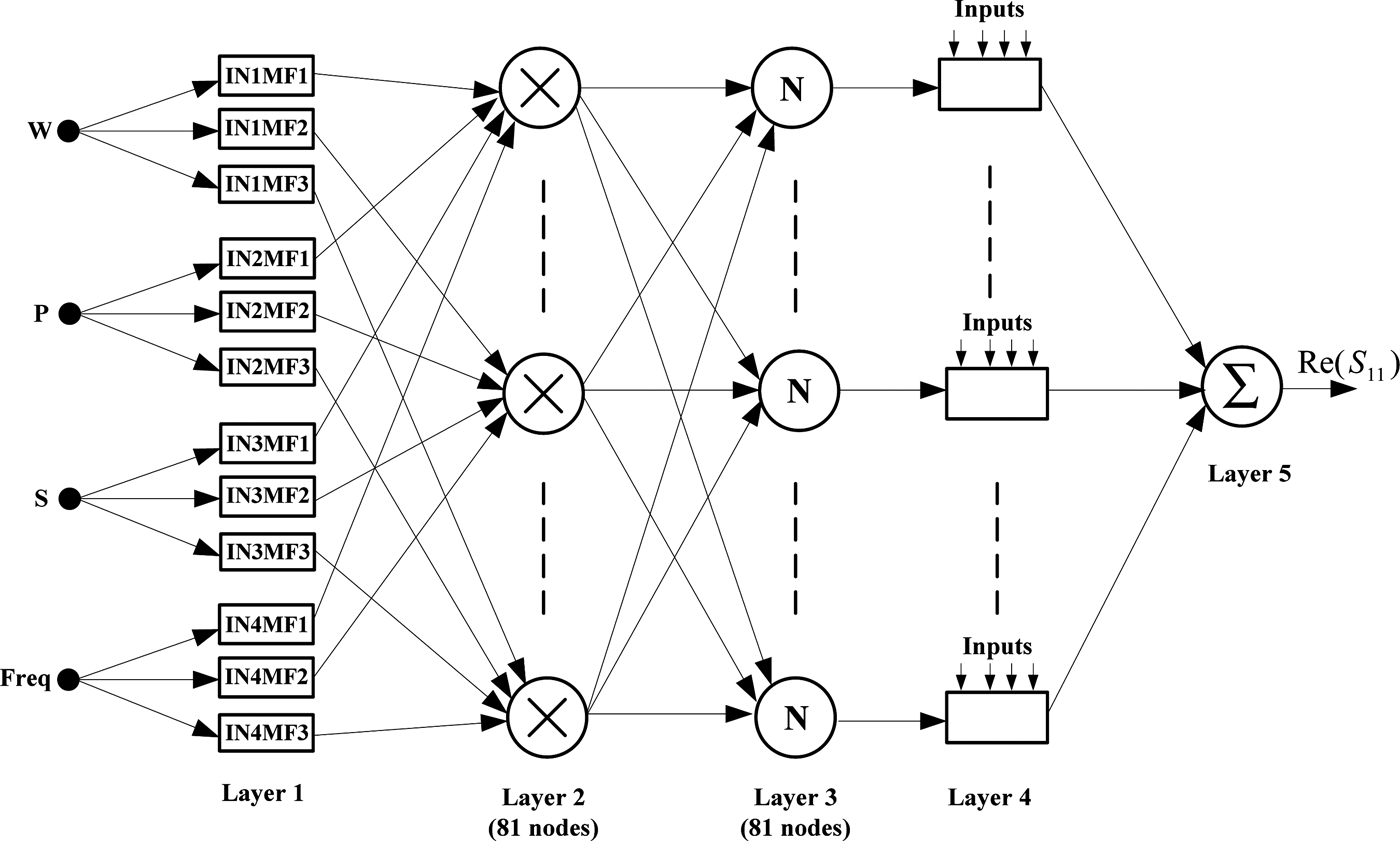
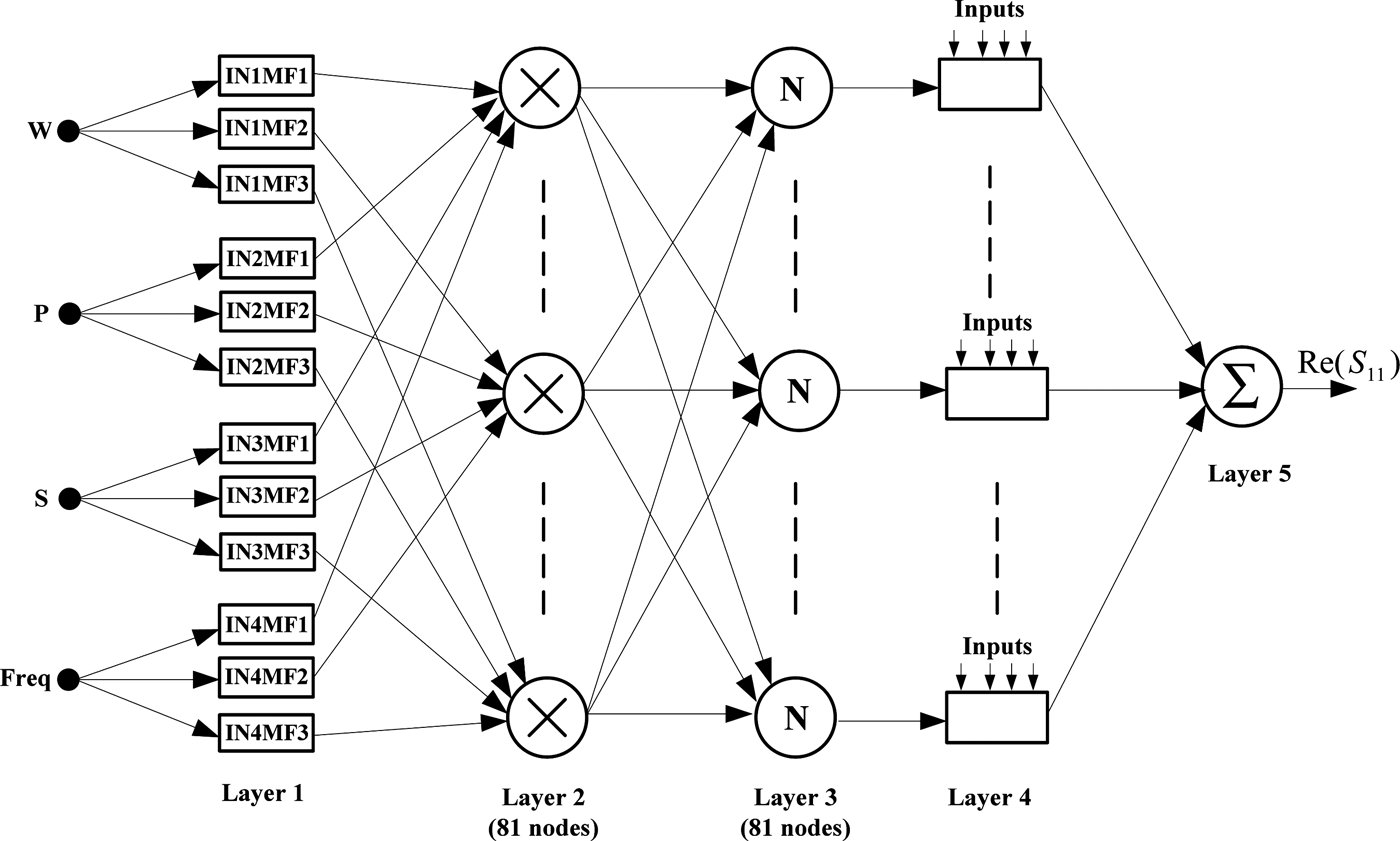
Therefore, ANFIS models used here contain a total of 429 fitting parameters, of which 24 (3 × 2 + 3 × 2 + 3 × 2 + 3 × 2 = 24) are the premise parameters and 405 (81 × 5 = 405) are the consequent parameters. Figure 6 shows the structure of the Re(S 11) ANFIS model.
Re(S 11) ANFIS model structure.
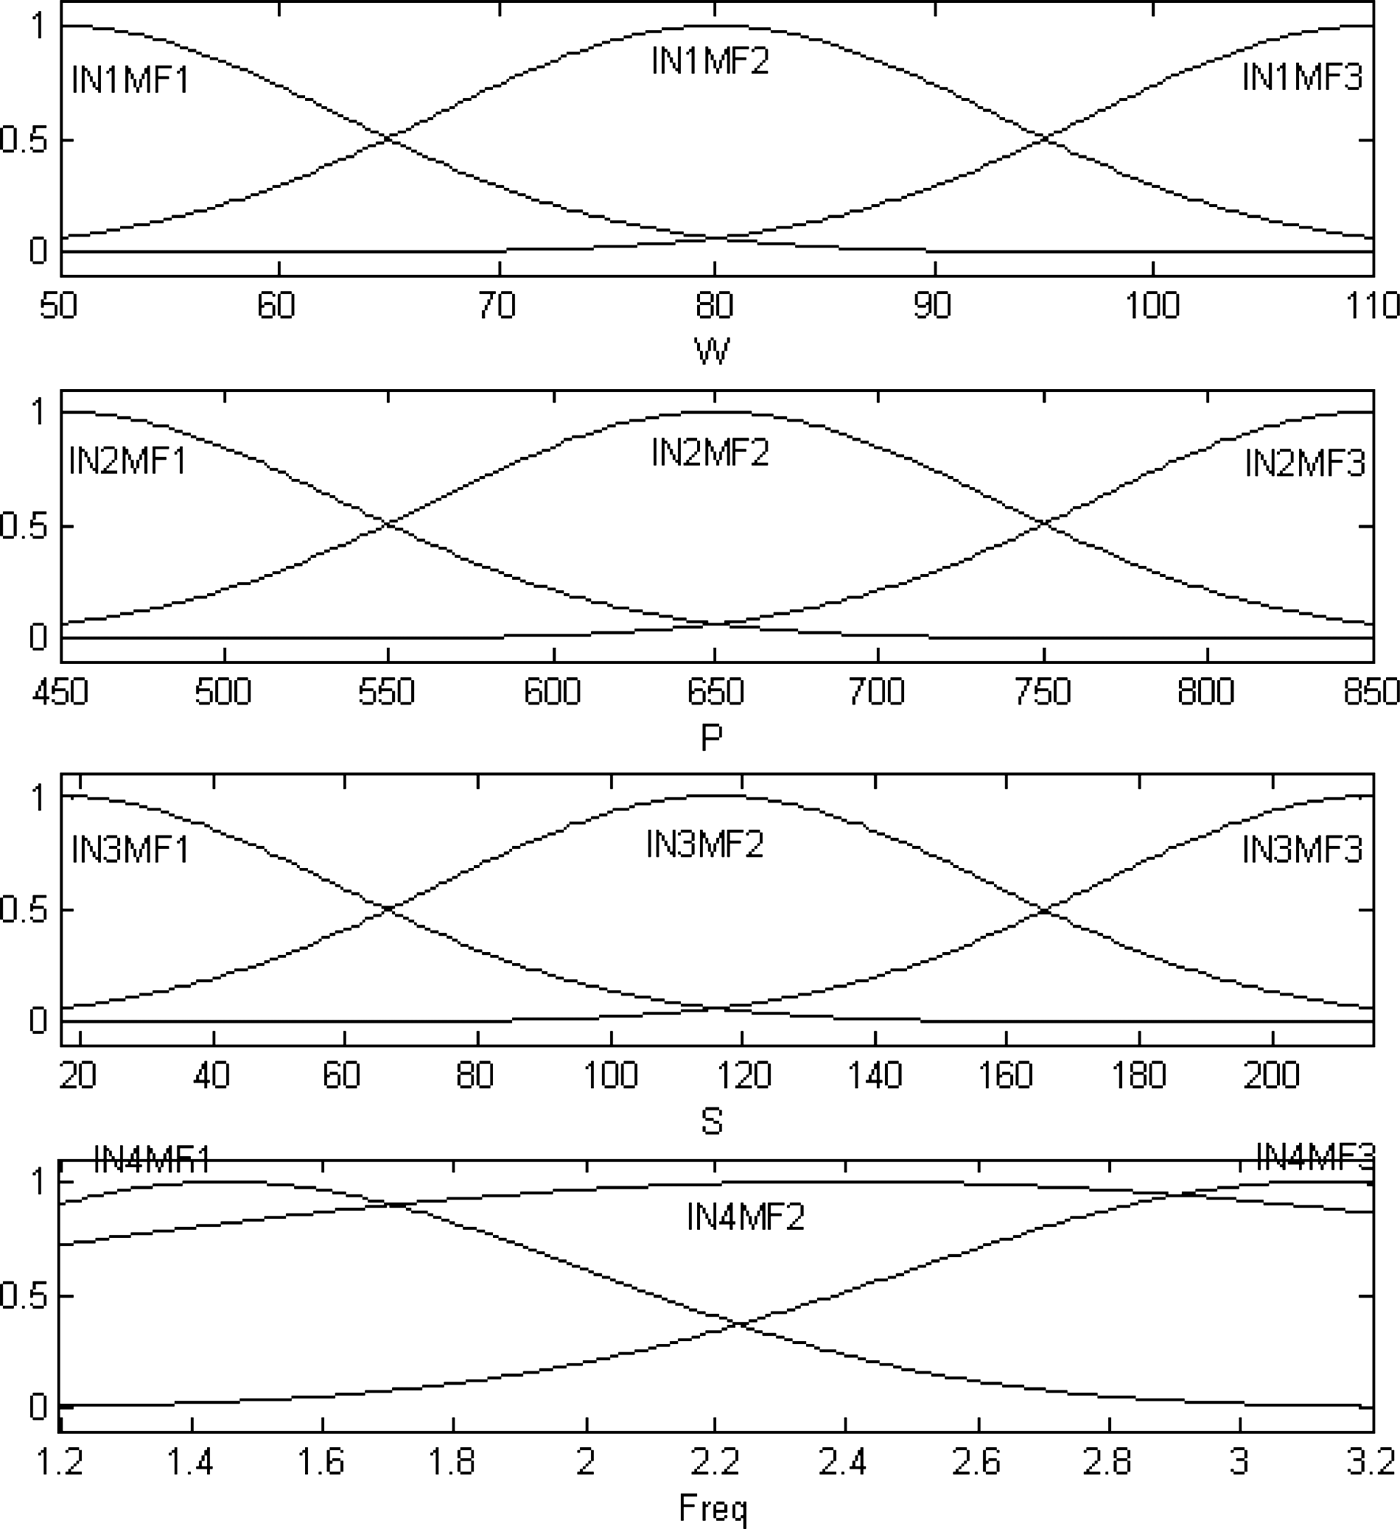
The HL algorithm combining the LSM and the BP algorithm is used to train and adapt the ANFIS. During the training process, the premise parameters and the consequent parameters are tuned until the desired response of the FIS is achieved. Figure 7 shows the final MFs of the Re(S 11) ANFIS (NF1) used in the global neuro-fuzzy model of CPLO.
Final MFs of the Re(S 11) ANFIS.
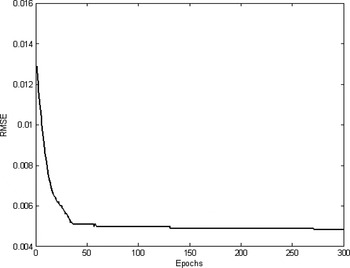
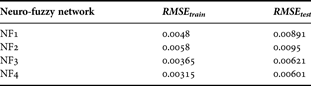
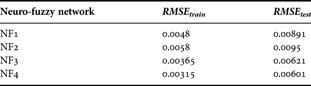
In Fig. 8, the root mean squared error RMSE of this neuro-fuzzy network is plotted as a function of the number of epochs. At each epoch, the RMSE is calculated by  , where N is the number of examples in the data set (N = 6375 for the training data set and N = 915 for the test data set), d i is the ith desired output of the neuro-fuzzy network, and σi is the ith neuro-fuzzy network output. Table 2 shows the results obtained for the CPLO after the learning and test procedures. In this table we list the RMSE of all the networks of the CPLO on the training data set (RMSE train) as well as on the test data set (RMSE test).
RMSE as a function of the number of epochs.

RMSE of different ANFIS models.
D) Results
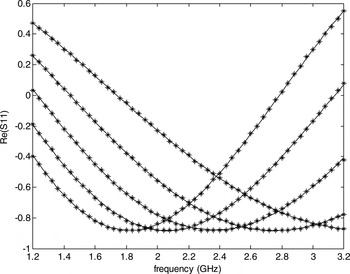
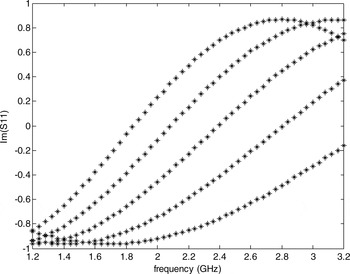
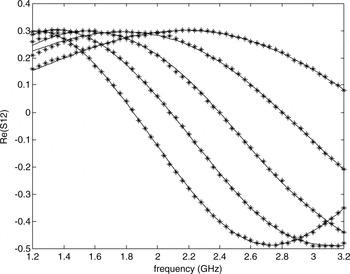
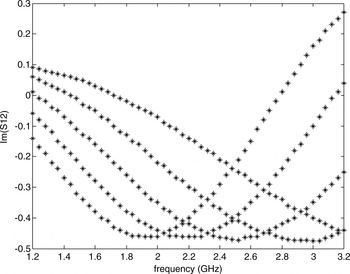
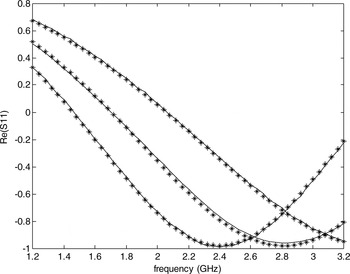
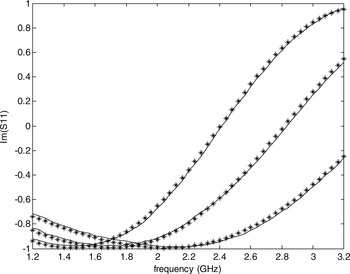
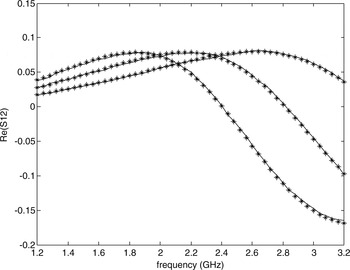
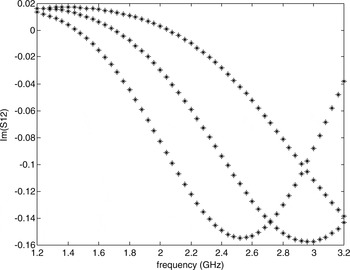
Figures 9–12 show scatter plots of EM-simulated and ANFIS computed values from the training data set for the S 11 and S 12 scattering parameters of the CPLO. Figures 13–16 show the results obtained with the test data set that indicate the ability of the ANFIS model to generalize and to predict the output network for inputs never used in the training data set. The results of the ANFIS model are compared with the results of serenade simulator.
Scattering parameters (Re(S 11)) of the CPLO (EM versus ANFIS) for W = 95 mils, S = 25 mils, and all values of P (*: Serenade; –: ANFIS).

Scattering parameters (Im(S11)) of the CPLO (EM versus ANFIS) for W = 95 mils, S = 25 mils, and all values of P (*: Serenade; –: ANFIS).

Scattering parameters (Re(S12)) of the CPLO (EM versus ANFIS) for W = 95 mils, S = 25 mils, and all values of P (*: Serenade; –: ANFIS).

Scattering parameters (lm (S 12)) of the CPLO (EM versus ANFIS) for W = 95 mils, S = 25 mils, and all values of P (*: Serenade; –: ANFIS).

Obtained results (Re (S 11)) with CPLO test data (EM versus ANFIS) for W = 60 mils, S = 130 mils, and P = {460 mils, 560 mils, 660 mils} (*: Serenade; –: ANFIS).

Obtained results (lm (S 11)) with CPLO test data (EM versus ANFIS) for W = 60 mils, S = 130 mils, and P = {460 mils, 560 mils, 660 mils} (*: Serenade; –: ANFIS).

Obtained results (Re (S 12)) with CPLO test data (EM versus ANFIS) for W = 60 mils, S = 130 mils, and P = {460 mils, 560 mils, 660 mils} (*: Serenade; –: ANFIS).

Obtained results (lm (S 12)) with CPLO test data (EM versus ANFIS) for W = 60 mils, S = 130 mils, and P = {460 mils, 560 mils, 660 mils} (*: Serenade; –: ANFIS).

The neuro-fuzzy models of the CPLOs are used to simulate the edge-coupled microstrip filter shown in Fig. 2. The calculation of the S-parameters of the microstrip filter is done using the scattering transfer parameters (T-parameters) of this filter. If the T-parameter matrix of the first CPLO is [T 1] and the T-parameter matrix of the second CPLO is [T 2], then the T-parameter matrix of the microstrip filter is given by

The following equations will provide conversion between S and T parameters for two-ports networks. From S to T:

From T to S:

The results obtained (Fig. 17) by the ANFIS models totally agree with the EM-simulated values. These results are a further indication of the ANFIS's capability to capture the complex nonlinear microstrip passive devices' responses.
Compared results obtained with the microstrip filter for W 1 = 58.53 mils, S 1 = 37 mils, P 1 = 671.82 mils, W 2 = 95.44 mils, S 1 = 200 mils, and P 2 = 657.32 mils (*: Serenade, –: ANFIS).

IV. OPTIMIZATION OF MICROSTRIP BANDPASS EDGE-COUPLED FILTER
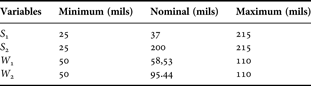
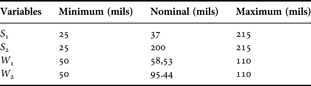
In this section, the ANFIS approach is applied to the optimization design of microstrip filter. The Serenade's optimizer is used. The optimizable parameters are S 1, S 2, W 1, and W 2. We have constrained the optimizable parameters by stating their minimum, nominal (starting) and maximum values (Table 3). The values of P 1 and P 2 are: P 1 = 671.82 mils and P 2 = 657.32 mils.
Specifications of S 1, S 2, W 1, and W 2.
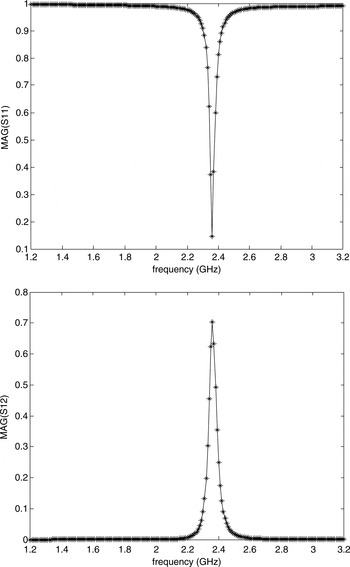
For this filter we defined three optimization goals: a frequency range ([2.25–2.45 GHz]) across which we want the filter to exhibit a gain of greater than −1 dB (MAG (S 12) > −1 dB), and two frequency ranges ([1.2–2.17 GHz and [2.53–3.2 GHz]) across which we want the filter to exhibit a gain of less than −9 dB (MAG (S 12) < −9 dB). Serenade's optimizer will attempt to adjust S 1, S 2, W 1, and W 2 to meet these goals. Based on the optimization method (i.e. gradient search method), we adjust continuously the input of the ANFIS models, and then the optimized microstrip line can be acquired as follows:

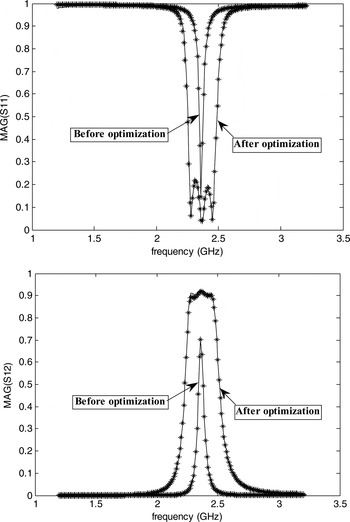
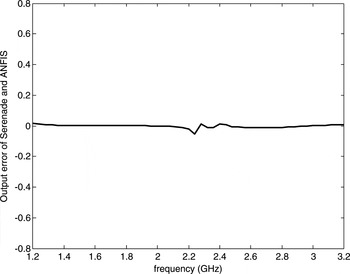
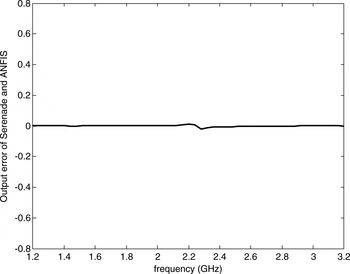
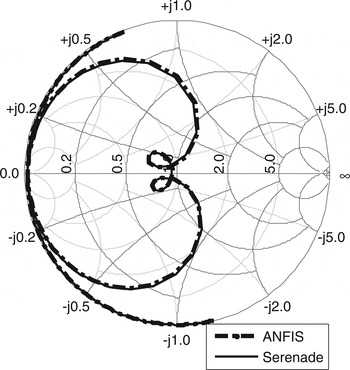
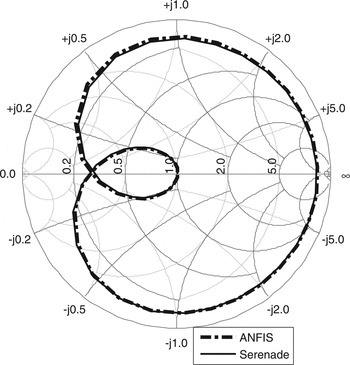
The results of the optimized bandpass filter MAG (S 12) and MAG (S 11) using ANFIS and Serenade are shown in Fig. 18. The error curves of the ANFIS and Serenade are shown in Figs 19 and 20 respectively. From these figures we can know the good agreement between the ANFIS and Serenade optimization result. The Smith chart of filters S 11 and S 12 are shown in Figs 21 and 22.
Optimized gain and input match for the microstrip edge-coupled filter (*: Serenade; –: ANFIS).

The error curve of edge-coupled filter MAG (S 11) between Serenade and ANFIS after optimization.

The error curve of edge-coupled filter MAG (S 12) between Serenade and ANFIS after optimization.

Smith chart of the edge-coupled filter S 11.

Smith chart of the edge-coupled filter S 12.

As mentioned above, the major advantages of using an ANFIS model for the filter design optimization is a vast reduction in required CPU time. The Serenade simulator (EM model) has used about 8 s on a PC (2 GHz CPU and 1 GB RAM ) to perform the design optimization of the filter, but the ANFIS model has only required 0.602 s to perform the same task on the same computer. The number of iterations used in the optimization process is 10. The comparison clearly shows that the proposed method is significantly faster than the EM method, enabling fast design and optimization. On the other hand, the simulation of the microstrip filter required approximately 4 MB of memory to run in the Serenade simulator. With the ANFIS models, the memory size required for the filter simulation is approximately 0.23 MB. These results show that the ANFIS model will be very efficient for the circuit optimization if the circuit under study contains large number of microwave components.
V. CONCLUSION
In this paper, ANFIS were used in device and circuit modeling and optimization problems. An accurate linear passive device model based on neuro-fuzzy network representation of its scattering parameters has been developed. The results presented in this paper have demonstrated the efficiency and the ability of using a neuro-fuzzy network model for CAD modeling of microstrip devices, and proved that the ANFIS global approximation and optimization is able to generalize. The efficient neuro-fuzzy models, once constructed, operate with a computation time which is negligible compared to the traditional techniques, such as EM simulation, and are suited for utilization in interactive CAD applications. In addition, using the ANFIS approach in interactive CAD applications makes the memory size requirements of the simulation significantly lower than using traditional techniques such as EM simulations or table-based models. The ANFIS model trained by the HL algorithm can easily be applied to other microwave problems. The ANFIS is a very powerful approach for building complex and nonlinear relationship between a set of input and output data. Accurate, fast, and reliable ANFIS models can be developed from measured/simulated microwave data.
 Youssef Harkouss received the Ph.D. degree in electronics from the University of Limoges, France, in 1998. From 1999 to 2000, he was Research Engineer at the CNRS, France. He joined the Lebanese University in 2001 as an Associate Professor. His research interests include advanced fuzzy neural networks software development, fuzzy neural network modeling and optimization for microwave devices and circuits, CAD of passive devices, and fuzzy neural networks for controlling dynamic systems.