I. INTRODUCTION
As efficient strengthening contributors, copper precipitates in solutionizing-aging high strength low alloy/carbon multicomponent steels as well as in carbon-free model Fe–Cu or Fe–Cu–Ni alloys have been thoroughly studied. It has been revealed using high-resolution transmission electron microscopy that the structures of copper precipitates follow a complicated bcc → 9R → 3R → fcc sequence during the precipitation reaction in α-ferrite.Reference Othen, Jenkins and Smith1–Reference Monzen, Jenkins and Sutton4 And the composition measured by atom probe tomography (APT) at the early nucleation stage were proved to contain a large amount of Fe,Reference Schober, Eidenberger, Leitner, Staron, Reith and Podloucky5 with Ni, Mn, and Al partitioning at the precipitate/matrix heterophase interfaces.Reference Isheim, Kolli, Fine and Seidman6–Reference Kolli and Seidman10
Different from the dislocation-interacted isothermal precipitation during the aging of martensite, the nonisothermal precipitation during the continuous cooling of austenite is usually described in term of interphase precipitation, with the precipitates exhibiting a unique variant and aligned parallel to the planar segments of ferrite/austenite interfaces that migrate via a ledge mechanism.Reference Honeycombe and Mehl11–Reference Bhadeshia13 Depending on the actual cooling rate of the austenite, the Cu precipitates themselves may have limited time to grow or even be constrained at a critical cooling rate.Reference Abe, Kurihara, Tagawa and Tsukada14 The factors such as solutes diffusion or partitioning behaviors in untransformed austenite and its products may interplay with the nucleation barriers and the driving force of copper precipitates. Thus, the nature of copper precipitation greatly correlates with the austenite decomposition process at a given cooling rate, particularly in multicomponent system.
The previous studies on the interphase precipitation of ε-Cu were conducted mainly by using transmission electron microscopy (TEM), showing the distribution, morphology, size, and structure of the precipitates.Reference Thompson, Colvin and Krauss15–Reference Thompson and Krauss17 It was found that for the isothermal precipitation the interphase copper precipitates had more than one variant and they interacted with dislocations within a single grain of polygonal ferrite (PF).Reference Thompson, Krauss and Tseng18 However, the solute partitioning behaviors at the moving ferrite/austenite boundary and the structural and/or compositional evolution of copper precipitates during the nonisothermal precipitation are still unknown. The modern three-dimensional atom probe technique can provide the local composition information with the atomic resolution. The objective of this work is to understand the correlation of Cu precipitation and austenite–ferrite transformation during the nonisothermal precipitation by examining the solute partitioning behaviors at atomic scale using APT technique.
II. EXPERIMENTAL PROCEDURE
The experimental steel, with a composition of 0.04 C, 0.24 Si, 0.84 Mn, 1.15 Cu, 1.94 Ni, 0.51 Mo, 0.50 Cr, 0.043 Nb, 0.009 Ti, 0.03 Al, 0.004 N, 0.007 P, and 0.004 S (wt.%), was prepared by vacuum induction melting, followed by casting in a 80 kg ingot, then homogenized, forged, and hot-rolled from 140 to 32 mm in thickness, followed by air cooling. The continuous cooling transformation thermal cycle consisted of heating to an austenitizing temperature of 905 °C at a nominal rate of 10 °C/s and holding for 5 min, then cooling to room temperature at a rate of 0.1 °C/s. Rod-shaped specimen for dilatometry measurement using a Gleeble 3800 thermomechanical simulator (Gleeble, Dynamic Systems Inc., Poestenkill, NY) was machined from the as-rolled plate, with a gauge length of 10 mm and a diameter of 6 mm. The specimens for microstructural characterization and APT analysis were cut from the center of the gauge length, where the temperature and dilatometry were monitored by the thermocouple and the dilatometer, respectively. The specimen for optical microscopy was etched with 2% nital. The TEM observation was conducted in a JEOL 2010 F (Tokyo, Japan) at 200 kV. The thin foils for TEM were prepared by mechanically grinding sample slices to 80-μm thick and twin-jet electropolishing in a mixture of 90 vol pct alcohol and 10 vol pct perchloric acid at 243 K under 50 V. The APT experiment, using an advanced Imago (now Cameca Instruments) local electrode atom probe (LEAP, 3000X HR, CAMECA, Gennevilliers, France), was performed at a residual pressure of 3 × 10⁻⁹ Pa and a specimen temperature of 50 K, and with a pulse repetition frequency of 200 kHz, a pulse-voltage to dc-voltage ratio of 15%. Atom probe tips were prepared by using standard two-stage electropolishing method at room temperature. Data analysis was performed using the IVAS software. The copper-rich precipitates were discriminated by a 10 at.% Cu isoconcentration surface, obtained with a voxel size of 1.0 nm and a delocalization distance of 2.0 nm, and the corresponding compositional analysis was performed with the proximity histogram method.
III. RESULTS
A. Dilatometric analysis
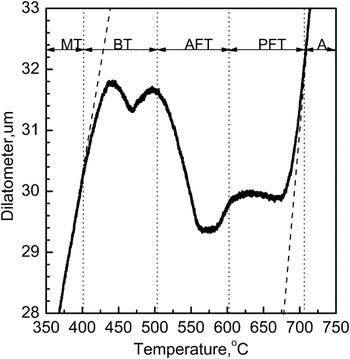
Figure 1 shows the dilatational curve of the steel continuously cooled from austenite phase at a rate of 0.1 °C/s. Clearly distinguishable multistage transformations were observed, corresponding to the formation of complex microstructures, including PF (polygonal ferrite), AF (acicular ferrite), B (bainite), and M (martensite). The associated transformation temperatures ranged from about 709 °C when ferrite transformation started to about 403 °C when martensite transformation started. Over the temperature range, carbon and alloy elements such as nickel, manganese, copper, etc. diffused from the newly formed ferrite to the untransformed austenite, greatly impacting on the subsequent austenite decomposition kinetics. The PF first nucleated on the austenite grain boundaries (GB) and then grew into interior grain, and then the acicular and/or granular ferrite (GF) was formed at comparatively lower temperatures. The actual bainite or martensite transformation temperatures and final fraction of the austenite decomposition products can be explained by the degrees of solute enrichment in the austenite, depending on the extent of ferrite transformation. Thus, a sequential transformation pattern was recorded, i.e., the ferrite formation was followed by bainite and martensite transformations, respectively.
Dilatational curve showing the transformation range of each phase. A—austenite, FT—ferrite transformation, BT—bainite transformation, and MT—martensite transformation.

B. Microstructure characterization
1. Light microscopy
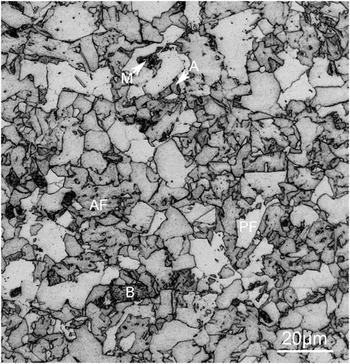
The microstructure of the steel continuously cooled at 0.1 °C/s contained a variety of structural components, which are labeled as PF, AF, B, A, and M in Fig. 2. The crystals of ferrite with relative straight boundaries are often referred to as PF and that with irregular boundaries and lath or plate morphology are defined as AF or GF. A nonlamellar grain with visible dispersive carbides is regarded as bainite from generalized microstructural definition. An amount of isolated regions of austenite and martensite locate between the microconstituents. The predominant microconstituent is PF with a grain size up to about 20 μm.
Optical micrograph showing the multiphase microstructure. PF—polygonal ferrite, AF—acicular ferrite, B—bainite, M—martensite, and A—austenite.

2. Transmission electron microscopy
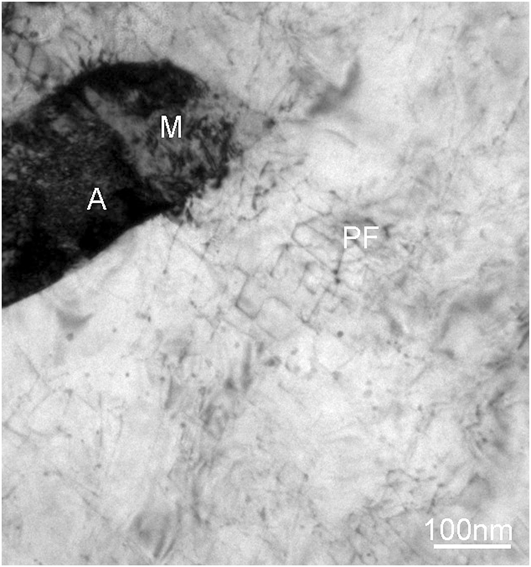
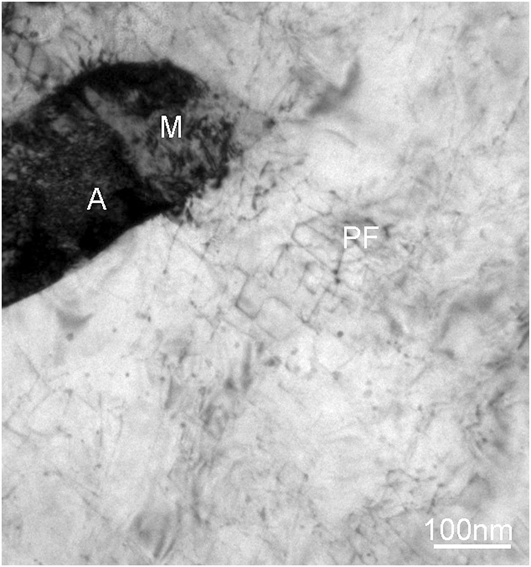
Figure 3 is a TEM image showing the precipitates of ε-copper in PF. The majority of microconstituent is composed of a part of PF grain, which is in contact with a small island of retained austenite (RA) and martensite. A modest number of ε-copper precipitates are present in PF, but similar precipitation was not observed in regions of retained austenite and martensite, which is consistent with the previous study.Reference Thompson, Colvin and Krauss15–Reference Thompson and Krauss17 A low dislocation density is evident in this grain of PF. However, there is no strong correlation between the precipitates and matrix dislocations, which is different from that in the isothermally aged condition. No visible precipitates are detected, especially, nearby the ferrite/austenite boundary, which is probably attributed to the lack of diffraction contrast of the nanosized bcc copper precipitate that is coherent with the surrounding ferrous matrix.
A typical transmission electron microscopy micrograph of the precipitation of ε-copper in association with polygonal ferrite. PF—polygonal ferrite, M—martensite, and A—austenite.
C. Microconstitution reconstruction by APT
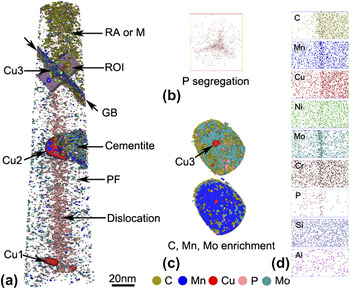
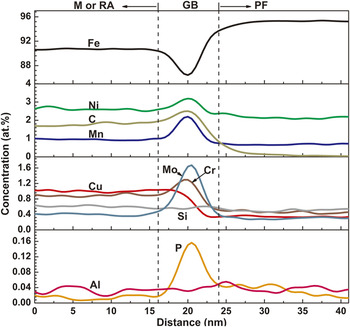
Figure 4(a) shows the microconstituents of the GB of RA and PF, cementite, and copper precipitates formed during austenite–ferrite transformation. The retained austenite, or martensite, exactly because of low specimen temperature of 50 K when conducing APT analysis, is delineated by the enrichment of carbon. A cementite enriched with molybdenum, chromium, and manganese is referred as alloy cementite. The partitioning behaviors of various elements between cementite and ferrite matrix were experimentally and computationally studied.Reference Ande and Sluiter19 A cross section view in Fig. 4(b) gives a surprising distribution of phosphorus in PF, presenting a triple junction that is similar to regular GB. In many ferrous alloy systems, phosphorus segregation at dislocation line is quite common. However, due to crystallographically dependent surface diffusion, phosphorus is prone to redistribute and segregate along certain crystal orientation during field evaporation, resulting in the linear distribution. Three representative copper precipitates locate in the PF, cementite, and ferrite/austenite heterophase interface. The copper precipitate marked by Cu1 is formed in far PF at comparatively higher temperature during continuous cooling. The copper precipitate marked by Cu2 is formed nearby the cementite, the appearance of which is considered to accelerate the growth of the copper precipitate. The similar heterogeneous nucleation and co-growth of carbides and copper precipitates have been reported during aging.Reference Mulholland and Seidman20 The copper precipitate marked by Cu3 is embedded at the ferrite/austenite boundary shown in Fig. 4(c). Since the interphase precipitation occurs predominantly at the low energy, immobile broad faces of ledges, rather than at the higher energy, mobile risers of ledges,Reference Aaronson, Plichta, Franti and Russell12 the ferrite/austenite boundary here is probably the low-energy interface, which implies a Kurdjumow–Sachs orientation between austenite and ferrite. Figure 4(c) shows the homogeneous distribution of carbon, manganese, and molybdenum along the planar ferrite/austenite heterophase interface, suggesting the lateral mobile high-energy ledges cannot induce either copper precipitation or solute segregation. Figure 4(d) shows the solute partitioning behaviors in the ferrite and RA, and the corresponding composition profiles are given in Fig. 5.
Atom probe tomography reconstructed three-dimensional images of the experimental steel cooled slowly from full austenite phase at a rate of 0.1 °C/s. (a) Distribution of atom isoconcentration surfaces. Polygonal ferrite (PF) and retained austenite (RA) or martensite (M) delineated by 1% carbon isoconcentration surface, and their interface, i.e., grain boundary (GB) marked by arrows, selected using a subset box as a region of interest (ROI) for further analysis. The copper precipitates (marked by Cu1, Cu2, and Cu3), cementite with carbon enrichment, and phosphorus segregation were defined respectively at 10 at.% Cu, 2 at.% Mn, and 1 at.% Mo, and 0.2 at.% P isoconcentration surfaces. The nickel and chromium atoms, the distribution of which is separately similar to that of manganese and molybdenum, as well as the other remaining atoms, is not shown for clarity; (b) phosphorus segregation map viewed in the analysis direction; (c) cross section of PF/RA or M boundary with carbon, molybdenum, and manganese isoconcentration surfaces and Cu3 precipitate; (d) the distribution of C, Mn, Cu, Ni, Mo, Cr, P, Si, and Al atoms in the selected ROI in (a).

One-dimensional composition profile of IOR in Fig. 4 shows solutes partitioning at the ferrite/austenite GB.

1. Solute partitioning behaviors at ferrite/austenite heterophase interface
Compared to PF, the RA contains more C, Cu, and Cr, slightly more Ni, Mn, and Mo, and almost the same Si, Al, but less P. The C, Ni, Mn, Mo, Cr, and P all segregate to the ferrite/austenite boundary with different level, as shown in Fig. 5. The effects of carbon, nickel, and manganese on the nature of the austenite/ferrite interface and the kinetics of the phase transformation were comprehensively studied.Reference Ricks, Howell and Honeycombe21–Reference Militzer, Pandi and Hawbolt24 Chromium in steel is often considered to have similar effects and behaviors with molybdenum in aspect of physical metallurgy in most cases. However, chromium but molybdenum is surprisingly found to enrich in the austenite. The partitioning behavior of chromium is probably the same as that of nickel and manganese. The phosphorus segregation in the vicinity of ferrite/austenite boundary makes a slightly higher content of phosphorus in PF size. Copper neither segregates at the GB nor enriches in the RA that contains the same copper content as nominal composition. A considerably lower copper in PF was probably resulted from the interphase precipitation of copper and consequently depleted surrounding ferrite matrix. The partitioning behavior of copper is seemly inconsistent with the previous view on the growth kinetics of ferrite,Reference Ohtsuka, Ghosh and Nagal25 i.e., the untransformed austenite is richer in copper as there is more ferrite formed during continuous cooling. The difference is probably attributed to the relatively lower temperature that is associated with the formation of RA as a final microstructural constituent. As austenite stabilizer, copper is not expected to precipitate out of the untransformed austenite since the diffusivity of copper is very low (<10−18 cm2 s−1) at low temperature.Reference Gagliano26 However, copper can precipitate in austenite during simulated heat-affected zone thermal cyclesReference Yu, Caron, Babu, Lippold, Isheim and Seidman27 and relatively high-temperature tempering of Fe–25% Mn–5 Ni–6 Cu–0.59 C (wt.%) steel.Reference Isheim, Vaynman, Fine and Seidman28 Except Si, Al, and Cu, the segregated elements such as C, Mn, Ni, Cr, Mo, and P may all exert a solute drag effect on the ferrite/austenite boundary movement. The nucleation and growth kinetics of ferrite during austenite–ferrite transformation are governed by not only carbon diffusion but also solute interfacial segregation.
2. The compositional variety of copper precipitates
The equivalent size and composition of copper precipitates with different locations in Fig. 4(a) are given in Table I. The actual size of the precipitates is represented here by the spherical volume equivalent radius (R). Three precipitates are all copper-rich but also contain significant concentrations of iron, nickel, and manganese and smaller quantities of silicon and aluminum. With the increase of copper precipitate size, the concentration of iron, silicon, and aluminum decreases and copper, nickel, and manganese increases, except an unusually high concentration of nickel and manganese in Cu3. The growth of Cu3 is constrained at low temperature when austenite decomposition ceases, but the abundance of nickel and manganese is available at the ferrite/austenite interface as shown in Fig. 5. The nickel and manganese have segregated to the copper precipitate at its initial nucleation stage.
The spherical volume equivalent radius (R) and chemical composition measured by atom probe tomography in at.% of Cu precipitates with different location.

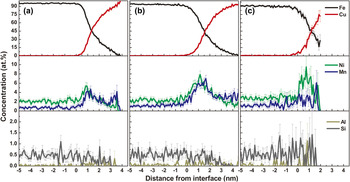
The proxigram concentration profiles of the copper precipitates, their interfaces, and the surrounding matrix are displayed in Figs. 6(a)–6(c) for Cu1, Cu2, and Cu3, respectively. Although the maximum copper concentration in the precipitate’s center decreases from about 100 to 75% for Cu1, Cu2, and Cu3, the nickel and manganese concentrations at the matrix/precipitate heterophase interface distinctively increase, except a decrease in manganese concentration for Cu3. The segregation of silicon and aluminum is not obvious because of low initial nominal concentration. The development of spherical shell enriched in nickel and manganese at the precipitate/matrix heterophase interface in continuous cooling is similar to that in the thermal aging, which has been thoroughly discussed.Reference Kolli, Mao, Seidman and Keane8–Reference Kolli and Seidman10 However, the actual compositions and corresponding interface segregations of nickel and manganese in copper precipitates shown in Fig. 6 imply that the copper precipitates formed in continuous cooling are not only depending on the sizes but also on the austenite–ferrite transformation process. During continuous cooling, the nature of copper precipitation is affected by both the formation of microconstituents, such as cementite and GB, and solute diffusion behaviors during austenite decomposition.
Proxigram concentration profiles (at.%) for iron, copper, nickel, manganese, aluminum, and silicon, with respect to 10 at.% copper isoconcentration surface of precipitates (a) Cu1, in far polygonal ferrite; (b) Cu2, at the alloyed cementite; and (c) Cu3, at the ferrite/austenite GB, showing the partitioning behaviors of nickel, manganese, aluminum, and silicon at the copper precipitate/ferrite matrix heterophase boundary. The error for each concentration is based on counting statistics,  , where N tot is the total number of atoms detected. The larger error bars are due to a smaller number of atoms present in each bin.

IV. DISCUSSION
A. Copper precipitation associated with austenite–ferrite transformation
During temperature history in continuous cooling, the formation of PF at higher temperature accompanies with the diffusion of carbon and other alloyed elements, such as nickel and manganese, into the untransformed austenite. During this process, the degree of the solute enrichment in untransformed austenite changes with decreasing temperature, which has a significant effect on the final austenite decomposition produces and copper precipitation at lower temperatures. However, copper precipitation in continuously cooled steel with a given composition only occur when (i) the copper enrichment in untransformed austenite reaches a critical concentration and (ii) a proper temperature and time are provided for the nucleation and growth of copper precipitates. At high temperatures during cooling, precipitate-free ferrite formed, whereas at low temperatures, nucleation of copper precipitates occurred at ferrite/austenite heterophase interfaces. After the austenite–ferrite transformation is finished, copper in untransformed austenite remains in solution during and after the following austenite decomposition process. Although a variety of structural components is formed during austenite decomposition process, copper precipitation only correlates with the formation of PF at about 650–600 °C temperature interval shown in Fig. 1 and does not occur in association with GF, AF, B, or M.Reference Thompson and Krauss17
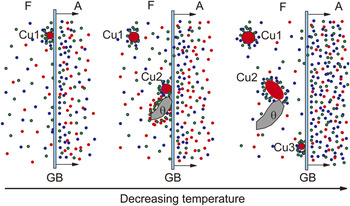
Since the ferrite/austenite boundary migrates from the far PF to the RA until the austenite–ferrite transformation ceased, there is possibly a decreasing temperature gradient for the formation of microconstituents from far PF to ferrite/austenite heterophase interface, i.e., from the bottom to top in Fig. 4(a). The interphase precipitation of Cu1 to Cu3 is considered to be associated with the formation of PF that is transformed from the more concentrated austenite because the solutes of nickel, copper, and manganese diffuse to untransformed austenite with decreasing temperature, as shown in Fig. 7.
Schematic diagrams showing the copper (red dot), nickel (green dot), and manganese (blue dot) solutes diffusion and redistribution process companying the austenite–ferrite transformation and the associated copper precipitation. F—ferrite; A—austenite; θ—cementite; GB—ferrite/austenite GB.

Cu1 first nucleates at ferrite/austenite boundary through interphase precipitation at a high temperature when just a limited volume of PF is formed. Because most of copper, nickel, and manganese atoms are enriched in the untransformed austenite as ferrite/austenite boundary migrating, the growth and coarsening of Cu1 were substantially constrained in the copper-depleted ferrite, with a modest nickel and manganese segregation at the copper precipitate/matrix heterophase interface. Cu2 is formed after the nucleation of Cu1 and experiences shorter time for growth and coarsening within a relatively lower temperature range. However, during the interphase precipitation of Cu2, the untransformed austenite with relatively higher copper concentration offers more free copper atoms. Besides, additional copper atoms are also available as the growth of the nearby copper-depleted cementite. Consequently, Cu2 has a comparatively larger size and higher level of nickel and manganese segregation than Cu1. Cu3 probably nucleates at the immobile ferrite/austenite boundary after the austenite–ferrite transformation has been finished. A plenty of copper atoms are available in the adjacent RA but cannot migrate in a long distance at low temperature to contribute to the growth and coarsening of Cu3. Since copper precipitation does not occur any longer after the austenite–ferrite transformation ceases, no copper precipitate is considered to be formed through interphase precipitation within the temperature range of 600–400 °C when austenite transforms to the other phases. However, a certain number of copper atoms are still in solution in the transformed ferrite, which contributes to not only the growth and coarsening of existing copper precipitates, such as Cu1 and Cu2 that are formed by interphase precipitation, but also the nucleation of new copper precipitates like Cu3.
B. The manners of copper precipitation
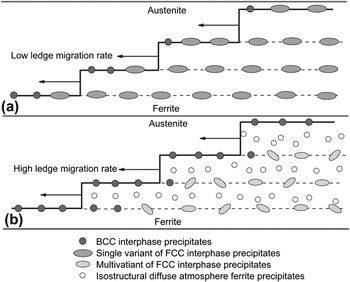
In light of the interphase precipitation model presented by Thompson et al.,Reference Thompson, Krauss and Tseng18 the final interphase precipitate morphology is significantly influenced by the ratio of the ledge-migration rate to the bcc copper precipitate growth rate. In a traditional interphase precipitation model, as shown in Fig. 8(a), when the rate of ledge migration is low, copper atoms segregate and precipitate on the migrating ferrite/austenite GBs. Because the bcc copper nuclei growth rate is comparatively high, the copper precipitate tends to grow and coarsen before embedding in the ferrite. Consequently, no bcc transition copper precipitates are detected in previous TEM observations. Besides, the copper precipitate often possesses only single variant because of high crystallographic constraints of ferrite and austenite. In the alternative model as shown in Fig. 8(b), the ratio of the ledge-migration rate to the bcc copper precipitate growth rate is comparatively high enough that the bcc copper precipitates are overrun by the growth ledge prior to transforming to the fcc copper phases. Eventually, the bcc copper precipitates exceed a critical size and transform into the more stable fcc copper phase with several variants for low crystallographic constraints of single ferrite.
Schematic diagram showing the manners of copper precipitation during ferrite–austenite transformation. (a) bcc-copper interphase precipitates transform to the equilibrium fcc copper form at the ferrite/austenite heterophase interface. (b) bcc-copper interphase precipitates are embedded within the ferrite crystal before giving way to the formation of the equilibrium fcc copper form and newly formed copper precipitates in ferrite.

In the present study, the migration rate of ferrite/austenite boundary is assumed to be comparatively high since the austenite–ferrite transformation associated with copper precipitation occurs mainly at a temperature above 600 °C. All the copper precipitates are small enough to be regarded as transition bcc copper phase at the initial nucleation stage. Consequently, the copper precipitation adopts the second model discussed above. The structural and compositional evolution of bcc copper precipitate, after being embedded within ferrite in continuous cooling, is the same as that in aging. The actual precipitation reaction is simultaneously influenced by the formation of cementite in ferrite and the partitioning behaviors of solute atoms such as nickel and manganese at the ferrite/austenite heterophase interface. Besides, the copper atoms in solution can precipitate between the intervals of interphase precipitation, as shown in Fig. 8(b), by hollow circle.
V. CONCLUSION
The APT investigation of the correlation of copper precipitation with austenite–ferrite transformation in a slowly cooled multicomponent steel has been conducted, and the following conclusions can be drawn:
(i) A variety of structural components including PF, AF, B, M, and RA is transformed from austenite with different enrichment of solute atoms such as nickel, manganese, copper, etc. Copper precipitation only occurs above about 600 °C in association with the formation of PF.
(ii) The nucleation and growth of copper-depleted cementite lead to an unusual growth of the surrounding copper precipitate. The enrichment of solutes in austenite can contribute to the interphase precipitation of copper phase. The appearance of microconstituents in ferrite greatly influences the size and composition of copper precipitates with nickel and manganese segregation shell.
(iii) The bcc copper nuclei is overrun by the ferrite/austenite heterophase interface and transforms to more stable fcc copper phase after being embedded within ferrite. The structural and compositional evolution is the same as that for the isothermal aging. Besides, copper precipitation can also occur in PF after the austenite–ferrite transformation is finished.
ACKNOWLEDGMENTS
The authors are grateful for financial support from the National Natural Science Foundation of China (Grant No. 50931003) and Shanghai Leading Academic Discipline Project (S30107).