
I. INTRODUCTION
In the last two decades, many intermetallic compounds have been investigated to test their feasibility with the increasing demands of structural materials, which have the abilities of withstanding severe oxidizing environments and high operating temperatures. Reference Tian, Wang and Li1 Pt based alloys are one of the most important intermetallic materials, which have widespread applications in medical, thermoelectric, and electrode devices. Reference Mun, Watanabe, Rossi, Stamenkovic, Markovic and Ross2–Reference Liu, Ma, Zhang, Hongsirikarn and Goodwin4 Among Pt based alloys, Pt3M alloys (M stands for metal atom) belong to the binary intermetallic family with L12 structure, which will show interesting physical properties on both fundamental and industrial aspects.
The structural, electronic, elastic, magnetic, thermodynamic, stability, phase diagrams, and cohesive properties of Pt3M alloys have been widely studied experimentally and theoretically. Reference Huang, Yamabe-Mitarai and Harada5–Reference Pan, Guan, Wen, Zhang, Wang and Tan19 Experimentally, some researchers have studied the structure, lattice, valence band electronic structure and phase separation of Pt3M alloys or nanoparticles, such as Pt3Al, Pt3Sn, Pt3V, and Pt3Mn. Theoretically, some researchers have studied the structural, electronic, elastic and vibrational properties of the intermetallic Pt3M alloys, such as Pt3Al, Pt3V, and Pt3Ni, by using first-principles density functional theory (DFT). Calculated results reveal that the elastic constants, bulk modulus, and shear modulus of Pt3Al alloys increase linearly, and the bond lengths of Pt–Al metallic bonds and the peak at E F decrease with the increasing of pressure. Reference Liu, Huang, Pan, Zhao and Liang15 Meanwhile, the calculated results of elastic constants of Pt3V showed that the considered materials are mechanically stable and could behave as ductile materials. Reference Arlkan, yigör, Candan, Özduran, Karakoç, Uğur, Uğur, Bouhemadou, Bin-Omran and Guechi17 However, despite numerous encouraging theoretical and experimental studies on the physical properties of Pt3M alloys, to our knowledge, it is still necessary to fulfill an overall calculation on the compound. According to the outermost electron number, atoms are arranged for columns in the periodic table of elements, which indicates atoms from a certain column should have similar properties, such as alkali metals, alkaline earth metals, and main group metals. Meanwhile, transition metals, which are arranged between the alkaline earth metals and main group metals, should have some unique characteristic for their unfilled d orbital of valence band. When M represents different metal atoms in periodic table, Pt3M alloys may show similar properties or some regularity.
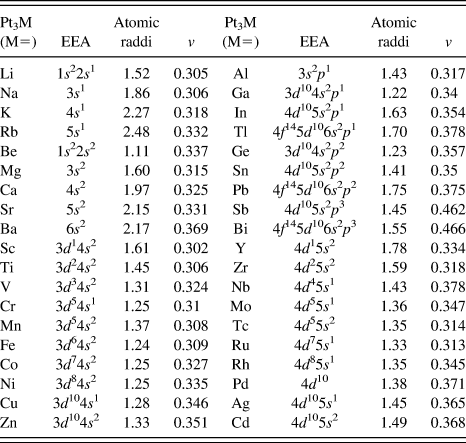
In this paper, first-principles calculations have been introduced to calculate the structural stability, elastic and electronic properties of Pt3M alloys, while M atom covers alkali metals, alkaline earth metals, main group metals, and transition metals. According to the number of outermost electron, M will be divided into 5 groups, namely s 1, s 2, p 1, p 2 , and p 3 groups. The selected atoms are listed in Table I. A thought similar to the high-throughput (HT) Reference Xiang, Sun, Briceno, Lou, Wang, Chang, Wallace-Freedman, Chen and Schultz20–Reference Jain, Hautier, Moore, Ong, Fischer, Mueller, Persson and Ceder26 computing method is performed to improve our calculation efficiency. The rest of this paper is structured as follows: a brief summary of the computational methods and details are given in Sec. II. The results of structural, elastic and electronic properties of Pt3M alloys are presented and discussed respectively in Sec. III. Finally, a short summary is given in Sec. IV.
Extranuclear electrons arrangement (EEA), atomic raddi of M in Å, and the calculated Poisson ratio of Pt3M alloys.

II. COMPUTATIONAL DETAILS
The DFT calculations were performed with the Vienna ab initio simulation package (VASP), Reference Kresse and Furthmueller27–Reference Kresse and Furthmuller29 in which the Kohn–Sham equations are solved by self-consistent algorithms. The exchange-correlation functional was described within the generalized gradient approximation (GGA) in the scheme of Perdew, Burke and Ernzerhof (PBE). Reference Perdew, Burke and Ernzerhof30–Reference Jiang34 To improve the calculation efficiency, core electrons were replaced by the projector augmented wave (PAW) pseudo-potentials, Reference Bloechl35,Reference Kresse and Joubert36 and the valence electrons were described by plane wave basis set. A plane-wave cutoff energy of 400 eV was used and the Brillouin zone integration was made on a 13 × 13 × 13 Monkhorst–Pack k-point mesh for the bulk calculations. The choice of the grid was based on calculations done with various from 3 × 3 × 3 to 19 × 19 × 19. The Gaussian smearing method was used to determine electron occupancies with a smearing parameter δ of 0.1 eV. Convergence criteria for electronic self-consistence and ionic relaxation loop were set at 10−5 eV and 0.01 eV/Å, respectively.
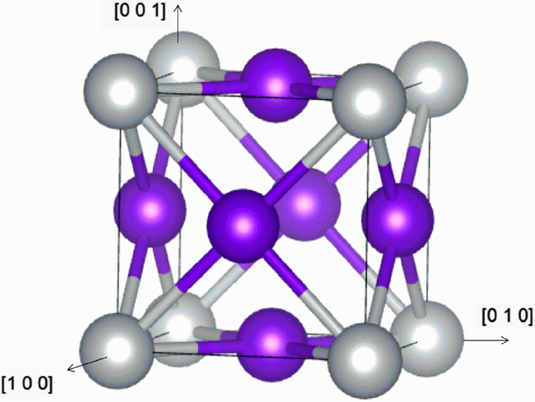
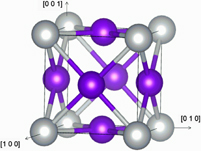
The calculated lattice constant of Pt is 3.95 Å, which is in good agreement with the previous theoretical result of 3.99 Å (Ref. Reference Yang, Wang and Yu37) and the experimental value of 3.92 Å. Reference Branger, Pelosin, Badawi and Goudeau38 We assumed that the Pt3M alloys possess close-packed fcc structures, in which the Pt atoms occupy the face-centered positions and the M atoms are located at the corners in unit cell. Reference Ma and Balbuena39 The Pt and M atoms are located at the site (0.5, 0.5, 0) and (0, 0, 0) respectively, as shown in Fig. 1. Reference Zhang and Akiba40 For each Pt3M alloys, the lattice constant was obtained by using Birch–Murnaghan equation of state (EOS) fitting.
Unit cell of close-packed fcc Pt3M alloy. Gray and purple spheres represent the M and Pt atoms, respectively.

III. RESULTS AND DISCUSSIONS
A. Structural properties
The structural optimization was firstly calculated with the conjugate-gradient algorithm by full relaxation of unit cell volume and shape as well as the internal atomic positions. The total energy E(V) as a function of volume of cell V were fitted to a Birch–Murnaghan 3rd-order EOS Reference Birch41 :
 $$E\left( V \right) = {E_0} + {{9{V_0}{B_0}} \over {16}}\left( {{{\left[ {{{\left( {{{{V_0}} \over V}} \right)}^{{2 \over 3}}} - 1} \right]}^3}{{B'}_0} + {{\left[ {{{\left( {{{{V_0}} \over V}} \right)}^{{2 \over 3}}} - 1} \right]}^2}\left[ {6 - 4{{\left( {{{{V_0}} \over V}} \right)}^{{2 \over 3}}}} \right]} \right)\quad ,$$
where V
0 is the equilibrium volume, E
0 is the total energy, B
0 is the equilibrium bulk modulus, and
 ${B'_0}$
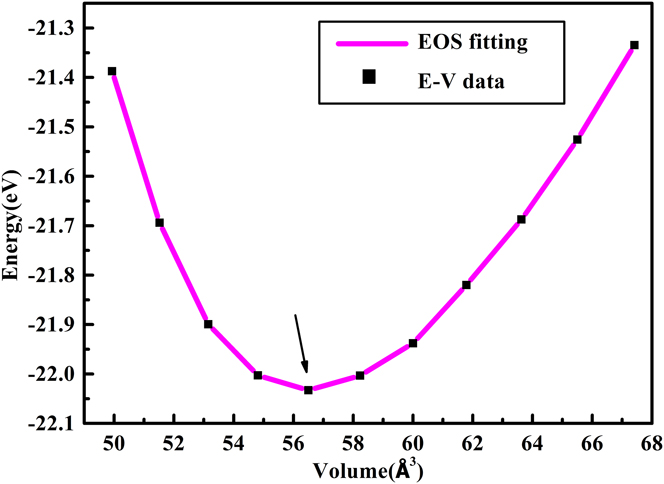
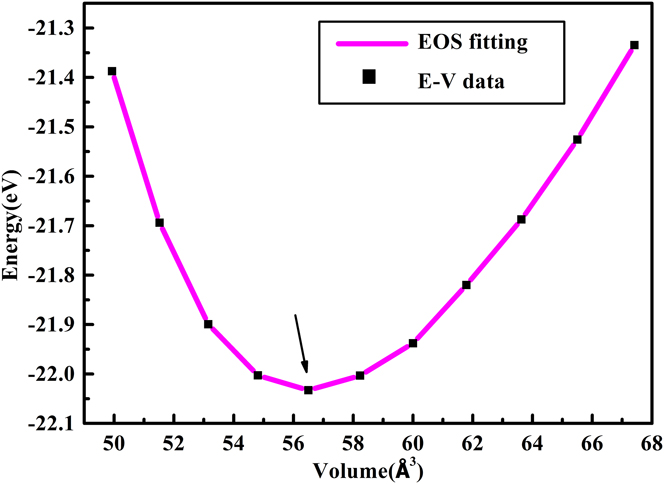
is its pressure derivative. EOS fitting method is introduced to obtain the equilibrium lattice constants of Pt3M alloy for structural optimizing. Figure 2 shows the E–V data and EOS fitting curve of Pt3Li, which reveals that Pt3Li alloy has its least total energy when its volume of cell equals 56.5 Å3, corresponding to the valley of EOS fitting curve who is pointed by a black arrow. And we can calculate the equilibrium lattice constant of Pt3Li is 3.84 Å.
The E–V data and EOS fitting curve of Pt3Li.
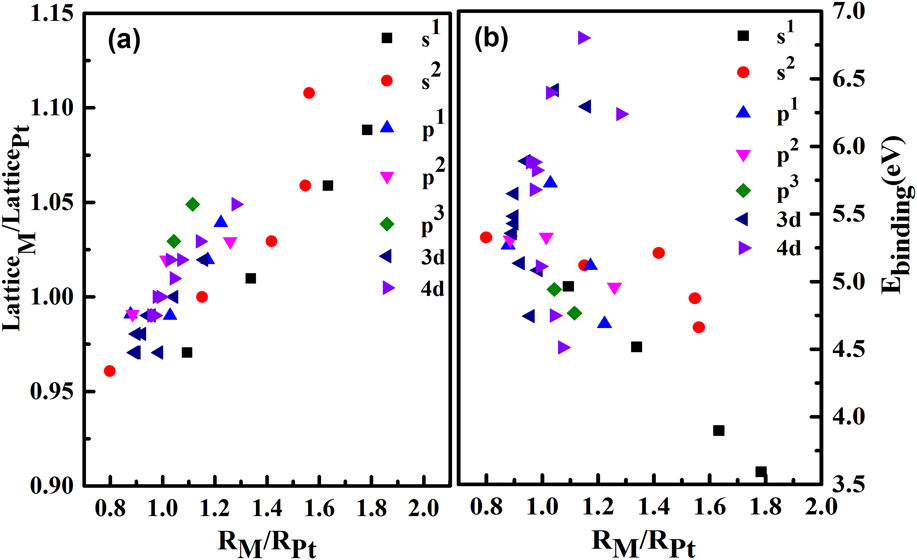
All equilibrium lattice constant of the selected Pt3M alloys are calculated. To reveals the relationship of equilibrium lattice constant and atom radius, the ratio of calculated equilibrium lattice of Pt3M alloys and Pt4 as a function of radius ratio R M/R Pt is shown in Fig. 3(a), where LatticeM and LatticePt represent the equilibrium lattice constant of Pt3M alloy and Pt4, R M and R Pt represent the radius of M atoms and Pt atom, respectively. The radius of M atoms are shown in Table I, and the radius of Pt is 1.39 Å. The black square, red round, light blue triangle, pink triangle, green diamond, dark blue triangle, and purple triangle dots express the relations of s 1, s 2, p 1, p 2, p 3 groups, and 3d, 4d transition metals, respectively. As the ratio increases, the calculated lattice parameters of each Pt3M alloys groups rise accordingly, except some incongruous dots of 3d and 4d transition metals. Each groups have an individual rising tendency. The black square dots almost arrange in a straight line which indicate a linear relationship. The red round and light blue triangle dots stand in a slant concave downwards way respectively, which reveal the situation of equilibrium lattice grow faster than radius ratio beyond the growth point. There are clusters of dots arrange as a vertical line, which indicates the alloys have different equilibrium lattice constants while the atomic radius are the same, such as Pt3Ti, Pt3Ag, and Pt3Sb. In addition, there exist groups of dots arrange as a horizontal line, which reveals the alloys have the same equilibrium lattice constants while the atomic radius are in different values, such as Pt3Fe, Pt3Co, Pt3Mn and Pt3Li. The most special situation is that there are two pairs of coincident points such as the dots who stand for the Pt3Tc/Pt3Rh and Pt3Co/Pt3Ni, which indicates they have the same atomic radius and equilibrium lattice constants, respectively.
The calculated equilibrium lattice constant and binding energy of Pt3M alloys as a function of R M/R Pt.
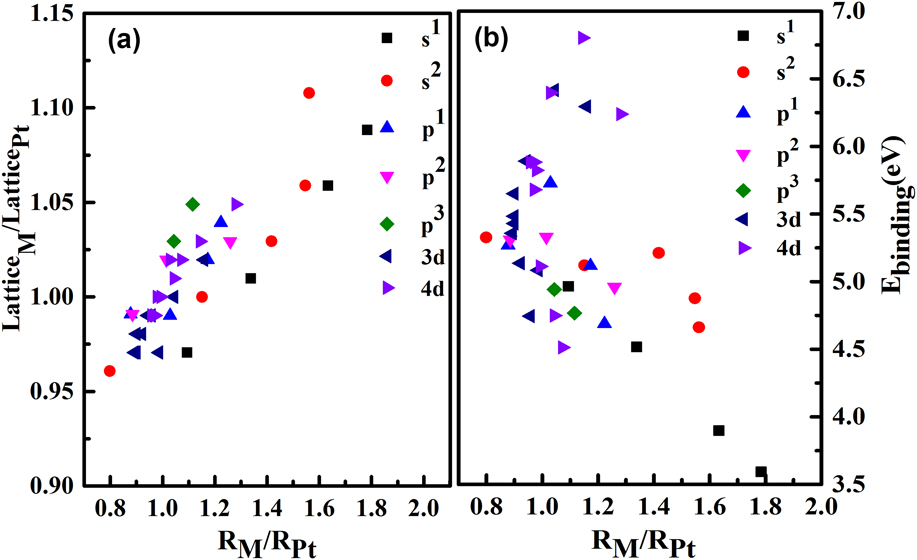
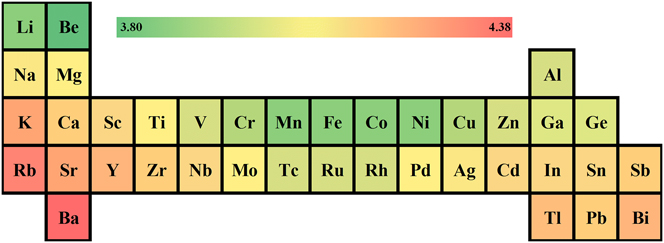
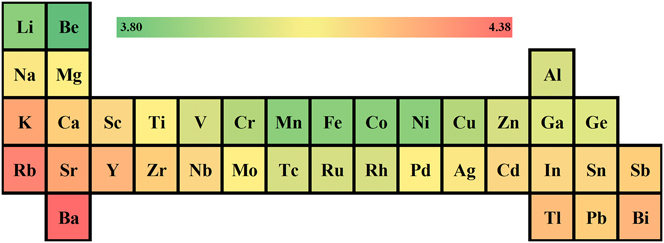
Figure 4 shows an incomplete periodic table of elements, who contains all the elements discussed in this article. The colors filled in the cells indicate the values of equilibrium lattice constant of each elements, that, the warmer the color, the higher the value of the equilibrium lattice constant. Therefore, the equilibrium lattice constant of a certain main group increase with the increasing of atomic number, for the colors become warmer with the increase of atomic number. In contrast, the equilibrium lattice constant of 3d and 4d transition metals decreased at first and increased later with the increase of atomic number. There is not only one minimum value in 3d and 4d group, and the minimum value appears from Mn (3d 54s 2) and Tc (4d 55s 2), respectively. This characteristic should be explained under the consideration of the electron status of d orbit, which we will refer in our next discussions.
The calculated equilibrium lattice constant of Pt3M alloys, alloys are arranged as the periodic table of elements, and the temperature of the colors fill in the cells reveals the values of the constant.
B. Binding energy
For a better understanding of the stability of Pt3M alloys, the binding energies of Pt3M alloys have been calculated according to the following equation:
 $${E_{\rm{b}}} = {{\left( {3{E_{{\rm{Pt}}}} + {E_{\rm{M}}} - {E_{{\rm{P}}{{\rm{t}}_3}{\rm{M}}}}} \right)} \mathord{\left/ {\vphantom {{\left( {3{E_{{\rm{Pt}}}} + {E_{\rm{M}}} - {E_{{\rm{P}}{{\rm{t}}_3}{\rm{M}}}}} \right)} 4}} \right. \kern-\nulldelimiterspace} 4}\quad ,$$
where E
b is the binding energy,
 ${E_{{\rm{P}}{{\rm{t}}_3}{\rm{M}}}}$
is the total energy of Pt3M alloy after the static optimization, E
Pt and E
M denote the free energy of the atom outside the crystal, i.e., the chemical potential of Pt and M. Figure 3(b) presents the calculated binding energy of Pt3M alloys as a function of radius ratio R
M/R
Pt. The black square, red round, light blue triangle, pink triangle, green diamond, dark blue triangle, and purple triangle dots express the relations of s
1, s
2, p
1, p
2, p
3 groups and 3d, 4d transition metals, respectively. As shown in Fig. 3(b), the calculated binding energy of s
1 group and radius ratio follow the pattern of linear relationship and the E
b of s
2 group decrease as the radius ratio increases. The light blue triangle and pink triangle dots arrange like a parabola going upwards, which indicate the calculated binding energy of p
1 and p
2 groups increase before the ratio of R
M/R
Pt smaller than 1.02 and decrease while the ratio larger than 1.02. For 3d, 4d transition metals, the dark blue triangle and purple triangle dots arrange like a rotated parabola toward right, which reveal the calculated binding energy of some atoms ascend and some atoms decline while the radius ratio increases.
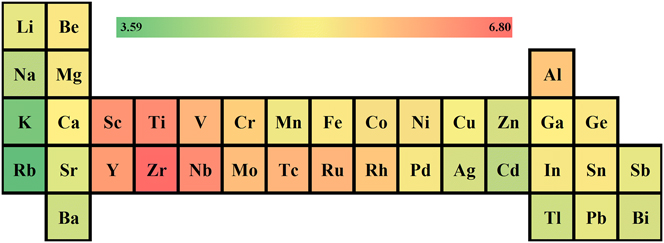
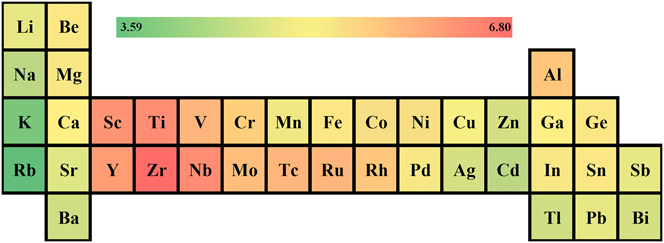
Similar to Fig. 4, Fig. 5 shows a periodic table of elements of binding energy value. As the color temperature reveals, the binding energy of a certain main group decrease with the increasing of atomic number, for fact of the colors become warmer with the increase of atomic number. However, the situation of 3d and 4d transition metals seems complex, the color temperature mainly becomes colder with the increase of the atom number, except some exceptions as Mn, Tc, and Ru, et al. The maximum binding energy value of 3d and 4d TM is Pt3Ti and Pt3Zr, respectively, while the minimum values are Pt3Zn and Pt3Cd, respectively.
The calculated binding energy of Pt3M alloys, alloys are arranged as the periodic table of elements, and the temperature of the colors fill in the cells reveals the values of the constant.
C. Elastic properties
Elastic modulus is the fundamental mechanical parameter. Typical parameters include strength, ductile, or brittle behavior based on the elastic constants C ij , bulk modulus B, shear modulus G, Young modulus E, and Poisson ratio v. Reference Liu, Huang, Pan, Zhao and Liang15,Reference Pan, Guo, Lin, Liu, Wang and Deng42–Reference Arıkan, İyigör, Candan, Özduran, Karakoç, Uģur, Uģur, Bouhemadou, Bin-Omran and Guechi44 The cubic structure has three independent elastic constants: C 11, C 12, and C 44. The C 11 gives the resistance to the unidirectional compression (compression along the principal directions 〈100〉), and C 44 presents the resistance to shear deformation across the (100) plane in the [110] direction. The requirement of mechanical stability in a cubic crystal leads to the following restriction on the elastic constants, Reference Beckstein, Klepeis, Hart and Pankratov45 C 11 > 0, C 44 > 0, C 11 − C 12 > 0. Taking into account the structural symmetry, the bulk and shear modulus of Pt3M are calculated by the Voigt–Reuss–Hill (VRH) approximation. Reference Hill46 The calculation criteria are as follows:
 $$B = {{\left( {{C_{11}} + 2{C_{12}}} \right)} \mathord{\left/ {\vphantom {{\left( {{C_{11}} + 2{C_{12}}} \right)} 3}} \right. \kern-\nulldelimiterspace} 3}\quad ,$$
 $${G_{\rm{V}}} = {{\left( {{C_{11}} - {C_{12}} + 3{C_{44}}} \right)} \mathord{\left/ {\vphantom {{\left( {{C_{11}} - {C_{12}} + 3{C_{44}}} \right)} 5}} \right. \kern-\nulldelimiterspace} 5}\quad ,$$
 $${G_{\rm{R}}} = {{5\left( {{C_{11}} - {C_{12}}} \right){C_{44}}} \mathord{\left/ {\vphantom {{5\left( {{C_{11}} - {C_{12}}} \right){C_{44}}} {\left[ {4{C_{44}} + 3\left( {{C_{11}} - {C_{12}}} \right)} \right]}}} \right. \kern-\nulldelimiterspace} {\left[ {4{C_{44}} + 3\left( {{C_{11}} - {C_{12}}} \right)} \right]}}\quad ,$$
 $$G = {{\left( {{G_{\rm{V}}} + {G_{\rm{R}}}} \right)} \mathord{\left/ {\vphantom {{\left( {{G_{\rm{V}}} + {G_{\rm{R}}}} \right)} 2}} \right. \kern-\nulldelimiterspace} 2}\quad ,$$
 $$E = {{9GB} \mathord{\left/ {\vphantom {{9GB} {3B + G}}} \right. \kern-\nulldelimiterspace} {3B + G}}\quad ,$$
 $$v = {{\left( {E - 2G} \right)} \mathord{\left/ {\vphantom {{\left( {E - 2G} \right)} {2G}}} \right. \kern-\nulldelimiterspace} {2G}}\quad .$$
According to the Pugh rule, Reference Pugh47 the Poisson ratio is used to quantify the stability of the crystal against shear, which usually ranges from −1 to 0.5. All the calculated Poisson ratios of Pt3M alloys do not exceed 0.47, which indicates their good stability against shear.
The calculated elastic constants C ij , bulk modulus, shear modulus, Young modulus are listed in Fig. 6. It is clear that the obtained elastic constants of Pt3M alloys meet the requirements, which reveals that they are mechanically stable.
The calculated elastic constants C ij , bulk modulus (B), shear modulus (G) and Young modulus (E) of Pt3M (M=) alloys.

Figures 6(a)–6(g) show the parameters of s 1, s 2, p 1, p 2, p 3 groups and 3d, 4d transition metals, respectively. The situation of s 1 and s 2 groups show that with the increasing of the atomic number, all the calculated parameters decrease. Figure 6(c) demonstrates calculated parameters of p 1 group, which indicates that C 11, C 12 and bulk modulus increase with the atomic number of M increases, and the outstanding results of In atom breaks the increasing trend of those of calculated C 44. Figure 6(d) reveals the calculated C 11, shear modulus and Young modulus decrease with the atomic number of M increases of p 2 group, while the calculated results of Pb atom breaks the decreasing trend of C 12 and bulk modulus. To express the manifestation of 3d and 4d transition metals, candidates are divided into early transition metals (the d orbits is half-filled) and late transition metals. As shown in Figs. 6(f) and 6(g), the early transition metals stand on the left side of a dash line, and the late transition metals arrange on the right side of the dash line. Mn (3d 54s 2) and Tc (4d 55s 2) atoms are chosen as the candidates for their unique electron configuration of five d electrons, two s electrons and the d orbit is half-filled. In general, the calculated parameters of early transition metals increase with the increase of atomic number, and for the late transition metals, the situation turns over. However, there always exist some exceptions, such as Ti (3d 24s 2) and Zr (4d 25s 2) of early transition metals and Ni (3d 84s 2) and Rh (4d 85s 1) atoms in late transition metals.
D. Local density of states (LDOS)
To further reveal the underlying properties and structural stability of Pt3M alloys, the electronic local densities of states (LDOS) of Pt atom in Pt and Pt3M alloys are shown in Fig. 7. Figures 7(a) and 7(b) represent the 3d, 4d transition metals and s 1, s 2, p 1, p 2, p 3 groups, respectively. The LDOS curves indicate that the peak value of Pt3M alloys increase with the atomic number of M increases in each groups. Compared with pure Pt, the LDOS of Pt atom in the bulk Pt3M alloys move away from the Fermi energy (E F), and the DOS at Fermi level decrease evidently. In addition, every Pt atom acquires about 0.136 electrons and every Ni atom lost about 0.407 electrons due to the electron transfer between Pt and Ni, which is in good agreement with the previous theoretical results. Reference Yang, Wang and Yu37
The local densities of states (LDOS) of Pt atom in Pt and M atoms in Pt3M (M=) bulks. The black vertical dotted line represents the Fermi level.

E. Deformation charge density and Bader charge analysis
The charge transfer is an important characteristic which can provide deep insight into the interaction between Pt and M metal. To analyze the charge transfer between Pt and M atoms, deformation charge density and Bader charge of Pt3M alloys are calculated. For accentuating the redistribution of charge density upon the interaction, the difference charge density is calculated by
 $$\Delta \rho = {\rho _{{\rm{P}}{{\rm{t}}_3}{{\rm{M}}_{{\rm{sc}}}}}} - {\rho _{{\rm{P}}{{\rm{t}}_3}{{\rm{M}}_{{\rm{nsc}}}}}}\quad ,$$
where
 ${\rho _{{\rm{P}}{{\rm{t}}_3}{{\rm{M}}_{{\rm{sc}}}}}}$
denote the self-consistent surface charge density and
 ${\rho _{{\rm{P}}{{\rm{t}}_3}{{\rm{M}}_{{\rm{nsc}}}}}}$
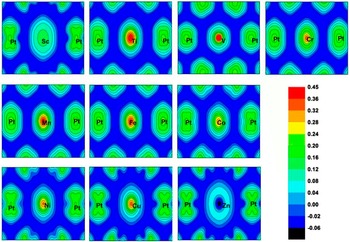
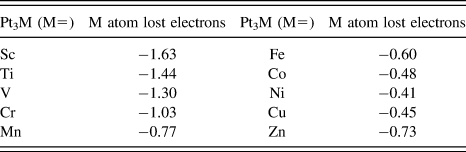
is the non-self-consistent surface charge density, which is a superposition of atomic charge densities. The plane for calculating is formed by (0, 0, 0), (0.5, 0.5, 0), and (0.5, 0, 0.5). The 2D plots of deformation charge density (M = 3d transition metals) are shown in Fig. 8 and the Bader charges of the interaction systems are presented in Table II.
Difference charge density maps of Pt3M alloys (M = 3d transition metals).

The Bader charge of 3d Pt3M alloys.
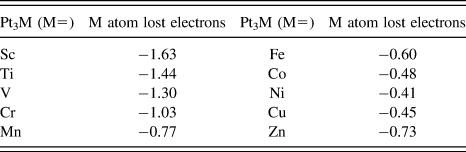
It is shown in Fig. 8 that all the M atoms and Pt atom have formed metallic bonds, respectively. The charges accumulate on the central atoms (such as Sc, Ti, V and Cr) before the 3d orbit is half-filled (before Cr), and the charges between the central atoms and Pt atom have a decreased tendency. when the 3d orbit is half-filled, the performance of electric gathering becomes weaker. On the contrary, the performance of electric gathering between central atoms and Pt atom becomes stronger. The shape of the orbit of Pt atom are different in each cases, which becomes from petals to oval and finally into petals. In all cases, the Pt atom in Pt3Sc alloy gets the most charges, while the Pt3Ni gets least. Similar results can be obtained by analyzing the Bader charge.
IV. CONCLUSIONS
In summary, first principles approach is introduced to calculate the structural stability, elastic modulus and electronic structure of Pt3M alloys including alkali metals, alkali earth metals, main group metals, 3d and 4d transition metals. The calculated elastic constants and elastic modulus demonstrated that all Pt3M alloys studied are mechanically stable, possess good stability against shear and behavior in a ductile manner. The equilibrium lattice constant increase with the increasing of the atom number in each main group and 3d, 4d TMs. In the contrast, the binding energy decrease with the increasing of the atom number in each main group and 3d, 4d TMs. However, there are some exceptions shown different characteristics, such as Mn, Tc, and so on. Researches show that, these irregular properties are related to the electron distribution of d orbit. The LDOS of all the M atoms including pure Pt is calculated, and the peak value of LDOS of M atom in Pt3M alloys increase with the atomic number of increases. Compared with pure Pt, the LDOS of Pt atom in the bulk Pt3M alloys move away from the Fermi energy, and the DOS at Fermi level decrease evidently. Finally, the deformation charge density and Bader charge is given to demonstrate the extent of charge transfer between Pt and M atoms. Our results indicate that Pt3M alloys provide a widespread selections of intermetallic materials.
ACKNOWLEDGMENTS
This work is supported by the National Basic Research Program of China (973 Program) under Grant No. 2014CB643900, the Open Fund of IPOC (BUPT), the Open Program of State Key Laboratory of Functional Materials for Informatics, and the National Natural Science Foundation of China under Grant No. 61440061. And supported by the Fundamental Research Funds for the Central Universities (No. 2015RC28), and the Fund of State Key Laboratory of Information Photonics and Optical Communications (BUPT) (No. IPOC2015ZT05).