

1 Introduction
The question of whether or not a linguistic unit is ‘salient’ is not a trivial one, especially because the concept of ‘salience’ is often invoked as an explanation of language change (see e.g. Trudgill Reference Trudgill1986). It is, however, an especially difficult question to answer. Part of the difficulty stems from the fact that the terms salient and salience are ‘maddeningly under-defined’ (Meyerhoff Reference Meyerhoff2006: 71) and are often used by different authors to refer to different processes. Another problem is the methodological challenge posed by such a task, particularly when exploring salience below the word level. How can we know whether listeners are sensitive to a particular morphological or phonological unit if that unit never occurs in isolation, but instead always appears in combination with other (often non-standard) linguistic forms in the speech signal? And, when that linguistic unit involves a vowel merger – the feature in focus in this article – how can we know whether listeners who display sensitivity to it are reacting to the phonetic quality of (one of) the vowel(s) or to the presence or lack of phonological contrast? This article will take us closer to being able to address these questions by (a) using acoustically manipulated audio stimuli in the study of language attitudes, (b) collecting listeners' continuous attitudinal responses in real-time and (c) employing new statistical techniques to interpret these continuous time-ordered data.
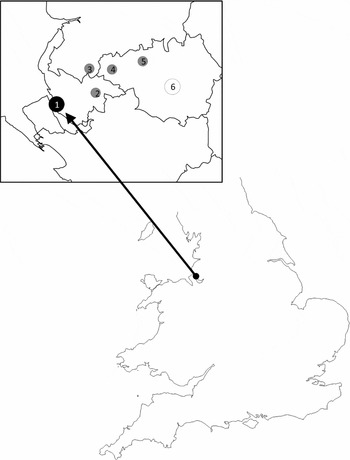
Specifically, we investigate the salience of the nurse~square merger.Footnote 2 In Standard British English, the nurse lexical set is typically realised as a mid central vowel [ɜː] and the square lexical set is typically realised as a diphthong approximating [ɛə], although in varieties across the north of England, the square vowel can also be realised as a mid front monophthong [ɛː]. For many speakers in parts of the north-west of England, including parts of Merseyside, Lancashire and Greater Manchester (Wells Reference Wells1982: 361; Beal Reference Beal, Kortmann and Upton2008: 135; see figure 1), nurse and square have merged, resulting in homophonous pairs of words such as her–hair; fur–fair; stir–stare; purr–pair.
Some localities known to have a nurse~square merger in north-west England, represented with filled shapes: 1: Liverpool, 2: St Helens (Tipton Reference Tipton2006), 3: Skelmersdale, 4: Wigan, 5: Bolton (Barras Reference Barras2006). No reports are known of a nurse~square merger in Manchester, the other urban centre in the region (empty circle 6), but it is included here as a geographical reference point

In this article, we investigate whether this particular merger is salient for listeners from this part of north-west England. Our research questions are framed by a number of issues which combine to suggest that the nurse~square merger in this region is a fruitful domain in which to explore salience. Firstly, the accent of Liverpool, one of two urban centres in the north-west of England (population: ~450,000), is one of the most recognisable accents in Britain (Montgomery Reference Montgomery2007; Leach & Watson in prep). It is also amongst the most negatively stereotyped. This has been found consistently in language attitude research over more than three decades (e.g. Giles & Powesland Reference Giles and Powesland1975, Coupland & Bishop Reference Coupland and Bishop2007) and it is partly the stigma of the Liverpool accent, Montgomery (Reference Montgomery2007) argues, which helps listeners recognise it. Another important contributing factor is that the Liverpool accent has a number of phonological features which distinguish it from other nearby accents. One of these features relates to the nurse~square merger, which in Liverpool is realised as a mid front vowel [ɛː] (resulting in her and hair = [hɛː]), but which elsewhere, such as in nearby St Helens, just 20km east of Liverpool, is realised as a mid central vowel [ɜː] (resulting in her and hair = [hɜː]). We know that the Liverpool accent is stigmatised as a whole but we know little about which individual linguistic features are socially meaningful, so our first question is (1) Is the merger to a front vowel evaluated differently by listeners from the merger to a central vowel? The phonetic variation we see for nurse~square in this region leads to a situation in which Liverpool and St Helens both have a nurse~square vowel that is typical of a fairly standard Northern English accent, but the standard vowel in each locality belongs to a different lexical set – either nurse (for which St Helens has standard [ɜː] and Liverpool has non-standard [ɛː]) or square (for which Liverpool has [ɛː], which is the northern English standard, and St Helens has non-standard [ɜː]). Given this fact, we might expect listeners from each locality to have different reactions to nurse and square words, even if words in each set have the same merged vowel. Our second question, then, is (2) Do listeners react to nurse words and square words in the same way? To be able to answer this question, we need to be able to show not only that listeners are reacting to the audio stimuli, but also when their reaction takes place. This takes us to our final question, which is (3) Can listeners' real-time reactions to the audio stimuli be correlated with instances of nurse~square?
This article addresses these questions by reporting on an experimental investigation which explores listeners' responses to merged front and central variants of nurse~square. It is structured as follows. In section 2, we consider some previous literature on linguistic salience in general and the salience of phonological mergers in particular. Section 3 introduces the experimental methodology, two important aspects of which, described in section 3.2, are (i) the design of the technique used to collect real-time responses from listeners, which was deployed via a website, and (ii) the creation of the audio data used as stimuli. Our results are then presented in section 4, in two parts. In section 4.1, we discuss listeners' general responses to nurse~square by examining their overall reactions to the stimuli. In section 4.2 we consider whether listeners are reacting at the same time as the nurse~square vowels in the stimuli, by testing the correlation between the time at which each vowel occurs and the time each listener makes an evaluative judgement. Finally, in section 5, we discuss the implications of these results, both for our understanding of the salience of the nurse~square merger and for our understanding of salience in general.
2 Salience and mergers
There exists a long and complex discussion of the concept of salience in linguistics (see Trudgill Reference Trudgill1986; and Kerswill & Williams Reference Kerswill, Williams, Jones and Esch2002 for an overview). Much of this literature attempts to provide lists of criteria which can be used to establish whether a linguistic unit can be considered salient – that is, if the linguistic unit fulfils conditions x, y and z, then it is said to be ‘salient’. There are several problems with this check-list approach to salience, however. One problem, dealt with extensively by Kerswill & Williams (Reference Kerswill, Williams, Jones and Esch2002), is that of circularity. For example, in Trudgill's (Reference Trudgill1986) five-point list of conditions, one criterion is that the variable or linguistic unit can be said to be salient if it is undergoing change. This is problematic because Trudgill (Reference Trudgill1986) also invokes salience as an explanation of language change. Another difficulty is that the criteria themselves are often vague and, in part because of this, are difficult to implement. For example, one recurrent suggestion is that salient variants are those that are ‘phonetically radically different’ (Trudgill Reference Trudgill1986: 11) or ‘exhibiting acoustic extremes’ (Podesva Reference Podesva2006: 18). These statements are intuitively appealing but they are difficult to put into practice – how should radically different or acoustically extreme be quantified? Where is the division between radically different variants and simply different variants of a variable? Any effort to impose this type of division relies on the judgement of the researcher, which is precisely the situation that such lists of criteria were designed to avoid. Furthermore, these lists often offer competing and contradictory statements. Bardovi-Harlig (Reference Bardovi-Harlig1987) claims that high frequency of occurrence is a necessary prerequisite for salience (indeed, the claim is that high frequency is the only prerequisite which means that in this work, salience is entirely equated with frequency) but Podesva (Reference Podesva2006) suggests that frequency of occurrence is inversely correlated with salience (i.e. low-frequency items are salient). Finally, efforts to test whether the criteria proposed for salience are borne out in studies of language variation and change (e.g. Kerswill & Williams Reference Kerswill, Williams, Jones and Esch2002; Smith et al. Reference Smith, Durham and Fortune2007) have produced conflicting results: some variables follow the expected pattern and appear to be salient to most members of the speech community (typically because there is evidence of conscious awareness of the form through style shifting) but other variables which fulfil the criteria show no evidence of style shifting and so do not behave as expected. Kerswill & Williams (Reference Kerswill, Williams, Jones and Esch2002: 105) conclude: ‘Thus, there are no necessary and sufficient conditions which must be met in order for a linguistic feature to be salient – barring the obvious one that differences between its presence and absence must be noticeable in a psychoacoustic sense.’
In the studies which have attempted to test the predicted salience of a linguistic unit, a wide range of variable phenomena have been included (changes in vowel quality, consonantal variants, morphosyntactic variants and discourse markers were considered in both Kerswill & Williams Reference Kerswill, Williams, Jones and Esch2002 and Smith et al. Reference Smith, Durham and Fortune2007). However, neither directly examines the salience of phonological mergers. This may, in part, be due to Labov's seminal claim that mergers do not attract social evaluation and so exist below the level of conscious awareness (Labov Reference Labov2001: 27). However, other recent work on mergers-in-progress has provided evidence to the contrary. In work on the near~square merger in New Zealand English, Warren & Hay (Reference Warren, Hay, Fletcher-Flinn and Haberman2006: 111) reproduce a letter to the editor of the New Zealand Listener, a current affairs magazine, in which the author complains of hearing too many people saying that they are flying with ‘Ear New Zealand’ (rather than ‘Air New Zealand’). Of course, from this type of evidence alone we cannot disentangle whether people are simply observing that two words sound the same (in this case: ear, air) from whether they are aware of the more general phonological merger. Baranowski (this volume) includes excerpts from interviews with informants in Charleston, South Carolina, which show not only an awareness that words like pin and pen are often pronounced with the same vowel in this community (the pin~pen merger), but so too are other words (the examples given are him and hem (Baranowski this volume: 287)). This is taken as evidence that speakers are not only aware that certain words sound the same, but that some speakers are able to generalise to a number of other words, suggesting that they are aware of both a change in vowel quality at the word level and also the merging of the vowel phoneme. Thus, these speakers may be aware of both the phonetic and phonological consequences of the merger.
There is evidence that the regionally restricted nurse~square merger in north-west England, introduced above, is also directly commented upon. Kerswill & Watson (Reference Kerswill, Williams, Jones and Esch2007) show that speakers from this region ‘perform’ this merger in writing in online blogs and other social media, and Honeybone & Watson (in press) demonstrate that the nurse~square merger is represented in dialect respellings in so-called ‘folk dictionaries’ that use semi-phonetic spellings to try to portray the Liverpool accent. Indeed, of all the respellings in the dictionaries which relate to vocalic features, it is nurse~square words which are respelled most often. This leads Honeybone & Watson (in press) to conclude that nurse~square, in Liverpool at least, is a salient feature.
In the examples discussed above, the salience of each merger was determined either by observing overt comment about the feature in sociolinguistic interviews, websites and printed media or by witnessing style shifting and class stratification with respect to the feature. This later method has been used to indicate that the linguistic feature is a ‘marker’ in the Labovian sense (i.e. if the linguistic feature is salient enough to mark or correlate with some social characteristic in the community then speakers will be able to modify their linguistic output and exhibit a certain degree of control over such forms as evidenced by style shifting). However, these methods suffer from the philosophical problem that the lack of evidence is not evidence of absence. In other words, if speakers do not modify their linguistic behaviour in some way (i.e. they do not style shift or offer overt commentary), this cannot necessarily be taken as evidence of the lack of salience, only of a lack of the behaviours often associated with salience. In order to more explicitly test the extent to which the nurse~square merger is salient, it will be fruitful to move beyond these techniques and elicit reactions in a more controlled experimental setting.
3 Methods
3.1 Previous approaches
The vast majority of studies which have attempted to elicit listener reactions to audio stimuli have used a version of the Matched Guise Technique (hereafter MGT; Lambert et al. Reference Lambert, Hodgson, Gardner and Fillenbaum1960). In its original format, the MGT required that a single bilingual speaker be recorded producing the same linguistic content in two guises. Listeners were told that they were listening to two different speakers, and were asked to evaluate these two speakers according to a range of personality traits. Because the content and other paralinguistic cues were kept (relatively) constant, any differences in the evaluation of these guises could be attributed to covert reactions towards these linguistic varieties.
One problem with this approach is that ‘it can be difficult to establish which aspects of the speech trigger which aspects of the evaluation’ (Campbell-Kibler Reference Campbell-Kibler2006: 64). In an effort to consider which specific linguistic features listeners might be reacting to (rather than simply considering reactions to whole varieties), more recent studies have coupled the methods of the MGT with manipulation of the speech signal to create pseudo-matched guises. One of the most extensive studies of this kind used recordings of spontaneous speech and created paired stimuli which were identical in all respects except one: the realisation of the (ING) variable (Campbell-Kibler Reference Campbell-Kibler2006, Reference Campbell-Kibler2008). This study used a ‘cut and paste’ approach in which variants of the (ING) variable ([ɪn] and [ɪŋ]) were inserted into original recordings to create matched pairs of recordings, identical except that the (ING) tokens were either all [ɪn] or all [ɪŋ]. Listeners were then asked to evaluate the speech stimuli using a semantic differential scale questionnaire. The results of this study have shown that very subtle linguistic differences (in this case, relating only to a single variable) can be enough to trigger differences in listener perceptions and evaluative reactions.
In a recent extension of this study, Labov et al. (Reference Labov, Ash, Ravindranath, Weldon, Baranowski and Nagy2011) created a similar set of matched stimuli using a similar cut and paste method, only this time they varied the frequency of the non-standard variant of (ING) so that, for example, some listeners might hear 70 per cent [ɪn] and others might hear 30 per cent [ɪn]. Furthermore, they did not simply provide subjects with traditional semantic differential questionnaires. Instead, in one of their experiments, subjects used a movable slider to record their reactions as they listened to the audio stimuli. This slider was available via a PC monitor and could be controlled using a computer mouse. One advantage to this technique is that it allows a more fine-grained overall evaluation of the stimuli. Typically the semantic differential scale used in a MGT experiment only allows listeners to evaluate the audio stimuli on a scale of e.g. 1–7; in Labov et al. (Reference Labov, Ash, Ravindranath, Weldon, Baranowski and Nagy2011), the scale on which the slider was based (which was invisible to the participants) ranged from 0 to 1000. Another advantage of this technique is that the movement of the slider can be recorded over time. The introduction of a movable slider means that we can not only witness that listeners react differently to subtly different audio stimuli, we can also record when this reaction takes place. This means that if groups of listeners react to the audio stimuli at similar times and if these reactions can be correlated with the occurrence of a particular linguistic unit, we may be able to interpret this as evidence for the salience of that unit. Labov et al. (Reference Labov, Ash, Ravindranath, Weldon, Baranowski and Nagy2011) provide an illustrative example from one listener but do not fully pursue this line of enquiry. To test this idea more explicitly, we developed a website designed to collect evaluative reactions to audio stimuli and, crucially, to record the time at which these evaluative reactions take place.Footnote 3
3.2 Experiment design: the website and the audio stimuli
The basic requirement for the experiment was that we needed to be able to capture listeners' evaluative responses in real-time, as they listened to audio stimuli. To achieve this, we used a technique which included a horizontal slider, similar to that used by Labov et al. (Reference Labov, Ash, Ravindranath, Weldon, Baranowski and Nagy2011), but we deployed this methodology via a website rather than in a laboratory setting. The website consisted of a series of pages navigable with a next button, positioned at the bottom of each page. The first screen explained that the experiment was intended to collect reactions towards accents, and participants were asked to tick a box to consent to take part in the study before being allowed to progress to the next page. On the second page, participants were asked for basic social and demographic information. The third page included an audio clip explaining the task to follow. This provided training for the participants in how to interact with the website. Participants were blocked from progressing to the experiment proper until the explanatory audio clip had ended, partly to ensure that all subjects had received the same instructions and partly to ensure that participants had switched on their computer audio capabilities before the experiment began. For further discussion of the website, see Watson & Clark (forthcoming).
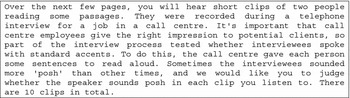
When the experiment began, listeners heard a series of audio clips, each one lasting between 30 and 40 seconds, from two speakers. In order to try to create a credible scenario for the listeners, they were told that they would hear two people taking part in a telephone interview for a job in a call centre. In the instructions for the tasks, listeners were told that: ‘Sometimes the interviewees sounded more “posh” than other times, and we would like you to judge whether the speaker sounds posh in each clip you listen to.’ A fuller set of instructions, presented to each listener, can be found in figure 2.
The instructions that all listeners received on the experiment website, before they proceeded to the listening task

In most existing work on language attitudes, the various attributes assigned for evaluation (friendliness, education, intelligence, kindness etc.) can be summarised by two underlying dimensions: solidarity and status (Garrett et al. Reference Garrett, Nikolas and Williams2003). We chose the label ‘posh’ in an effort to capture the underlying dimension of status in a way that could be easily understood by the participants; in Britain at least, the label ‘posh’ is very clearly associated with descriptions of high status. In the pilot experiment (Watson & Clark forthcoming), listeners provided more extreme evaluative reactions to the status dimension than to the solidarity dimension and so this study is limited to an investigation of the status dimension.
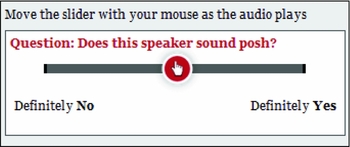
As listeners heard each clip, they were asked to react to the question ‘Does this speaker sound posh?’ and move a horizontal slider left (representing ‘Definitely No’) or right (representing ‘Definitely Yes’) when they made their judgement. The slider is shown in figure 3.
Movable slider to record evaluative reactions throughout duration of the audio stimuli. The scale behind the slider ranged from 0 to 100 (with the starting point of 50) and the position of the slider was recorded every second

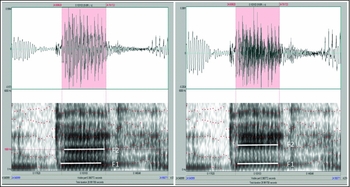
There were ten audio clips in total. Four of the extracts came from a female speaker of Scottish English, who did not have a nurse~square merger. These were included simply as distracter voices and reactions to these clips are not analysed here. The main stimuli data (six audio clips) were provided by a male speaker in his 20s from a nurse~square merging locality in the north-west of England. He is phonetically trained and had good control over his pronunciation, and so was able to consciously avoid using a number of other non-standard phonological features like h-dropping, t-glottalling and th-fronting. He also avoided using reduced/weak vowels in the nurse~square lexical sets. The result was a relatively standard, pan-northern English accent with a nurse~square merger. The fact that the only non-standard variants in these recordings were instances of nurse and square did not result in an unnatural set of stimuli – even middle-class speakers from this region who use standard English grammar and very few non-standard phonological features often have this merger. This speaker naturally used a central nurse~square vowel, and this was used as one of our two guises. To create a matched-guise, the original nurse~square vowels were manipulated by increasing the second vowel formant, to represent fronting, using AkustykFootnote 4 for PRAAT which utilises LPC analysis/re-synthesis. The difference in vowel quality between the two guises can be seen in figure 4. An example of an unmanipulated, central nurse vowel is on the left of figure 4 and the matched, manipulated, more front nurse counterpart is on the right. The original central vowels were also resynthesised, without changing the formant values, to compensate for any other potential changes to the signal that might result from the LPC analysis.Footnote 5
Central (left) and fronted (right) nurse vowels, represented tokens from Guise 1 and Guise 2 respectively

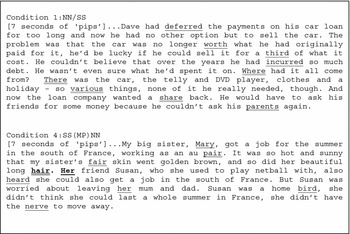
In order to control the occurrence of nurse~square words in the audio stimuli as much as possible, the guises consisted of six specially constructed passages.Footnote 6 Four passages were constructed to vary the order in which listeners encountered nurse and square words. Specifically, in the clip which we call Condition 1: NN/SS, listeners heard an extract with several nurse words followed by several square words (embedded in a larger paragraph; see figure 5 for the full text of this condition) and in the clip we call Condition 2: SS/NN, listeners heard several square words followed by several nurse words (again, embedded in a larger paragraph). Every effort was made to ensure that nurse and square words occurred with at least 2 seconds between each instance; in most cases, the gap between instances was closer to 5 seconds. In the next two clips, which we call Condition 3: NN(MP)SS and Condition 4: SS(MP)NN, subjects listened to audio clips which were similar in structure to those in Conditions 1 (nurse before square) and 2 (square before nurse), only this time the last instance of one lexical set and the first instance of the next lexical set formed a minimal pair, and the two words were adjacent to each other near the mid-point of the clip. This condition was included in order to examine whether the juxtaposition of nurse and square words encouraged listeners' reactions by directing their attention to the fact that each set had the same vowel. Figure 5 presents the text from Condition 4: SS(MP)NN. In the final two clips, which we do not analyse in detail in this article due to space restrictions, we included just one lexical set throughout but gradually raised F2 in those words by 50Hz increments as the clip progressed. Each of these audio clips (six main stimuli and four distracter stimuli) began with 7 seconds of introductory pips designed to focus participants’ attention on the task at hand.Footnote 7
Full text from Condition 1: NN/SS (top) and Condition 4: SS(MP)NN (bottom). nurse words are single underlined and square words are double underlined. In Condition 4, the adjacent square~nurse words which form a minimal pair are highlighted in bold

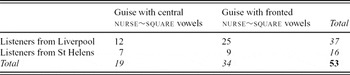
Two versions of the website were live simultaneously on the internet – one with fronted nurse~square tokens (typical of speakers from Liverpool) and one with centralised nurse~square tokens (typical of speakers from St Helens). Participants from Liverpool and St Helens were recruited via social networking sites (e.g. Facebook and Twitter), and were randomly directed to respond to either the central guise or the fronted guise. In total, 53 participants provided usable responses to this experiment (an additional 7 were discarded because they failed to include demographic information). Table 1 provides information about how many listeners from each locality listened to each guise. More listeners from Liverpool took part; this is perhaps to be expected since the population of Liverpool is four times larger than the population of St Helens.
Listeners from Liverpool and St Helens, listening to the front and central nurse~square guises

4 Results
4.1 How is the status of a speaker with the nurse~square merger evaluated?
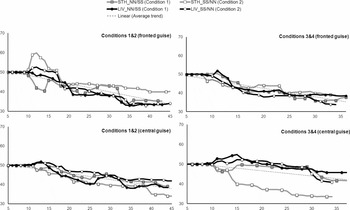
Figure 6 presents the overall reactions towards these matched guises by listeners from Liverpool (represented by the black lines with circles) and St Helens (represented by the gray lines with squares). Mean reactions over time towards the guise with fronted vowels are charted across time in the upper pane of figure 6, and mean reactions over time towards the guise with central vowels are charted in the lower pane. For each guise, the condition in which nurse words appeared before square words (NN/SS) is presented with filled shapes, and the condition in which square came before nurse (SS/NN) is presented with unfilled shapes. In each graph, time is plotted in seconds along the x-axis beginning at 5 (since there were 7 seconds of introductory pips before the audio began). Evaluative response is plotted along the y-axis, where higher values represent a more positive evaluation on the status dimension. Reactions to Condition 1: NN/SS and Condition 2: SS/NN (with no minimal pair) are plotted on the left, and reactions to Condition 3: NN(MP)SS and Condition 4: SS(MP)NN (with the minimal pair) are plotted on the right.
Mean group reactions to both guises in Conditions 1–4 by each listener group. Liverpool listeners are identified by black lines with circles, St Helens listeners by grey lines with squares. Filled shapes represent the nurse before square condition, empty shapes represent the square before nurse condition. In each graph, the x-axis shows time (in seconds) and the y-axis shows the rating of the accent (on a scale of 1 [ = not posh] to 100 [ = posh])

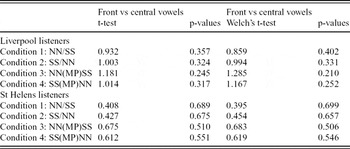
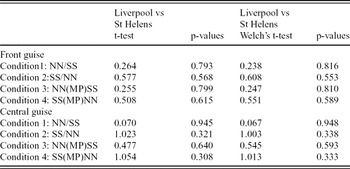
The first thing to notice about the evaluative reactions is that although the scale behind the slider ranged from 0 to 100, mean reactions across the groups clustered around the middle of this range. This is perhaps to be expected, since listeners were not hearing a very broad regional variety, which might have encouraged stronger reactions on the status dimension, but instead were presented with a fairly standard northern English accent which was mostly unremarkable, with the exception of the nurse~square merger. Nevertheless, in all cases, the mean trend line (the dotted line in each graph) always slopes downwards. That is, the end point of the slider never ends above the starting (neutral) point of 50. This suggests that in all cases, the guises were evaluated rather negatively on the status dimension (i.e. neither guise is considered ‘posh’). Furthermore, neither guise (with either a front or central nurse~square merged vowel) is evaluated significantly more favourably than the other. Parametric and non-parametric tests (unpaired t-tests and Welch t-tests, respectively) found no significant differences in the end point of the slider, regardless of whether the vowel was front or central or whether the listeners were from Lancashire or Liverpool (see tables 2 and 3).
Comparing mean evaluations of both guises (front and central vowels). No significant differences found

Comparing mean evaluations of both groups (Liverpool and St Helens) towards the same guise. No significant differences found

There was, however, a difference in evaluative behaviour between the main guises and the Scottish English speaker used as the distracter (not shown in figure 6). Although there was no difference in mean reaction towards the Scottish English speaker compared with the guise in, for example, the fronted condition (t-test: t = 0.095, p = 0.9215), there was a significant difference in variance across both guises. The range of variation in responses towards the Scottish English guise spanned 78 points on the slider scale, which was greater than the range of variation in responses towards the Northern English guise, even when using fronted nurse~square vowels (42 points on the slider scale). An F-test reveals that the difference in variance across these two data sets is significant (p = 0.02). This difference is noteworthy because it shows that listeners were able and willing to use a wider range of evaluative responses but that for the nurse~square stimuli data, regardless of the quality of the target vowel, they chose not to. Although there were no significant differences between the end-point of the slider across listener groups and/or guises, there are clearly some differences in evaluative reactions during the experiment that simple t-tests cannot capture. For instance, in Condition 2 (fronted guise), both listener groups reacted positively between 10 and 15 seconds but this early positive evaluation is adjusted to a negative evaluation towards the end of the clip. The general slope of the evaluative responses suggests that listeners from Liverpool and St Helens do not view speakers with a nurse~square merger, either with a front or central vowel, particularly positively, at least according to mean scores and with respect to the status dimension. However, to examine these reactions in more detail, we need to consider the specific points in time at which reactions to these guises change.
4.2 Do listeners react when they hear a nurse~square vowel?
There are a number of difficulties in assessing this question. First, it is not immediately clear where statistically significant reactions take place. For instance, consider again the visual representation of the data presented in figure 6. It is easy to compare the values at the end points of each line and consider whether, overall, listeners found Condition 1: NN/SS or Condition 2: SS/NN more ‘posh’. It is not so easy to infer whether the reactions elicited at a single point in time are significantly different from reactions elicited at a previous point in time. For example, listeners from St Helens reacted negatively to Condition 1: NN/SS at around 10 seconds into the audio, in the front vowel guise, where we see the mean group reaction shift from a value of 50 to a value of 40. Is this change a statistically significant one? A second problem is that the most important changes are likely to be those that numerous people agree on. The mean patterns presented in figure 6 could be hiding important individual behaviour and/or could be being skewed by the behaviour of outliers. In order to tackle these problems, it is necessary to move beyond trying to assess the general patterns using mean calculations and a simple visual inspection of the curve. To do this, we employ a statistical technique called change point analysis.
4.2.1 Identifying change points and clusters
Change point analysis (CPA) can be used to identify the points at which the statistical properties of a time-ordered data set change. CPA has been used to explore changes in mean, variance and regression coefficient in data from a range of disciplines such as bioinformatics (Lio & Vannucci Reference Lio and Vannucci2000), network and traffic analyses (Kwon et al. Reference Kwon, Ko, Vannucci, Reddy and Kim2006), climatology (Reeves et al. Reference Reeves, Chen, Wang, Lund and QiQi2007), econometrics (Perron & Yabu Reference Perron and Yabu2009) and engineering (Killick et al. Reference Killick, Eckley, Ewans and Jonathan2010). There are a number of different CPA methods (see Killick & Eckley (under review) for an overview), and here we adopt a new technique known as Pruned Exact Linear Time (PELT). To find change points in a data set, first the PELT detection method is applied to the whole time series. In our case, ‘a whole time series’ represents the responses from a single listener to a single condition. If no change points are detected during this period, the calculation stops. If change points are detected, the data are partitioned and the algorithm is then applied to each partition independently. This procedure is iterated until no further change points are detected (Killick et al. Reference Killick, Eckley, Ewans and Jonathan2010). These calculations can be carried out using the changepoint package available in the R environment. After carrying out CPA calculations for the results from each condition for each listener (6 conditions × 53 listeners = 318 CPAs), we were able to assess where the statistically relevant shifts in the slider occur for each individual listener.
The next problem is to consider whether these change points cluster together across groups of listeners. In other words, are there points in time at which greater than chance numbers of listeners shifted the slider simultaneously? There are a number of different techniques available for finding clusters in a data set like this and, because each one comes with its own strengths and weaknesses, we use a combination of two in an attempt to be conservative. Initially, we looked for clusters using the kmeans clustering algorithm (we call this method 1). This method partitions data points into clusters so that each observation belongs to the cluster with the nearest mean. Because the average number of reactions/shifts of the slider per listener was 3.5, we looked for four clusters in the data for each audio stimulus. Thus, the kmeans clustering algorithm divided the data returned by the CPA for each group of listeners into four clusters and returned the mean value for each cluster. This is a useful heuristic, but there are problems when dealing with mean values in this type of analysis. For example, if ten listeners shifted the slider at 15 seconds into the audio clip and another ten listeners shifted the slider at 17 seconds, we would end up with a mean reaction time of 16 seconds, and yet nobody in the group actually moved the slider at 16 seconds. To attempt to compensate for this, we allowed for an error-margin of 1 second on either side of the mean value and used this window of time (rather than the exact data point generated by the kmeans algorithm) when identifying potential change point clusters. Because of these potential problems, we also used a second method which involved identifying clusters of change points in the raw data too (we call this method 2). To do this, we identified 2-second time frames where the change points accounted for more than 10 per cent of all reactions across the whole group. For example, in response to the stimuli in Condition 2: SS/NN (for the front vowel guise), 63 significant change points were identified in total across the group of listeners from Liverpool. Eleven of these occurred between 10 and 11 seconds (= 17.5% of the total); 8 were between 17 and 18 seconds (= 12.5% of the total) and 8 were between 33 and 34 seconds (= 12.5% of the total). Since these three time points together account for 42.5 per cent of all change points for this sound clip, we interpret them as being meaningful clusters of responses. As a final control, we decided to take a conservative approach and considered only to have found a cluster of change points in cases where the outputs from both method 1 and method 2 overlapped. In the rest of our discussion, we assume that clusters identified in this way are unlikely to be the result of chance.
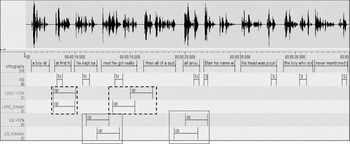
Figure 7 is a screen shot of one of the stimulus clips (Condition 3: NN(MP)SS, front vowel guise), transcribed and annotated in ELAN.Footnote 8 We will use this example in the first instance to illustrate the procedure of identifying change point clusters. The first tier below the visible waveform shows part of the orthographic transcription of the clip. In order to show the full 35 seconds of audio, the orthographic tier has been truncated. The second tier, labelled NS, marks exactly where the nurse (coded N) or square (coded S) words appeared in the clip. In this condition, a number of nurse words appeared before a number of square words, with a nurse~square minimal pair roughly half way through the audio. The change points identified using both methods are marked in the tiers below (those beginning ‘LANC’ show the results from the group of St Helens listeners and those beginning ‘LIV’ show the results from the group of Liverpool listeners). The points at which there is agreement between both methods of identifying clusters are highlighted in figure 7 with a dashed outline (the heavier dashed line shows agreement between both methods of identifying change points in the St Helens listeners' data and the lighter dashed line shows agreement between both methods of identifying change points in the data from Liverpool listeners). In this example, we can see two points in time where reactions from the St Helens listeners cluster together and two places where reactions from Liverpool listeners cluster together. In order to simplify the analysis, the degree of overlap between the clusters was not considered here (although this may prove to be a fruitful line of enquiry in future).
Condition 3: NN(MP)SS, front vowel guise, with annotations added in ELAN

4.2.2 Do change points correlate with instances of nurse or square?
Before we can finally engage with this question, some further discussion is warranted concerning how we might decide if a cluster is ‘close enough’ to a nurse~square word to count as a sensible correspondence. First, it was necessary to consider the participants’ likely reaction time to the audio stimulus. While the literature from psychology and psycholinguistics is full of studies exploring human reaction time, most of these have been conducted in highly controlled experimental settings where reaction time is measured towards only one stimulus at once (e.g. listeners may be exposed to an audio stimulus of a word-shaped sound and be asked to react in a particular way depending on whether they think the word is a real word or a nonsense word). In our study, listeners were taking part via the internet and so we had minimal control over the experimental setting. This means that any number of potentially confounding variables could have interfered with the listeners' reaction time such as fatigue, distraction (Welford Reference Welford and Welford1980), alcohol (Moskowitz & Fiorentino (Reference Moskowitz and Fiorentino2000), illness (Smith et al. Reference Smith, Brice, Leach, Tilley and Williamson2004) or even mild stimulant drugs such as caffeine (Lorist & Snel Reference Lorist and Snel1997). Furthermore, although listeners were instructed to move the slider whenever they felt that they wanted to, we have no way of knowing whether they took those instructions literally and so moved the slider at exactly the point in time at which their attitudes changed or whether they moved the slider a short while after their attitudes changed. Finally, subjects in this study were not merely exposed to a single word in isolation; they were exposed to a stream of speech and so were parsing the content of the audio as well as making judgements about the speaker's social status. This additional cognitive effort may well have increased reaction times. For these reasons, we allowed a fairly liberal interpretation of the relationship between a change point cluster and an instance of nurse or square and included instances with a 2-second window between the appearance of the nurse or square word and the movement of the slider. That is, we have interpreted the data as showing a potential relationship between a cluster of change points and an instance of nurse or square if the nurse or square word fell within the boundaries of the change point or less than 2 seconds before the change point occurred.
To return to the question at the beginning of this section: do these clusters correspond to instances of nurse~square words? The first thing to notice about the example in figure 7 is that all change points coincide with instances of the nurse lexical set. The second thing to notice is that St Helens listeners seem to respond more quickly than Liverpool listeners. Why might this be? In this condition the nurse vowel appears first in the sequence, before the sequence of square words. Since this is the front vowel guise, listeners hear nurse words with non-standard front variants at the beginning of the audio clip, and seem to make an early judgement. One explanation for the slightly different reactions between St Helens and Liverpool listeners could be that since the front vowel is not the typical realisation in St Helens, listeners from this locality react more quickly than the Liverpool listeners, for whom the front nurse vowel could be considered less remarkable.
We followed similar steps to those described above for all other guises in the experiment. In total, 22 clusters of change points were identified across the four experimental conditions. If we adopt the admittedly rather liberal interpretation of the potential relationship between a change point cluster and an instance of nurse or square described above (i.e. if we count instances where the change point cluster falls up to 2 seconds after the nurse or square word) then 20 of these can be said to correlate with an instance of either nurse or square. Even if we adopt a stricter interpretation of the likely relationship between a cluster of change points and instances of nurse or square, and allow only instances where the change point cluster falls up to 1 second after an instance of nurse or square, this number remains high, at 16 clusters. Thus, a fairly high proportion of identified change points cluster at or around the same time as an occurrence of nurse or square. We interpret this as evidence that listeners are reacting to the nurse/square vowel.
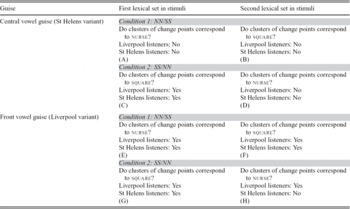
The results from Condition 1: NN/SS and Condition 2: SS/NN, in both central and front guises, are summarised in table 4. Condition 3: NN(MP)SS and Condition 4: SS(MP)NN are dealt with separately in section 4.2.3. In table 4, the columns titled ‘First. . .’ and ‘Second lexical set in stimuli’ serve as a reminder of the order in which nurse and square words were presented to the listeners. For each group of listeners in each condition, the answer to the question ‘Do clusters of change points correspond to nurse/square?’ is ‘Yes’ if there were significant clusters of change points identified and correlated with the relevant vowels, using the more liberal 2-second window described above, and ‘No’ if there were either no clear clusters of change points or no correlations between the change points and the relevant tokens. We have highlighted the cells in table 4 with the labels (A)-(H) to facilitate the presentation of the discussion below and in section 5.1, however we do not discuss the results in the order (A) to (H); rather we deal with the main themes as they emerge in table 4.
Correspondence of nurse~square words and clusters of change points, for each speaker group in two guises

A number of observations are notable. We state them here, and then discuss what they can tell us about salience in section 5. In response to the central guise, we see no reaction to the nurse vowel (i.e. the Standard British English vowel), by either Liverpool or St Helens listeners, regardless of whether it precedes or follows square (indicated by (A) and (D) in table 4). We do, however, see a reaction from both groups of listeners to central square (the non-standard St Helens vowel), when it appears before nurse (see (C) in table 4). Likewise, in the front guise, listeners' respond to nurse (the non-standard Liverpool vowel) when it appears before square ((E) in table 4). Unlike when it occurs before (standard) nurse in the central guise ((C) in table 4), we see no reaction to central square (non-standard St Helens vowel) when it appears later in the clip ((B) in table 4). In the front guise, listeners from both Liverpool and St Helens react to square (pan Northern English vowel) regardless of whether it precedes or follows nurse ((F) and (G) in table 4). So far, listeners from Liverpool and St Helens have reacted to all conditions in the same way. For nurse in the front guise (the non-standard Liverpool vowel, (H) in table 4), this is not the case. Here, only the Liverpool listeners react when nurse appears after square.
4.2.3 Do change points correlate with instances of nurse – square minimal pairs?
We hypothesised that including a minimal pair in Condition 3: NN(MP)SS and Condition 4: SS(MP)NN might promote reactions to nurse~square. When we identified clusters of relevant change points using the same method as above, i.e. using both the kmeans cluster analysis and the >10 per cent ratio technique, there were no clusters of change points at the same point in time as the minimal pairs. The kmeans cluster algorithm alone did identify clusters of change points at or just after the minimal pairs from both Liverpool and St Helens listeners, but since this is less robust, we do not wish to lend much weight to this result. Listeners do not seem to be reacting specifically to the minimal pair. However, for one condition in the front guise, we do see different behaviour from the St Helens listeners in Condition 4 (with the minimal pair) than in Condition 2 (without the minimal pair). In the front guise Condition 2, discussed above, Liverpool listeners respond to front nurse when it occurs both before and after square, but St Helens listeners only react when it occurs early in the clip ((E) and (H) in table 4 above). In the similar minimal pair condition, however, St Helens listeners react to front nurse when it occurs before and after square, matching the patterns of the Liverpool listeners in the non-minimal pair condition.
5 Discussion and implications
What do the results presented above tell us about the salience of nurse~square in England's north-west and about salience in general? In this section we address each of these issues in turn.
5.1 The perception of nurse and square
In section 4.2, we demonstrated that listeners did not react to central nurse (cells (A) and (D) in table 4), but did react to central square and front nurse, particularly when they appeared first in the audio clip ((C) and (E) respectively). This is precisely what we might expect given what we know about the linguistic situation in the region. Central nurse is the realisation found in standard British English, and since in other respects the speaker in the audio clip has a fairly standard northern English accent, the use of the central nurse vowel would most likely be seen as unremarkable.Footnote 9 The central square and front nurse vowels, on the other hand, are not features found in standard British English, and so we might expect these features to be salient. The fact that they generate listener reactions is confirmation of this.
In the central guise, listeners responded to square when it appeared before but not after nurse ((C) and (B) respectively). Why might listeners react to the non-standard square variant in one condition but not the other? Perhaps listeners react early to the audio stimuli in general, particularly when they are specifically asked to make a judgement about a speaker's status. This may be part of the answer, but cannot be the only explanation, since we never see a reaction to central nurse even at the beginning of the audio clip and the Liverpool listeners respond to front nurse even at the end of the clip (a point to which we return below). It may also be that once the listeners hear central nurse, which is a cue that the speaker has a relatively standard accent, the central square vowel, occurring later, is not salient enough to ‘change their mind’ about the speaker's status. This is compatible with Campbell-Kibler's work which shows that American listeners' perceptions of non-standard (ING) are not enough to override their pre-existing opinions of speakers with General American accents (2008: 148). Unlike with working-class guises, middle-class guises with non-standard [ɪn] are not evaluated differently from middle class guises with standard [ɪŋ]. Campbell-Kibler argues that middle-class General American speakers are ‘bullet-proof’ with respect to the potential downgrading effect of non-standard (ING) because of their otherwise standard accents. In our data, it is possible that the presence of the standard nurse vowel early in the audio signal has a similar ‘bullet-proofing’ effect when it comes to the subsequent appearance of non-standard square. We can only be tentative about this possibility, so it remains an open question.
In the front guise, we saw that Liverpool and St Helens listeners reacted to square, regardless of whether it preceded or followed nurse ((G) and (F) in table 4). We included front square to try to approximate a supralocal standard, with the hypothesis that since it is found across the north of England, unlike more regionally restricted central square, listeners might not react to it. However, this hypothesis was not borne out. Listeners’ consistent reactions to this vowel suggest it is salient. Although the front monophthong [ɛː] is indeed a northern English realisation of square, it is the diphthong, [ɛə], which is typically found in standard British English. Unlike with nurse, where the standard and northern variants are the same, it is perhaps more likely to be the diphthong and not the front monophthong for square which indexes ‘posh’. Another issue is that the precise quality of square has been said to be variable in the region. De Lyon (Reference De Lyon1981) suggests that there are at least eighteen different realisations for the vowel in this lexical set in Liverpool alone, occurring all over the front mid section of the vowel space. The full facts of exactly how this fine-grained phonetic variation patterns across this region are not known, but it should be clear that any such subtle variation was not faithfully represented in our stimuli, so perhaps listeners are reacting to the square tokens because of this. We are currently exploring patterns in the production of nurse~square vowels in Liverpool and Lancashire, to uncover whether the fine-grained phonetic detail reported elsewhere is sociolinguistically stratified across the region (Watson Reference Watson, Darbyshire and Clarket al. in prep).
Finally, we saw that while listeners respond to non-standard (central) square only when it occurs at the beginning of the clip (C), Liverpool listeners react to non-standard (front) nurse both at the beginning and the end of the clip. Why should listeners respond differently to these sets if both represent non-standard variants? One possible reason is related to lexical frequency: nurse words are more frequent than square words (nurse is over three times as common as square in both the Canterbury Corpus (Gordon et al. Reference Gordon, Maclagan, Hay, Beal, Corrigan and Moisl2007) and the Origins of Liverpool English CorpusFootnote 10). In section 2, we discussed the potential role of lexical frequency as a contributing factor in the salience of phonological variables. However, we also saw that there is conflicting evidence in the literature with claims that either high lexical frequency (Bardovi-Harlig Reference Bardovi-Harlig1987) or low lexical frequency (Podesva Reference Podesva2006) can contribute to a variant's salience. It is therefore not clear that nurse is necessarily more salient simply because it is more frequent than square. However, one other factor does point in this direction. In section 4 above, we showed that St Helens listeners gave different responses in the minimal pair condition than in the non minimal-pair condition. In particular, St Helens listeners reacted to front nurse at the end of the clip after they had been presented with a square–nurse minimal pair. They did not, however, react to central square in either the minimal pair condition or the non minimal pair condition. While perhaps inconclusive, this suggests that front nurse may indeed be more salient than central square.
In summary, while evaluative reactions to the guises with the nurse~square merger are negative overall, the extent to which the reactions correlate with instances of nurse and square is dependent upon the complex relationship between the listeners' experiences of these vowels, including their qualities, the context in which they appear and other potentially confounding factors such as the frequency of the word and the social indexicality associated with the variants.
5.2 Salience
Throughout this article, we have been trying to understand more about listeners' perceptions of the nurse~square merger. In doing so, we have considered the notion of salience. In sociophonetics, we have become used to thinking about salience as if it were a property of a particular phonological variable. For example, in Labov's early work (Reference Labov1972) he characterised sociolinguistic variables into three main types and suggested that indicators, markers and stereotypes have different levels of salience (speakers perform style shifting with markers and stereotypes but not with indicators, and stereotypes are overtly commented on in the community). More recently, attention has been paid to the characteristics thought to be important when considering whether a particular variant is salient. We introduced this topic in section 2 by reviewing some common criteria for establishing salience. These criteria have been used with limited success, partly because generalising across different variables is difficult. Attempts at using the same list of criteria for different variables often leads to a conflict where in one case a condition (e.g. high lexical frequency) can promote salience and in another case, its opposite (e.g. low lexical frequency) can appear to do the same. Another problem with the criteria is that once the conditions are met, the variants are described as ‘having’ salience or ‘being’ salient; salience is described as a property which a linguistic unit is somehow endowed with. The results presented in this article suggest that the existing criteria used to determine salience need to be refined. In particular, we suggest that discussions of salience should take both the local social context and micro-linguistic context into account. By local social context, we mean the types of social context often already considered in the salience literature (e.g. the relationship between standard and non-standard forms in a speech community (Trudgill Reference Trudgill1986)). For example, our results show that no listener groups reacted at the time of standard central nurse but that there were reactions at the time of non-standard front nurse and central square. However, the linguistic context surrounding each instance of nurse~square was also important, and this is what we mean by micro-linguistic context. For example, listeners do not blindly react to the same non-standard variant whenever it occurs. We saw that listeners did not react to non-standard central square when it was preceded by standard central nurse. Also, some listeners were more likely to react to non-standard front nurse when they had recently heard an example of a square~nurse minimal pair. This suggests that linguistic units do not exist with salience ‘attached’ but rather that a particular linguistic feature can be more or less salient depending on both the local social context and the micro-linguistic context in which it appears.
6 Conclusion
The title of this article asks: how salient is the nurse~square merger? We have shown that speakers with this merger are not rated highly on the status dimension, and that listeners do not judge a merger to a front vowel differently from a merger to a central vowel. This was not enough, however, to shed light on the salience, or otherwise, specifically of nurse~square. By gathering listeners' real-time reactions to audio stimuli, and discovering the time points at which statistically significant changes cluster together, we also established that listeners react to nurse~square words, and that nurse words are, at times, judged differently from square words. It seems that nurse~square is, then, a salient feature of English in north-west England. However, our final conclusion cannot be so straightforward for two reasons: (1) the non-standard realisations of nurse and of square (that is, front nurse but central square) garner most reaction when presented before the more standard variant of the other lexical set (front square and central nurse, respectively), (2) of the two non-standard variants, front nurse seems to be more salient than central square. We have argued, therefore, that the salience of both nurse and square are related to the local social context and the micro-linguistic context in which they appear. Finally, it is worth noting that the methods developed in order to answer this research question are potentially applicable to any research questions for which fine-grained, timed responses from listeners are required. Thus, we suggest that this technique could be a useful additional tool for the (socio)linguistic toolbox.
Appendix: nurse and square words used in Conditions 1–4