Introduction
This study examines trends in the Catholic male workforce over time and cross-nationally through a comparison of the majority Catholic countries of Chile, Ireland, and Poland and, using case pattern analysis, attempts to show the impact of Vatican II, prophetic stances, sexual scandals, and papal visits on these trends. The number of ordinations to the diocesan priesthood in Ireland went into decline, especially after Vatican II, but has been relatively stable in Chile with only a moderate increase in the 1990s. Ordinations in Poland spiked in the 1980s, 20 years after Vatican II. In the three countries, the average resignation rate among diocesan clergy and seminarians increased in the 2000s compared with the earlier two decades. Since the late 1960s, each country has also experienced a decline in its workforce of religious brothers, especially in Ireland.
Taken together, the Chilean, Irish, and Polish Catholic male workforce trends broadly parallel the experience of majority Catholic countries (Ebaugh et al. Reference Ebaugh, Lorence and Chafetz1996; Finke Reference Finke1997; Schoenherr Reference Schoenherr2002; Stark and Finke Reference Stark and Finke2000) in Western Europe as well as countries in which Catholicism is a minority church, many of which have experienced a trajectory of Catholic workforce decline from the 1960s (Hoge Reference Hoge and Clarke2011). Such is the case that some national churches speak of a “crisis” in human resources. This is not a shared crisis, however, as in certain parts of Africa, such as Nigeria, the Catholic workforce is not declining but growing (Linden Reference Linden2009). As documented by others (Ebaugh et al. Reference Ebaugh, Lorence and Chafetz1996; Fishman and Jones Reference Fishman, Jones and Giordan2007), important and understudied variation therefore exists in terms of the timing and pace of structural change in the Catholic Church between different social settings.
Prior research on Catholic workforce trends—either in relation to male priests or female nuns—tends to fall into three broad categories. One type of investigation seeks to put forward a general theory explaining Catholic labor force trends and employing a relatively large number of national cases. One good example of this kind of cross-national study is Fishman and Jones's work that examines Catholic diocesan priest trends in 17 national cases and then homing in on eight cases to isolate the impact of political regime transitions on civil society opportunity structures and, consequently, on the dynamic evolution of workforce trends (Fishman and Jones Reference Fishman, Jones and Giordan2007).
A second kind of study attempts to isolate the explanation for Catholic workforce trends by drawing on data from a single country case. Finke's work (Reference Finke1997) on factors influencing recruitment trends among Catholic religious orders and employing data from the US case is representative of this kind of study. Finke utilizes data from a denominational survey of US religious orders to examine the extent to which religious orders conform to traditional rules and regulations emphasizing community orientation over individual expression.
A third kind of study involves a comparison between two cases but at a diocesan rather than a national level. Young and Schoenherr's (Reference Young, Schoenherr, Hallinan, Klein and Glass1990) study comparing Catholic diocesan priest trends in an American and a Spanish diocese is paradigmatic of this kind of investigation. This study looked at patterns of entry and exit to the diocesan priesthood in two dioceses in the 1966–84 time period and the ratio of ordinations to resignations, deaths, retirements, and terminations.
Across these different studies considerable variation exists in terms of the empirical indicators used, the time period covered, and whether national or local/regional trends are examined. Because these authors include a relatively large number of country cases or are confined to single-N studies, they either run the risk of making overgeneralizations about cross-national patterns or are too specific as to lose application beyond one context.
Within the clerical workforce literature (Hoge Reference Hoge and Clarke2011) as well as research on the labor market in general (Streeck Reference Streeck, Smelser and Swedberg2005), very few studies have sought to investigate Catholic workforce trends using a comparative historical framework. This article fits within this approach by: (1) presenting descriptive empirical data on Catholic workforce trends in Chile, Ireland, and Poland focusing on Catholic male professionals—diocesan priests and seminarians, religious priests, and religious brothers—and, (2) situating these trends within the larger context of the historical experience and institutional history of the Catholic Church in each country.
Theoretically, this study advances a critical events argument in accounting for Catholic male workforce trends. This explanation focuses on the importance of taking account of once-off or suddenly occurring events, incidents, or experiences in a country's past, or in the past of the Catholic Church in a country, in explaining the dynamic evolution of male workforce trends. It also calls attention to the interaction effects that are likely between these analytically distinct events. A “critical event” is a macrosocietal incident that can promote or impede the church's legitimacy and, in turn, its workforce recruitment and retention. I argue that this critical events theory—and attention to historical contingency and complexity, more broadly—should be taken seriously alongside standard explanations focused on general attitudinal changes, opportunity structure shifts, and long-term secular trends in accounting for the longitudinal development of the Catholic Church's workforce.
With these theoretical and empirical ambitions in mind, this article proceeds in six steps. I explain the reasons for comparing historical data for the three cases and provide a brief institutional history of the church in each country. I introduce and elaborate upon the four arguments that constitute critical events theory and postulate one proposition in relation to each. I then provide a description of the data and methods used in the present study. Following this, the fourth part of the study presents descriptive trends in the Catholic male workforce in the three cases. After this, I situate these trends in relation to the critical events experienced in each country. The concluding part of the study summarizes the empirical and theoretical contribution and points to directions for future research.
Case Studies
Chile, Ireland, and Poland were chosen for comparison using a “most similar” approach (Mahoney Reference Mahoney2000), in so far as they each represent majority Catholic societies. By comparing a single dominant religious tradition across different locales, this facilitated an examination of how the particular history of each local context may have impacted the allure of the seminary and the church. I also sought cases from different world regional areas. I limited the study to three societies in order to facilitate an in-depth study of each country.
Going back to the nineteenth century in Chile (Htun Reference Htun2003; Smith Reference Smith1982), penal times in sixteenth-century Ireland (Dillon Reference Dillon and Tentler2007; Keogh Reference Keogh and Tentler2007), and the first republic in sixteenth-century Poland (Porter-Szűcs Reference Porter-Szűcs2011; Zubrzycki Reference Zubrzycki2006), “being Chilean,” “being Irish,” and “being Polish” has been linked to and reinforced by “being Catholic.” This locates the church in all three societies as an “insider” (Dillon Reference Dillon1996: 26), by which is meant a church that is closely allied with the political state and is well integrated with the national society. The church in Chile and Poland is characterized as a partial insider owing to the more contested history of church-state interactions in these two cases compared with Ireland. Authoritarian government in Chile and communist rule in Poland resulted in the Catholic Church having a minority political status despite it being the dominant religion. In Ireland, Catholics in the north developed a sense of political inferiority despite Catholicism's majority status in the south (Keogh Reference Keogh and Tentler2007; Porter-Szűcs Reference Porter-Szűcs2011; Smith Reference Smith1982).
In addition, in each country the Catholic Church has fulfilled an important prophetic leadership role in public life—speaking out in Chile in relation to authoritarian rule by the General Pinochet regime and opposing the threat of “godless” communism, in Ireland with regard to “the troubles” in Northern Ireland and in the 1980s period of public moral turmoil over abortion and divorce in southern Irish society, and in Poland with respect to communism (Keogh Reference Keogh and Tentler2007; Smith Reference Smith1982; Zubrzycki Reference Zubrzycki2006)—and in each case this function has been underwritten by a papal visit.
This prophetic ministry—spanning the promotion of civil society activity, making public pronouncements, and negotiating peace agreements—has been undermined historically, in some Latin American societies such as Chile, by collusion between church officials and military regimes, and, more recently, by internal church scandals relating to tragic cases of clerical child sex abuse and other sexual scandals involving clergy and religious (Linden Reference Linden2009). In Ireland, this abuse by individual priests took place not only in parishes but also in a national network of social welfare institutions run by religious orders and congregations (Shupe Reference Shupe1998). A history of political repression in Poland resulted in state appropriation of church-linked institutions and for this reason the Catholic Church in Poland was less active in child-focused social service provision compared with Chile and Ireland.
Because of this religion-ethnicity linkage, the Catholic Church in the three countries has been characterized historically by high levels of religious commitment, the statistics of religiosity showing that weekly church attendance levels peaked in Chile at 52 percent, in Ireland at 98 percent, and in Poland at 85 percent, but these declined by 2008—as large-scale social survey data report—to levels closer to 20 percent in Chile, 43 percent in Ireland, and 34 percent in Poland (figure 1).Footnote 1
Weekly church attendance in Chile, Ireland, and Poland, 1930–2008. Source: Iannaccone (2003) for 1930–1990, ISSP for 1998–2008.

Notably, in Chile and Poland, the decline in church attendance and the decline in ordinations both occurred at the same time. In the Irish case, declines in weekly church attendance took place after the decline in priestly ordinations (figures 1 and 5). Figure 2 presents data relating to trends in Catholic baptisms and marriages per 10,000 Catholics and shows a decline in each sacrament in all three countries.
Baptisms and marriages per 10,000 Catholics in Chile, Ireland, and Poland, 1969–2010.

Theoretical Orientations
This study is guided by a critical events theory emphasizing the importance of taking account of significant events in the past in explaining workforce trends. Specifically, this theory focuses on the influence of four factors that previous research has found to exert a significant influence on Catholic religious behavior and church legitimacy: Vatican II (Fishman and Jones Reference Fishman, Jones and Giordan2007; Woodcock Tentler Reference Woodcock Tentler2007), prophetic stances (Smith Reference Smith1982; Williams Reference Williams1989), sexual scandals (Berry Reference Berry2000; Shupe Reference Shupe1998), and papal visits (Bruneau Reference Bruneau1982; Stevens-Arroyo Reference Stevens-Arroyo2002; Zubrzycki Reference Zubrzycki2006). Previous Catholic workforce research has taken account of the Vatican II argument (Fishman and Jones Reference Fishman, Jones and Giordan2007; Stark and Finke Reference Stark and Finke2000) in explaining workforce trends but not the other three events. Some of these events—such as sexual scandals—should be expected to have a largely negative impact on workforce change while with respect to others—such as prophetic ministry—the effect on labor market patterns could be either positive or negative.
Vatican II Argument
An important explanation of workforce trends is the effect of Vatican II. Vatican II (from 1962 to 1965) was a council of the church that brought the bishops of the world to Rome to discuss how the church would respond to modernity (Wilde Reference Wilde2007). Vatican II was a complex event with multilayered strands but one of the most significant changes related to clergy-laity relations. Prior to Vatican II, a priest's clothing, training, and education tended to set him apart from ordinary lay people.
After Vatican II, priests began to wear secular clothing and their loss of authority was reinforced by general increases in education among the Catholic laity relative to the education of their former priest superiors as well as the opening up of the opportunity structure for lay participation in lower tiers of the church as the Catholic laity began to fulfill some of the functions of the clergy, such as providing the workforce in Catholic social welfare institutions and parish ministry and administration. One of the unintended consequences of Vatican II, therefore, was the erosion of “boundary maintenance” (Wittberg Reference Wittberg1994: 200) and status differences between clergy and laity and the delegitimation of the clerical role. This likely discouraged men from entering the church as it reduced the benefits associated with becoming a priest (Stark and Finke Reference Stark and Finke2000).
The impact of Vatican II on workforce patterns may be negative, but, then again, it may not. By emphasizing the revitalization of the church, new ecclesial values of lay activism and shared decision making, and identification with the poor and marginalized (Fleet and Smith Reference Fleet and Smith1997; Htun Reference Htun2003), the council may have bolstered the appeal of the seminary, particularly among men with a commitment to an engaged faith involving service and social justice issues, and thus encouraged them to join the church.
Thus, either position suggests that Vatican II has an effect on the Catholic workforce. This leads to Propositions 1a and 1b. 1a: the Catholic workforce declines after Vatican II and 1b: the Catholic workforce increases after Vatican II.
Prophetic Stances Argument
A second important factor likely to influence Catholic workforce trends is the relationship between religious and political institutions. By this is meant the extent to which the church speaks out against state activities and takes positions on things such as social justice, political violence, or the repressive policies of authoritarian regimes. Prophetic ministry may be exercised in relation to these macrosocietal issues but also with regard to the moral domain at the microlevel of individuals and families, as in the example of divorce and abortion. “Prophetic” is the name given to a commitment to confronting various forms of sin in society and thus to improving the moral order. This is accomplished by mobilizing Catholic symbolic forms, on their own or in combination with secular ones, to channel the general populace in the direction of Catholic norms. It can involve a progressive orientation promoting change or a conservative orientation prolonging the status quo (Schoenherr Reference Schoenherr2002). In practical terms, this can entail such things as writing pastoral letters, creating civil society institutions, and lobbying political elites.
Either way, the church's prophetic stances imply there is a better world to be won and that this can be achieved through the exercise of religious “voice.” Interestingly, this prophetic ministry can sometimes be impinged by pastoral care, as in the case of Latin American countries in the 1980s, where clergy working with the on-the-ground realities of poverty and human rights violations spurred the national church to move in the direction of serving a social justice agenda (Htun Reference Htun2003; Smith Reference Smith1982).
By adopting such a prophetic role the Catholic Church shows its support for the concerns and needs of the populace and bolsters its legitimacy as a moral actor in society. This increases the lure of the seminary among potential recruits in the local environment. While the prophetic stances argument thus has to do with the organization of power and domination in a given society and does not relate to a critical event per se, it is often expressed in the form of critical events that take place in public settings and this is well illustrated by the homily to workers in August 1980 by the Polish Cardinal Wyszyński.
The workforce will tend to increase during times and in places where the church takes prophetic stances, but this will be more likely under some conditions than others. When the church's prophetic stances receive strong public support (Smith Reference Smith1982), are advanced by church leaders with symbolic weight and international visibility, and are consistent and coherent over time, they should be more likely to lead to workforce increases.
However, the effect of prophetic ministry could go the other way and thus may not always enhance vocations. For example, the church's prophetic ministry in relation to political violence in Northern Ireland may have discouraged young men, especially those from strongly nationalist/republican communities, from joining the seminary and, therefore, suppressed vocations. Similarly, the hierarchy's stances in relation to the sociomoral issues of contraception, abortion, and divorce in the 1980s, especially those of more traditionalist prelates unsympathetic to opposing perspectives on personal morality, could have alienated or disappointed some would-be recruits and thus made the lure of the seminary less appealing. The Chilean hierarchy's increasingly conservative position on these issues in the 1990s may have had a similar effect especially in light of the diverging opinions and growing independence of the Catholic laity in relation to their former priest superiors (Fleet and Smith Reference Fleet and Smith1997). For others, the church's engagement in “politics” at the expense of traditional faith and morals concerns, as occurred in Chile in the 1980s, may also have engendered alienation and thereby suppressed vocations (ibid.).
Thus, either position suggests that prophetic ministry has an effect on the Catholic workforce, either positive or negative.
This leads to Propositions 2a and 2b. Proposition 2a: the Catholic workforce increases as a result of the church's prophetic stances. Proposition 2b: the Catholic workforce decreases as a result of the church's prophetic stances.
Sexual Scandals Argument
Some critical events likely to influence Catholic workforce trends can take the form of tragic incidents—such as clerical child sex abuse scandals and other sex scandals involving Catholic clergy and religious. A critical and investigative mass media was a significant factor in the emergence of these scandals and bringing the issues of trust, blame, and justice in relation to them into the public domain (Conway Reference Conway2014). As instances of “clergy malfeasance” (Shupe Reference Shupe1998: 1) and the abuse of clerical power, these scandals are likely to influence workforce trends because they delegitimize the symbolic weight and religious structure of control of the church in general and clergy and religious in particular, and thus are likely to discourage men from joining the organization. In the case of clerical child abuse, this arises from the dual nature of the scandals—the behavior of individual offending clergy, on the one hand, and the administrative practices of church elites that enabled this behavior, on the other—as well as state and media scrutiny of the scandals (ibid.). The influence of these scandals on workforce trends is likely to be greater in contexts in which the Catholic Church emphasizes adherence to a strong sexual moral code among the laity—such as Ireland—compared with contexts—such as Germany and Vietnam—in which the church is either in a minority position or a more contested local political environment and sexual ethics have tended to be deemphasized. This leads to Proposition 3: the Catholic workforce decreases as a result of sexual scandals.
Papal Visits Argument
Critical events can also take the form of triumphal incidents—such as the visit of a pope. Within Catholicism, the pope is the symbolic center of authority and pastoral care in the church. Papal visits to national churches give concrete expression to this and usually address three distinct audiences—state elites, church elites, and the general public—with each involving different meeting formats (Stevens-Arroyo Reference Stevens-Arroyo2002). Although papal visits may vary in their intensity, geographical coverage, and range of public contacts, they usually entail a bolstering by the pope of the church's legitimacy and cultural weight (Bruneau Reference Bruneau1982; Stevens-Arroyo Reference Stevens-Arroyo2002). In addressing the church audience, the pope typically affirms the role of the clergy and religious and asks for support for them from the general populace.
During a papal visit the pope will also frequently attend a Catholic seminary and meet with and encourage student priests. This is likely to contribute to an increase in the status and standing of Catholic personnel and inspire young men to join its workforce. The influence of a papal visit on workforce trends is likely to be greater when the general populace largely agrees with such an event and when the national government supports it. It is also likely to vary depending on who is the pope at a particular time—if the pope—as in the case of Pope John Paul II or Pope Francis—is viewed as a globally charismatic celebrity figure when compared with a somewhat less charismatic personality such as Pope Benedict XVI, the impact on the workforce of a papal visit is likely to be stronger. One would expect that this impact would be relatively short term, perhaps a year or two before or after a visit. It is possible, however, that instead of creating or bolstering greater religious fervor or devotion, papal visits may come in the wake of heightened religious commitment. In general, though, papal visits tend to generate rather than follow periods of religious growth. This leads to Proposition 4: the Catholic workforce increases after a papal visit.
An important conceptual point is necessary here. Although each of these critical events has been treated separately for purposes of clarity, they should not be assumed to be independent, self-contained “unit” events. Rather, they are subject to interaction effects, and it is the nature of these interactions that produces their impact on workforce trends. Note the case of Poland in the 1980s, for example, where sex scandals relating to clergy would be expected to have been less likely to become public because of the church's historical prophetic role and because of the symbolic institutional weight of a papal visit as well as of charismatic senior Catholic clerics such as Cardinal Stefan Wyszyński. Similarly, in the case of Ireland, the symbolic weight of a papal visit and the cultural force of the church's prophetic stances in relation to sociomoral issues made it less likely that sexual scandals would have emerged in Ireland in the 1970s and 1980s compared with the 1990s.
As well as one critical event symbolically producing the meaning of another, it is also the case that the meaning of a critical event may vary both over time and cross-nationally. Consider, for example, the papal visit argument. Papal visits are best understood as nonequivalent events as their meaning likely varies significantly as between a visit that takes place in the context of a major political regime change—as in Poland in the 1980s—and a visit that takes place after a regime transition. Similarly, the papal visit to Poland in 1979 is not necessarily equivalent in terms of its influence on Catholic workforce trends to the papal visit to Ireland that took place in the same year, as the Polish visit occurred against the background of the church's prophetic role opposing the communist regime, a situation that did not apply in the Irish case. Clearly, the papal visit to Ireland did not have the same effect as it did in Poland, where it bolstered civil society organization and mobilization. One must be cautious, therefore, about making blanket claims in relation to the impact (or absence thereof) of critical events on the Catholic workforce.
Alternative Explanations
Of course, critical events are not the only possible influence on workforce variation and the literature identifies a number of other alternative explanations. Two prevalent explanations are the secular opportunity and social movement arguments. Ebaugh and colleagues advance the claim that the Catholic Church's workforce is shaped by the opportunity structure available outside of the organization of the church in terms of finding a job and gaining an education in the secular world (Ebaugh et al. Reference Ebaugh, Lorence and Chafetz1996). Clearly, this theory implies a stronger decline in the Catholic female workforce than in the male workforce. Indeed, Ebaugh and colleagues are clear that this argument applies only to women as traditionally women have been excluded from professional careers and were able to move into the professions through their joining of Catholic orders and congregations. Additionally, because this argument concerns change in the female workforce only it does not take account of the different pressures to which the Catholic male workforce may be subject.
Another explanation for Catholic workforce trends—the social movement explanation—has been applied specifically to explain trends in religious orders rather than the diocesan workforce and treats orders and congregations as social movements with members and structures much like other kinds of social movements. This perspective isolates the importance of the internal and external resources available to religious orders ranging from the financial to the ideological and institutional (Wittberg Reference Wittberg1994). It also relies, to some extent, on outside events such as the rise of feminism and the opening up of opportunity structures for women, factors that do not apply in respect of the male workforce. Wittberg is also clear that the dynamics she is examining—relationships to ecclesiastical authority, for example—do not equally apply to the Catholic diocesan workforce.
A third—and well-publicized—explanation focuses on aspects of Catholic theology and practice, particularly the mandatory requirement of life-long celibacy among a male clergy (Schoenherr Reference Schoenherr2002; Stark and Finke Reference Stark and Finke2000). This expectation that clergy remain unmarried and refrain from sexual activity is a constant of modern church life, but it is also the case that this status can mean different things to clergy and laity alike in different settings and at different times in the same setting. However, as this rule applies to all clergy and has always been implemented in the church, it fails to account for the recent growth of religious orders and congregations with a traditionalist orientationFootnote 2 or why Catholic vocations are growing in some parts of the world but not in others.
Other research regarding institutional change in the Catholic Church acknowledges that internal developments—such as Vatican II—provide an opportunity for change, but it also rightly acknowledges that these interact with changes in the external environment—such as general attitudinal shifts and secularization and the decline of religion—to bring about structural change (Seidler and Meyer Reference Seidler and Meyer1989; Woodcock Tentler Reference Woodcock Tentler2007).
Other ongoing macrosocial changes and nonreligious dynamics and events such as the decline in agriculture, economic modernization, and changes in demographic patterns also occurred around the same time as Vatican II and may also have impacted the lure of the seminary. These standard arguments and explanations, however, posit change as unfolding slowly and gradually over relatively long periods of time and are not well positioned to explain quick, short-term, or sudden changes in workforce trends.Footnote 3 A theory that incorporates variables or perspectives that change at roughly the same pace as changes in the workforce is needed to account for this.
Data and Methods
The data employed to investigate the four propositions come from two denominational sources published by the Vatican—the Annuario Pontificio (hereafter AP) and the Annuarium Statisticum Ecclesiae (hereafter ASE). The AP is a directory of the Roman Catholic Church and reports data retrospectively (by two years) on every titular and residential diocese in the universal church. The ASE is a statistical yearbook of the Roman Catholic Church dating back to 1969 and contains annual data relating to national churches rather than dioceses. For the 1950–68 time period, the data come from the AP, and for 1969–2010, I employ the ASE. Because the AP only contains diocesan-level data, the data were aggregated to create a national-level data set. In rare cases where data for a diocese were missing in a particular year, I used the previous year's figures as an estimate. An unfortunate limitation of the data is that sick and retired clergy as well as nonlaicized former clergy are included while permanent deacons, a growing part of the Catholic workforce, are excluded.
Before presenting the descriptive data, the indicators of the Catholic workforce used in this study require brief consideration. Because previous research emphasizes the importance of religious labor market segmentation within a single denomination (Chaves Reference Chaves1991), three categories of Catholic male workforce professionals were investigated—diocesan priests, religious priests, and religious brothers. Of course, the Catholic Church is not only, or primarily, its “workforce.” The global church employs an enormous number of people including dedicated volunteers and lay experts and professionals working in a wide variety of roles. The church also has a large number of female workers known as sisters engaged in teaching, health care, and other social services. In addition, recent changes in Catholicism associated with greater lay activism have rendered its formal employees less central than before. At the same time, although the clerical male workforce represents a minority of the church's personnel, it is key to prolonging the central sacramental ritual of the church: the Mass.
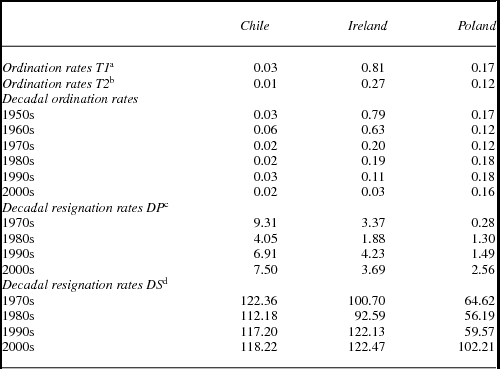
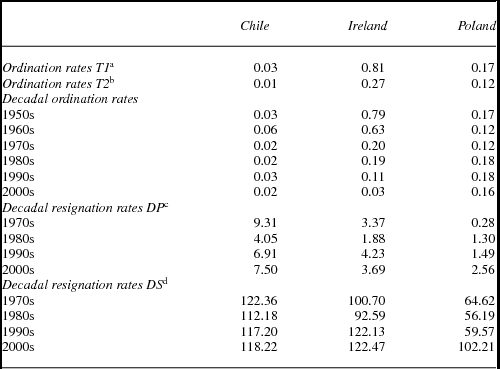
It is noteworthy that there has been some disagreement in prior research as to what is the appropriate empirical indicator of the Catholic Church's workforce (Fishman and Jones Reference Fishman, Jones and Giordan2007). Some studies use lagging indicators—the total number of serving diocesan priests (Schoenherr and Young Reference Schoenherr, Young and Ebaugh1991)—while others use leading indicators—the number of newly ordained priests (Fishman and Jones Reference Fishman, Jones and Giordan2007). Because the former stock data tend to react slowly to events and trends I used flow data—numbers of ordinations (entrances) and resignations (exits)—to assess the influence of critical events on the Catholic male workforce in each country. I computed ten-year average rates for ordinations and resignations (table 1) and peak-to-2010 changes to help gauge patterns of growth or decline in each country.
Ordination and resignation trends among Catholic male clergy in Chile, Ireland, and Poland, 1950–2010.
Source: Annuario Pontificio and Annuarium Statisticum Ecclesiae.
a T1 (Time 1) denotes decade (1952–61) prior to Vatican II.
b T2 (Time 2) denotes decade (1966–75) after Vatican II.
c Average resignation rate among diocesan priests.
d Average resignation rate among diocesan seminarians.
For trends in church attendance, I relied on large-scale social survey data from the International Social Survey Programme (ISSP) as well as Iannaccone's “looking backward” data (Iannaccone Reference Iannaccone2003), which employs retrospective questions from the ISSP about the religious behavior of respondents and their parents when they were growing up, to estimate church attendance trends in the 1925–90 span.
Findings
Descriptive Trends
Figures 3–8 present the data collected in this study relating to Catholic workforce trends in Chile, Ireland, and Poland with reference to the three categories of church male professionals.
Diocesan priests per 10,000 Catholics in Chile, Ireland, and Poland, 1950–2010.

Religious priests per 10,000 Catholics in Chile, Ireland, and Poland, 1950–2010.

Ordinations to the diocesan priesthood per 10,000 Catholics in Chile, Ireland, and Poland, 1950–2010.

Religious brothers per 10,000 Catholics in Chile, Ireland, and Poland, 1969–2010.

Diocesan priest resignations per 1,000 diocesan priests in Chile, Ireland, and Poland, 1969–2010.

Diocesan seminarian resignations per 1,000 seminarians in Chile, Ireland, and Poland, 1969–2010.

Figure 3 shows that the number of diocesan priests per 10,000 Catholics peaked in Chile at 1.51 in 1967, in Ireland at 12.44 in 1970, and in Poland at 6.32 in 2010. This compares with 0.96 in Chile (−0.55 decline) and 5.41 in Ireland (−7.03 decline) in 2010. The largest peak-to-2010 change took place in the ranked order of Ireland and then Chile.
The three countries also show some divergence when trends in their religious priest workforces are considered (figure 4)—in Chile, the religious priest workforce per 10,000 Catholics peaked at 2.58 in 1957, in Ireland it peaked at 6.97 in 1983, and in Poland it peaked at 1.78 in 2009. The workforce in Chile declined to 0.87 in 2010 (−1.71 decline) and to 3.86 in Ireland in 2010 (−3.11 decline). Although ordination and resignation data for religious priests are not available in the official church statistics employed in this study, the relative stability in the religious priest workforce in Ireland compared with the diocesan priest trend is noteworthy.
Figure 5 reports data relating to newly ordained diocesan priests in Chile, Ireland, and Poland.
In Chile, the number of ordinations per 10,000 Catholics peaked at 0.06 in 1950 and declined to 0.02 in 2010 (−.04 decline from peak). In Ireland ordinations per 10,000 Catholics peaked at 0.92 in 1959 and stood at 0.01 in 2010 (−.91 decline from peak) and in Poland the number of ordinations per 10,000 Catholics peaked at 0.28 in 1956 and declined to 0.14 in 2010 (−.14 decline from peak). The largest peak-to-2010 change thus took place in Ireland followed by Poland and then Chile.
A glance at figure 6, which presents data about the number of religious brothers per 10,000 Catholics in each country, shows their number in all three countries went into decline from the late 1960s, especially in Ireland. The number of religious brothers in Chile peaked at 0.91 in 1970, in Ireland it peaked at 9.44 in 1969, and in Poland it peaked at 0.76 in 1969. This compared with 0.33 in Chile (−0.58 decline), 1.29 in Ireland (−8.15 decline), and 0.29 in Poland (−0.47 decline) in 2010. The largest peak-to-2010 change thus took place in Ireland followed by Chile and then Poland.
Figure 7 presents data relating to the number of resignations among diocesan clergy (per 1,000 diocesan priests) in each country in the 1969–2010 time period. Figure 8 does this for seminarians for the diocesan priesthood (per 1,000 seminarians). These figures are discussed later in the study.
Contexts of Trends
Proposition 1
On the basis of the earlier conceptual framework, numerical change in the Catholic workforce should be expected after Vatican II. To assess this Vatican II argument, I computed the average number of ordinations (table 1) for the ten years before (1952–61) and after (1966–75) Vatican II for each country as well as tracking changes in the decades after 1975.
In the ten-year period before Vatican II, the average number of ordinations was 0.03 in Chile, 0.81 in Ireland, and 0.17 in Poland. This compares to an average of 0.01 in Chile, 0.27 in Ireland, and 0.12 in Poland in the ten-year period after Vatican II. Thus, in all three cases ordinations were lower in the ten years after Vatican II than in the ten years prior to it and the rank order of the decline was Ireland, Poland, and then Chile.
A glance at figure 5 (see also table 1) shows that in the Chilean experience, the trend line in ordinations has been basically stable with only a moderate increase in the 1990s. In the Irish case, the decline in ordinations after 1950 is not very dramatic and by the mid-1960s ordinations are on the same level again. However, between 1965 and 1970 ordinations in Ireland declined quite dramatically. Ordinations in Poland have fluctuated more than in Chile, with a rise in the mid-1950s and the 1980s. Overall, the evidence points to a partial Vatican II effect—the fact that peaks in ordinations per 10,000 Catholics occurred in each case prior to the council (1950 in Chile, 1959 in Ireland, and 1956 in Poland) suggests that it intensified an already existing trend rather than being the beginning of it. However, in the Irish case I found that the Vatican II covariate had a statistically significant and positive effect on the workforce (see table 2).
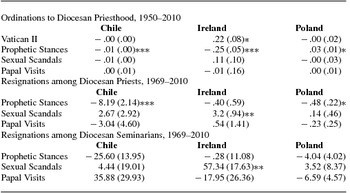
Effects of critical events on the Catholic male workforce in Chile, Ireland, and Poland controlling for economic development, 1950–2010: OLS regression models.

Source: World Economics Maddison Historical GDP Data and New Maddison Project Database.
Note: Table reports OLS regression coefficients with standard errors in parentheses. Each of the covariates was entered in the models as a dummy variable (1 meaning event, 0 meaning nonevent). In the case of papal visits, a country was coded 1 on this variable when a papal visit occurred in the local church during that year and 0 otherwise. The sexual scandals variable for Ireland is 1 in the years 1994–2010 and 0 otherwise. The dependent variable refers to the relative number of clergy ordinations or resignations. All the models include controls for national economic development. While this is a mutlilayered concept, it is traditionally measured in terms of per capita gross domestic product (G-K international dollars).
* p < .05. ** p < .01. *** p < .005.
Cross-national variation in the post–Vatican II ordination trend line is a noteworthy finding that calls for additional explanation. One explanatory factor is the different reaction and interpretation evoked by Vatican II reforms in different national populations as well as an interaction effect between the Vatican II and prophetic stances perspectives. Past research suggests that the reception of Vatican II, while not without some ambivalence among devotees in Ireland, was generally well received (Streib Reference Streib1973). By contrast, the prophetic stances of the Chilean hierarchy in the 1980s wavered and did not always command approval in the general populace, a factor that may account for the spike in Chile in the 1950s and not in the 1970s and 1980s. Later, in the 1990s and 2000s, the Chilean bishops’ conservative moral position-taking was more consistent, rallying against secular liberal reforms such as divorce (Htun Reference Htun2003; Lies and Malone Reference Lies, Malone, Manuel, Reardon and Wilcox2006). Although Polish Catholics expressed discontent with Vatican II, this was neutralized by the communist repression in the 1970s, which contributed to the reinforcement of the ethnic component of religious identity and consequently a bolstering of the church's symbolic weight during the 1980s (Strassberg Reference Strassberg and Gannon1988).
Proposition 2
As posited in Proposition 2, a prophetic church-state configuration should lead to numerical change in the Catholic workforce. The findings provide strong support for this proposition. This study found that Poland experienced a spike in ordinations during the period in which the church was the most prophetic—1980s—while Chile experienced its spike—in 1950—before the period in which church's most prophetic role took place—1970s and 1980s (figure 5). In the 1980s in Poland, the symbolic weight and leadership of charismatic church leaders such as Cardinal Wyszyński played a pivotal role in defending the legitimacy of civil society organization through the Solidarity trade union movement that, in turn, mobilized powerful religious symbolism—such as the Black Madonna of Częstochowa—as well as appeals to general civic and human rights to motivate nonviolent collective action among ordinary Polish workers (Zubrzycki Reference Zubrzycki2006). But there were other examples of similar prophetic ministry during the 1980s, forming a category that allows them to be identified as characterizing this decade. Consider, for instance, the homily of Cardinal Jósef Glemp, Wyszyński's successor, in December 1981 in which he rebuked the communist government's introduction of martial law. In another homily in Warsaw in October 1986, Cardinal Wyszyński urged the faithful to redouble their efforts against the communist regime, but by avoiding direct confrontation (Porter-Szűcs Reference Porter-Szűcs2011: 261). Other Catholic prelates rallied against the communist government during this time, including Bishop Kamiński of Lublin who attacked the regime's negative influence on young people especially (Porter-Szűcs Reference Porter-Szűcs2011). Later, in August 1989, Cardinal Glemp defended the location of a Catholic convent on a site close to the former Auschwitz concentration camp, in a highly publicized symbolic struggle over the meaning of the nation's past (Zubrzycki Reference Zubrzycki2006). This occurred around the same time as the 1987 papal visit, during which the pope supported Cardinal Glemp, Solidarity, and its leader Lech Walesa. Church authorities were also active in negotiations between Solidarity and the communist government in the late 1980s, which paved the way for the end of communism (Stan and Turcescu Reference Stan and Turcescu2011). This suggests an interaction effect between the papal visits (which occurred in the late 1980s) and prophetic stance perspectives that contributed to the workforce spike in Poland but not in Chile.
Further evidence of the influence of the prophetic role of the church on workforce trends in Poland in the 1980s comes from resignation data (table 1). In the 1970s, the mean resignation rate among diocesan priests was 0.28, compared with 1.30 in the 1980s. In the following decade—the 1990s—it rose to 1.49. Among Polish diocesan seminarians, the average resignation rate was lower in the 1980s than in the 1970s, the 1990s, and the 2000s. In addition, the prophetic stances covariate in Poland has a positive coefficient in the regression models reported in table 2.
As mentioned already, the fact that Chile experienced a spike in ordinations before the church played a prophetic role may be explained by the weakening in support among the Catholic laity for the church's prophetic voice, which, in the 1970s and 1980s, was sometimes oblique in its criticisms of repressive government and its advocacy of democracy. A good example of this was the statement by Cardinal Silva in October 1973 in which he lent the church's support to the state and avoided direct criticism of the abuses of the military regime (Smith Reference Smith1982). The church's prophetic ministry, though, was partly undermined by collusion with the military regime and this may explain the negative (and highly statistically significant) coefficient for the prophetic stances covariate in Chile (see table 2). However, in the 1990s, the church hierarchy was much less guarded on faith and morals issues such as divorce. In 1996, for example, the Chilean bishops wrote directly to national parliamentarians urging rejection of divorce legislation (Htun Reference Htun2003).
In the Irish case, the hierarchy adopted a prophetic role on behalf of the Catholic nationalist population in Northern Ireland in the 1970s and 1980s by speaking out strongly against political violence (Keogh Reference Keogh and Tentler2007), a stance bolstered by the pope during his 1979 visit. Note the interaction between the prophetic stances and papal visits perspectives. This prophetic ministry, mostly by the church hierarchy but also by some religious priests belonging to orders such as the Redemptorists, took different forms including direct public condemnation of violence, negotiating with the British state system in relation to the treatment of the Catholic population, and providing practical support to victims of violence.
To cite two examples, from 1970 to 1971 the northern bishops published a number of joint statements condemning the resort to political violence in Northern Ireland (Irish Bishops’ Conference 1979). The bishops warned that it would lead to an intensification of the conflict and put their moral weight behind democratic institutions and procedures. Similarly, during the Hunger Strikes by republican prisoners over their treatment by British state authorities, which occurred from 1980 to 1981, Catholic priests and bishops directly negotiated with the British government regarding the inmates’ demands. Interestingly, ordinations to the diocesan priesthood in Ireland spiked in 1973–74 (figure 5) at a time when the church hierarchy voiced opposition to violent Irish republicanism, especially during the early and most intense period of “the troubles” in the north of the island. The negative coefficient for the prophetic stances covariate reported in table 2 suggests, however, that the church's conservative activism and prophetic ministry during the divorce and abortion debates of the 1980s likely discouraged men from enrolling in the church rather than persuading them to become modern (post–Vatican II) priests. It may also reflect the selective nature of the laity's commitment to church prononcements, which has tended to be weak on the national question (Peillon Reference Peillon1982).
Proposition 3
According to Proposition 3, the Catholic workforce should increase after a papal visit. The empirical findings provide partial support for this proposition. In the Irish example, the 1980s spike in new callings or ordinations occurred in 1986—exactly seven years after the pope's visit. This suggests that the pope's 1979 visit encouraged young men to join the priesthood and that many of these men completed their training in the church—which is typically of seven years duration—leading to their eventual ordination in 1986. However, some caution is needed in attributing the 1980s spike in new callings in Ireland exclusively to the 1979 papal visit as the upturn in vocations (per 10,000 Catholics) may also be partly attributable to changes in the base population size as reflected in the exodus from the church in terms of baptisms during this time (figure 2).
Proposition 3 would also lead one to expect a reduction in resignations after a papal visit. I found that in the year of the pope's visit diocesan priest resignations did indeed drop—from 3.42 in 1978 to 2.91 in 1979—but in the year immediately after the pope's visit, resignations among diocesan priests increased and then declined again in 1981.Footnote 4 However, the average diocesan priest resignation rate (resignations per 1,000 diocesan priests) in Ireland (table 1) was lower in the 1980s (1.88), the decade after the pope's visit, than in the 1970s (3.37).
Among diocesan seminarians resignations also dropped the year of the pope's visit—from 78.98 in 1978 to 68 in 1979—and then rose again to 75.15 in 1980, the year after the visit. Against the trend line in relation to diocesan priests, the average resignation rate among seminarians was higher in the 1980s (92.59) than in the 1970s (100.70).
Evidence for Chile shows support for a workforce spike after a papal visit. The pope visited Chile in 1987 and resignations among diocesan priests dropped in the year of the visit, declining from 4.36 in 1986 to 1.42 in 1987. Resignations among seminarians also declined the year of the visit, from 153.08 in 1986 to 143.60 in 1987. The year immediately after the papal visit diocesan priest resignations rose to 7.10 while seminarian resignations declined to 97.22.
In relation to the Chilean case, a positive workforce impact of a papal visit is suggested by decadal trends in average resignation rates. Among diocesan priests, resignations were lower in the 1980s than in the 1970s (table 1), declining from 9.31 in the 1970s to 4.05 in the 1980s, and among seminarians, the average resignation rate declined from 122.36 in the 1970s to 112.18 in the 1980s. This is despite the fact that there was no Chilean counterpart to Poland's Solidarity movement to which symbolic weight could be given—and greater cultural impact made as a result—by the pope's visit.
The Polish data also provide corroboration for Proposition 3. The pope visited his homeland in 1979, 1983, 1987, and 1997 (as well as numerous other occasions). The 1979 papal visit to Poland did lead to workforce increases—in the year of the visit, diocesan priest resignations declined to 1.49 from 2.62 in 1978. In 1980, one year after the visit, the number of diocesan priest resignations was 1.99, compared with 1.49 in 1979.
A similar trend is evident in relation to seminarian resignations. In the year of the pope's 1979 visit, seminarian resignations declined to 55.29, compared with 65.37 in 1978. In 1980, one year after the pope's visit, resignations rose marginally to 49.20. The impact of a papal visit on the Catholic workforce is also apparent in relation to ordinations. In the three years after the visit, ordinations increased in Poland from 0.12 in 1979 to 0.16 in 1982.
Taking the example of the pope's 1983 visit, a positive workforce impact is evident in relation to some indicators. In the year of the visit, diocesan priest resignations rose to 1.56 compared with 1.20 in 1982. This finding was unexpected but reflected only a marginal increase. In 1984, one year immediately following the visit, resignations declined to 0.98 and dropped even more in 1985, to a level of 0.84. Surprisingly, seminarian resignations also increased, but only marginally, the year of the visit—from 60.38 in 1982 to 61.05 in 1983. However, one year after the visit, seminarian resignations declined—from 61.05 in 1983 to 54.52 in 1984. The number of new callings in Poland also rose in 1984 (0.17) and 1985 (0.20) compared to 0.16 in 1983.
The occasion of the third papal visit to Poland in 1987 also led to a spike in callings to the diocesan priesthood with ordinations increasing from 0.20 in 1987 to 0.22 in 1988 and 1989. Resignations from the priesthood declined from 1.65 in 1986 to 0.86 in 1987, though among seminarians showed a marginal increase from 49.27 to 49.49.
Last, the pope's 1997 visit led to increases in resignations among diocesan seminarians, from 71.61 in 1997 to 85.37 in 1998. Among diocesan priests, resignations declined to 1.46 in 1998—from a level of 1.62 the year of the pope's visit—but began to increase again in the 2000s, reaching 2.52 in 2010.
As table 2 shows, papal visits have the expected positive effect on ordinations in Chile and Poland but not in Ireland, although none of the effects are significant. With regard to resignations among diocesan priests, papal visits have a predicted negative effect in Chile and Poland but the effects are also nonsignificant. In Ireland, however, papal visits have a positive (not significant) effect on clergy resignations. This might reflect disappointment among clergy with the pope's conservative moral activism during the 1979 papal visit.
Variation in the impact of different papal visits on diocesan priest and seminarian resignations in Poland may be related to the interaction between the papal visits and prophetic stances perspectives. In the 1980s, the cultural force of the papal visits was greater as they were linked to the church's prophetic stances during this time, compared with the late 1990s when the country's democratic transition had already taken place. Not all papal visits can have a significant effect on the Catholic workforce in a given society as the historical context of a papal visit may change over time.
Proposition 4
Contexts in which the Catholic Church experiences sexual scandals should be expected—as postulated in Proposition 4—to experience a decrease in the Catholic workforce. The empirical findings provide moderate support for this proposition. Ordinations to the Catholic diocesan priesthood in Ireland have been declining since the mid-1960s but the decline accelerated in the 1990s and 2000s (table 1), a time period characterized by the outbreak of highly publicized clerical child sex abuse scandals and other clerical scandals in Ireland that contributed to the loss of the church's cultural weight. This began in 1994 when a Norbertine order priest Father Brendan Smyth was arrested arising from child abuse allegations going back several decades (Tanner Reference Tanner2003). Other notable cases—in the dioceses of Ferns and Raphoe—included that of Father Sean Fortune and Father Eugene Greene, whose pedophile activities came into the public domain in 1995 and 1999, respectively. The average ordination rate was 0.11 in the 1990s and 0.03 in the 2000s compared with 0.18 in the 1980s. In the 1990s the average resignation rate for diocesan priests in Ireland was 4.23 compared with 3.69 in the 2000s. Among diocesan seminarians, the resignation rate (table 1) increased from 122.13 in the 1990s to 122.47 in the 2000s.
Some of these scandals involved clergy who had sexual relationships and children with female partners. In the Irish case, this arose in 1992 in relation to the influential bishop of Galway, Eamonn Casey, who had an affair and a son with an American woman (Shupe Reference Shupe1998; Tanner Reference Tanner2003). Another noteworthy case around the same time related to the well-known Dublin priest Father Michael Cleary who had a child with his live-in housekeeper, a scandal that entered the public domain in 1993. Still other scandals related to the ill-treatment of “fallen women” in Magdalen laundries run by Catholic sisters, which came to light in 1995 and 1996, and of children in reformatories and industrial schools managed by male religious, tragic events publicized from the late 1990s (Tanner Reference Tanner2003). Resignations among diocesan clergy in Ireland fell from 3.19 in 1992 to 2.41 in 1993 but rose after 1994, reaching 6.86 in 1996. Seminarian resignations increased the year of the Bishop Casey scandal, increasing from 88.11 in 1991 to 117.77 in 1992. Callings to the priesthood also declined the year after the scandal from an ordination rate of 0.12 in 1992 to 0.11 in 1993. Interestingly, I found a statistically significant effect for the sexual scandals covariate on resignations among diocesan priests and seminarians in Ireland (see table 2), pointing to their dampening effect on church personnel.
One must be cautious, though, in attributing the mid-1990s Catholic workforce declines in Ireland solely to sexual scandals as this time period partially overlapped with a phase of sustained collective prosperity generally referred to as the “Celtic Tiger” era. This is a potentially important explanatory factor as macroeconomic change increases leisure activity possibilities, and, by providing an alternative outlet for human meaning—in terms of promoting social belonging—to religious behaviors such as church attendance (Hirschle Reference Hirschle2010), this leisure culture may lure people away from the social contexts that sustain or promote Catholic vocations. Economic growth may also open up opportunities for men to enter secular professions and thus discourage them from pursuing a career in the church (Ebaugh et al. Reference Ebaugh, Lorence and Chafetz1996). However, I found that the sexual scandals covariate had a statistically significant effect in Ireland, even after controlling for national economic development (see table 2).
The mid-1990s workforce decline could also be interpreted as the “natural” decrease in the influence of the Catholic workforce spike arising from the papal visit in the late 1970s as well as the loss of the cultural weight of the church generated by this visit—which, together with the reportage of a critical investigative mass media, made it more likely that the sexual scandals came into the public domain in the 1990s in the first place and not earlier in the 1970s.
The influence of sexual scandals on the Catholic male workforce can also be gauged in Chile and Poland as in both countries the church experienced clerical child sex abuse scandals in the 2000s, somewhat later than in Ireland. The symbolic weight of the church's role in Polish society and of the frequent papal visits to the country in the 1970s and 1980s likely contributed to the lag in these sexual scandals coming into the public domain in Poland compared with Chile and Ireland. Interestingly, sexual scandals came to light in the Polish church only after the death of Pope John Paul II in 2005. For example, in 2007 the abuse by Father Stanislaw Kaszowski of a 13-year-old altar boy came to light, one of the first cases of abuse in the Polish church (Luxmoore Reference Luxmoore2012). Interestingly, among diocesan priests in Poland the resignation rate increased in the 2000s—from 1.49 in the 1990s to 2.56 in the 2000s. In addition, the seminarian resignation rate increased between the 1990s and the 2000s, further pointing to the negative impact of sexual scandals on workforce trends.
In the Chilean case, allegations about the abusive activities of Catholic clergy became public from the 2000s onward. One example concerned the Santiago priest Father Jose Andres Aguirre who was sentenced in 2003 for abusing girls (Giulia Agostini Reference Giulia Agostini2012). Other cases in Chile involved high-level church officials such as the archbishop of La Serena who resigned in 1997, but whose abuse came to light only in 2002 (González Reference González2002). These cases likely impacted retention rates in the church. A glance at table 1 shows that the average resignation rate among diocesan priests in Chile increased—from 6.91 in the 1990s to 7.50 in the 2000s—as did the resignation rate among seminarians.
Using trend lines of clerical workforce data alone, it is difficult to tease out the impacts of these factors as they often overlap in time, interact with nonreligious events and dynamics, and undoubtedly vary across countries. To better gauge the specific and independent effects of the four factors, I ran a series of Ordinary Least Squares time series regression models for each dependent variable in each country, controlling for exogenous factors such as economic growth, as measured by per capita gross domestic product (see table 2). This shows that prophetic stances had negative and statistically significant effects on ordinations in Chile and Ireland but a positive effect in Poland. Vatican II also had a positive and statistically significant effect on ordinations in Ireland. In Chile and Poland, the church's prophetic stances had a negative and statistically significant effect on resignations among diocesan priests. In Ireland, the finding of a positive and statistically significant effect of the sexual scandals covariate on church retention was not surprising and reflects the difficulties of priestly ministry in the face of embarrassing institutional scandals. Turning attention to resignations among diocesan seminarians, only in Chile did the prophetic stances covariate have a statistically significant and negative effect.
Conclusion
This study examined the dynamic evolution of the Catholic male workforce using data over time for the three Catholic countries of Chile, Ireland, and Poland. This investigation contributes to theory and research about religion and society in general in three significant ways. First, this study underscores the value of recognizing the influence of institutional and on-the-ground contextual realities on religious organizations. While previous research has examined contextual influences on Catholic vocations (Stark and Finke Reference Stark and Finke2000), this has been confined to documenting aspects of the diocesan context—such as its ideological culture—that potentially influence new recruits. This study adds to this literature by considering how important transnational and local events in the national church, some unique to the Catholic case, may augment or decrease the church's personnel.
Second, by emphasizing the relevance of sudden, short-term events in bringing about religious change I challenge the emphasis in the Catholic workforce literature—and the sociology of religion literature, more broadly—on invoking gradual, long-run social structural processes (such as urbanization, modernization, and industrialization), or long-term demographic shifts interacting with other sociocultural changes, as explanations for secular trends (Bezjak Reference Bezjak2012; Ebaugh et al. Reference Ebaugh, Lorence and Chafetz1996). In contrast to this earlier literature, I also analyze events largely within the control of the Catholic Church rather than external changes and forces beyond its influence. Suddenly occuring events tend to become more evident in research involving historical case pattern analysis as such studies allow the identification of causal processes or mechanisms operating in specific times and specific contexts, an analysis lacking in available large-N correlation-based research.
Third, the critical events theory introduced and developed in this study emphasizes the importance of the cultural legitimacy and symbolic weight of religious organizations in maintaining their institutional strength. This means that men join the Catholic workforce not just because they may feel called by God or desire to serve others but because of a wider sociocultural context that legitimizes—or not—the church as an institution. I have argued that some events, such as papal visits, bolster this legitimacy while others, such as sexual scandals, erode it, and that these events have interactive effects and differently so, across time and space. To varying degrees, the Catholic Church in the three cases studies suffers from what might be termed a legitimacy problematic. When the church loses legitimacy in the national context arising from “eroding” events it is difficult even for short-term “bolstering” events to retain their effectiveness in attracting recruits and cohort replacements from the local environment, unless such events interact with an historical context in which the church is opposing the state.
This study's findings should be interpreted in light of three main limitations, deficiencies that are also the limits of comparative historical studies more generally. Three specific shortcomings invite further research. First, future research could investigate further how workforce trends may be related to patterns in other aspects of Catholic identity and commitment. How would one explain, for example, why a nation of ardent and faithful Catholics in Poland found the seminary appealing while eschewing the church's opposition to abortion? Second, future research could investigate whether some critical events such as prophetic stances have a greater or lesser influence on the evolution of the religious order workforce as compared to the diocesan priest labor market. Third, an analysis of clerical workforce patterns in other Catholic countries would represent an interesting test of the theory developed here, perhaps suggesting where the theory demands modification or revision. Taken together, these limitations challenge scholars to recognize the complexity of understanding trends in Catholic vocations across different societal contexts, personnel categories, and temporal horizons.
Against the backdrop of the uneven global distribution of the church's workforce noted earlier, the findings of this study point to a clerical labor force dilemma facing the Catholic Church, and this dilemma is a double one. In contexts where the workforce is declining, the church will likely become increasingly reliant on “imported” nonindigenous clerical labor and, in this scenario, runs the risk of further eroding the church's legitimacy by increasing the cultural distance between clergy and laity. This workforce dilemma may be particularly salient in the Catholic monopoly contexts included in this study as in these environments the historical congruence between Catholic commitment and ethnic identity means that cultural clashes between imported clergy and the Catholic laity would be more likely to arise. In national environments where the church is located in a more pluralistic religious setting, this workforce dilemma may be less salient, as in such contexts the church tends to rely less on appeals to national belonging in order to legitimize its organizational policies and practices (Dillon Reference Dillon1996).
At the same time, the flexibility of the Catholic workforce, and the church's ability to transfer it from one part of the world to another as the need arises, underscores the global, universal nature of the Catholic Church. Indeed, missionary activity is a defining feature of Catholic doctrine and practice. In the past, this “spiritual empire building” in Africa and Latin America relied on imported foreign clerical labor from Western Europe but as the church in this part of the world declines, a transnational countermissionary process is widely anticipated, and in some settings already underway, involving the mobility of clerical human resources from Africa to less personnel-rich parts of the church. Not to at least partially address these labor market shortages through global clerical mobility—alongside boosting native homegrown vocations—exposes the Catholic Church to the claim that its own proclaimed missionary imperative lacks legitimacy. Addressing this clerical labor force dilemma represents a significant future challenge facing the Catholic Church.
Acknowledgments
I thank Scott Schieman and anonymous reviewers for Sociology of Religion and Social Science History for their very insightful comments and suggestions on an earlier version of this article.