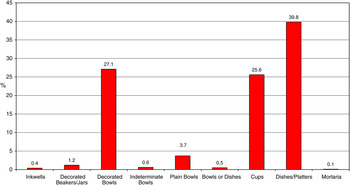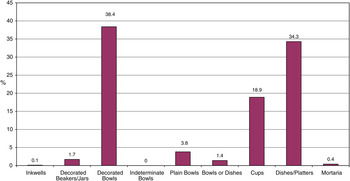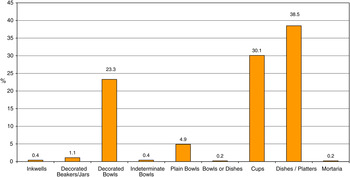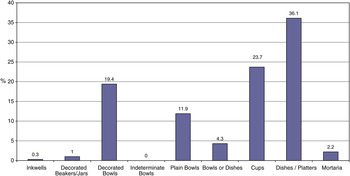


I. THE PROJECT
INTRODUCTION
This article presents the results of a survey of samian ware (terra sigillata) in Britain funded by English Heritage. The survey has considered aspects of the chronology, and social and economic distribution of the ware. This work builds upon earlier studies of samian in Britain also supported by English Heritage.Footnote 1 Samian ware is one of the most useful data sources for research into the Roman era (specifically for the first to third centuries a.d.), since its wide occurrence, standardised typology and close dating combine to make this material amenable to analytical studies. Analysis of the archaeological incidence of samian ware can reveal trends that provide distinct and enlightening perspectives on the nature of society and practice during the Roman era. Much of the data has been generated by the scholarly labours of the small group of samian ware specialists,Footnote 2 who through their day-to-day work have compiled a huge bank of identifications. This study has collated the existing knowledge of samian ware to ensure its fuller use.
The potential of samian ware has until recently been somewhat under-played, being routinely compartmentalised within site reports and other publications. There have been only limited opportunities in the past for the distillation of the archaeology of samian ware ‘beyond dating’ (albeit that the latter is vital for Roman studies). From several previous quantitative and comparative studies it was evident that there existed considerable scope for numerical and database analysis of samian ware.Footnote 3 This article explores the distribution of samian and its place within cultural assemblages as a key source of information that can be harnessed to shed light upon a series of aspects of Roman Britain. In turn the evidence from Roman Britain is placed within the context of the Western provinces of the Empire. This study has been conducted in light of broader themes in the archaeological investigation of the period, rather than being specific to samian ware studies.
SAMIAN WARE: DEFINITION, ARCHAEOLOGICAL UTILITY AND INTERNATIONAL SIGNIFICANCE
Samian was a mass-produced, good quality tableware with fine red glossy slip and, normally, a red fabric. It was produced at a number of centres in the Empire between the time of Augustus and the mid-third century a.d. Tony King, amongst others, has discussed the meaning of the terms ‘samian’ and ‘terra sigillata’.Footnote 4 Enduring, distinctive and indeed conspicuous, samian has long received attention from scholars. Concerted study means that knowledge of its typology and chronology, covering the various forms, its decoration and stamps, is now refined.Footnote 5 Samian is acknowledged to be a key tool for dating sites of the Roman era.
Of special significance is the wide spread of samian, for it was distributed across the Empire and beyond its boundaries. It occurs on all types of site, from major urban centres, like London, Verulamium, Rheims and Tongeren,Footnote 6 and Roman military/military related sites, for example, Castleford, Vindolanda and Vechten,Footnote 7 including canabae and coloniae, such as at Caerleon, York and Nijmegen,Footnote 8 to villas, such as Winterton (North Lincs.) and São Cucufate in the Alentejo,Footnote 9 and basic level rural sites as with Chells (Herts.), Forcegarth Pasture South (Durham) and Destelbergen (Flanders).Footnote 10 The output of individual workshops found its way to disparate locations; decorated bowls, for instance, made in the same mould may be found in different provinces.Footnote 11 Beyond the frontiers of Rome, samian occurs, for instance, in the Outer Hebrides, on Gotland in the Baltic, and in the Czech Republic.Footnote 12 It got to places; people wanted it and valued it, and there was quite evidently no social restriction on its distribution. Consistency of sources and typology, plus its ‘known’ chronology, link sites across Western and Central Europe in which it occurs; stratified instances of samian are, of course, especially important. This matrix of useful connections holds potential for refining dating and developing comparative studies of patterns of distribution, consumption, etc., from province to province. Samian is studied internationally and so research findings in one country will have an impact and value in others.
Samian has long provided a principal means for dating sites of the Roman era and site phases, being regularly recovered during excavations and via surface survey. Dickinson and Croom, for instance, in reporting on excavations at Hardknott (Cumbria) state: ‘The samian ware is of paramount importance in dating the occupation of the fort’.Footnote 13 The study of samian has gone hand-in-hand with the development of Roman studies in Britain and Europe. Understanding of this pottery in terms of typology and chronology grew through the course of the twentieth century, with a distinguished tradition of research and reporting. Inventories of potters and decorated items have formed a chronological spine to fieldwork reports. Equally samian has proved essential in the construction of a chronological framework for understanding the sequence of Roman Britain and the Western provinces through the early and middle Empire both directly and indirectly. It has greatly assisted in dating sites and contributed to establishing chronologies for other material culture (including coarse wares), which in turn are now instituted as firm dating indices.
EVOLUTION OF THE PROJECT
The ‘Samian Project’ has been funded by English Heritage over three stages. These elements encompassed: (i) Phase 1, a pilot survey;Footnote 14 (ii) preparation of an article communicating the results of the research to that point;Footnote 15 and (iii) Phase 2, undertaken part-time from September 2000 to December 2003,Footnote 16 representing the major element of the study. The present article builds on the results of that survey and places them within the framework of Roman studies.
A number of people have been helpful in facilitating the Project. Full acknowledgements are given elsewhere,Footnote 17 but thanks are extended here to the following. Professor Martin Millett played a key role in the initiation of the Project in the mid-1990s and drafted the original research design with the present author, and I am grateful to him for advice; Dr Pete Wilson, English Heritage, was helpful with administrative steering and in discussing issues. Several people supplied information in advance of publication; I am especially thankful to those involved with the Elms Farm Project. Dr Jerry Evans provided advice on methodology and project development. David Morgan of the ITS at Durham University assisted with Database 1.
AIMS AND OUTCOMES
The Project has aimed to make the best use of samian evidence as a key resource for exploring a range of issues in Roman archaeology, consistent with the research priorities of the study of the subject in Britain and the Western provinces.Footnote 18 This broader context provides a frame of reference for the study, as does the essence of Exploring Our Past Footnote 19 and the character and circumstances of current fieldwork.Footnote 20 The study gathered a large body of data and has employed straightforward, though hitherto under-utilised, methods in attempting to extract archaeological information from this material. Key areas of interest relate to dating (though this aspect is considered elsewhereFootnote 21), the distribution of samian through society, and aspects of its use in cultural practice. This paper therefore moves beyond the role of samian in providing ‘dates’, to exploit its high potential for elucidating features of cultural and economic life during the Roman era. Findings from analyses undertaken in such areas are published here: for instance, samian is viewed as a proportion of stratified assemblages and groups in order to define any trends in distribution between sites; the proportion of decorated ware within samian assemblages is examined and the possibility that this was a status indicator is considered; the composition of site samian assemblages by form types is made clear. The Internet Archaeology monograph provides a variety of samian data sets which are intended to provide a flexible resource where interested researchers can access a corpus of collated samian data from a range of sites across Britain, covering all periods, in addressing their own questions, or with which they may compare their own samian groups.Footnote 22
APPROACHES AND METHODS
In general surprisingly limited attention has been paid to the potential of samian ware for addressing a range of archaeological questions. Seminal studies by MillettFootnote 23 and MarshFootnote 24 undertaken in the late 1970s and early 1980s represent exceptions wherein samian information was collated and analysed taking a broad comparative perspective. These path-finding works were not subsequently developed by these or other researchers. Neither specialists, nor those reporting pottery assemblages overall, nor those responsible for site syntheses had time or inclination to pursue research of this nature. Several more recent publications have, however, shown either directly or implicitly how samian information might be used in various ways to shed light upon aspects of the character of, and activities at, sites in Roman Britain, though they have been based around specific site reports.Footnote 25 Concomitantly, the past 15 years or so have seen the appearance of several contributions highlighting methodological approaches and perspectives in the analysis of material culture that can enhance our understanding of the Roman era.Footnote 26 The present study applies similar approaches in considering aspects of samian distribution. Samian is especially amenable to analytical approaches, given its wide occurrence, its varied but well characterised and changing typology, and its comparatively close dating. Accordingly, a substantial number of site collections were systematically assessed, with a wide range of data gathered under a number of heads.Footnote 27 A principal aim has been to create a structured data set of types of samian information of use to those working in and researching the Roman era. A large spreadsheet format database (‘Database 1’) was created detailing the incidence of samian form and fabric types in 179 discrete and integral dated site groups compiled from a representative sample of assemblages from across England, complemented with some site data from Wales and Scotland. This database has an associated listing of these groups where typological and other details relating to group composition are given (‘Database 2’). These databases are published in the Internet Archaeology monograph.Footnote 28
One aim was to establish to what degree something approaching a ‘normal pattern’ or range of samian occurrence existed by time, region and site type. If such patterns exist this would be potentially useful, for specific site assemblages and stratified groups might then be compared with such ‘normal patterns’, thereby highlighting similarity or otherwise. The approach in this case is comparable to that previously established with success for the characterisation of Roman coin assemblages.Footnote 29
In considering samian evidence as an index of social and economic processes and practice, the intention has been to examine a variety of areas: samian and supply, samian and site status, samian at differing site types, the use of samian forms, and samian as an inclusion with burials. Topics such as repair of samian vessels, spatial analysis, samian in structured deposits and ritual, and samian and the study of site finds assemblages are examined elsewhere.Footnote 30 A range of methods has been adopted to engage with these substantive areas. Drawing on the data set, and the platform of existing knowledge of samian, the study identifies baseline trends in the evidence via a synthesising approach. Trends identified relate to fundamental aspects, such as the chronology of supply, the character of samian distribution, and consumption patterns at different site types. Since the occurrence of samian is equally as wide and significant across Western Europe as it is in Britain, the results of this Project are of international relevance, and a contribution to Roman studies beyond British shores.
THE STATUS OF SAMIAN WARE IN THE ROMAN ERA
That samian was considered different to other pottery types and particularly valued is apparent from a series of indicators. Samian was far more frequently repaired than other pottery types in Roman Britain, indicating that it was valued and worthy of the resources expended on repair.Footnote 31 Similarly samian shows a much greater tendency to be inscribed with graffiti than do other pottery types, demonstrating a concern to mark ownership: this pottery was worthy of possession.Footnote 32 Samian forms were also copied widely in Roman Britain amongst regional and local producers showing a level of interest in the ware and perhaps its customary uses.Footnote 33
Samian required considerable resources to produce and disperse to its consumer sites. If one follows a ‘labour theory of value’ approach, this is likely to have been a comparatively pricey commodity despite the economies of scale in its production. Samian vessels were indeed evidently costly purchases: a Drag. 37 of Cinnamus has a graffito pricing it at 20 asses, the approximate equivalent of one day's pay for a soldier, while a Ludowici Ta' plate has a graffito indicating a price of 12 asses.Footnote 34 Despite its potentially high cost samian permeated society in the provinces, suggesting that it was popular and even ‘required’ as an accoutrement of social interactions and display.
Almost invariably samian is the most prominent and frequent fine ware type encountered amongst site deposits dating between c. a.d. 50 and 250 in Britain. Amongst the assemblage from the 1980 excavations at Vindolanda, for instance, samian is the most frequent fine ware type throughout the sequence.Footnote 35
II. THE FREQUENCY OF SAMIAN AT DIFFERENT SITE TYPES
It has been established that the proportion of samian present within Roman pottery groups reflects the character of the site from which the groups derive.Footnote 36 This trend is examined here using a large sample. It is now clear that quantitative approaches to the composition of pottery assemblages and groups of the Roman period have greatly enhanced our understanding of patterns of supply and consumption.Footnote 37 They are now standard. With a sizeable number of site pottery assemblages now published in this way, the opportunity arises to undertake comparative analysis of the proportions of types and wares occurring, for example from site to site, between different site types, and, indeed, over time. Securing appropriate samples of quantified samian information from stratified deposits for like-with-like comparison is, though, not straightforward. The varying circumstances of material and assemblages and differences in approaches to its reporting mean that information on samian occurring at sites is published in a diversity of ways. Methods of quantifying samian for reports are not standardised. Identifying groups meeting the necessary criteria proved time consuming. Nonetheless, it has been possible to collect a large number of samples of data on the incidence of samian within stratified pottery groups.
It was decided to collect information on the presence of samian within groups by weight and EVE (Estimated Vessel Equivalents). These are two methods that are standard within Roman pottery work, being good measures of the comparative frequency of pottery types.Footnote 38 In most cases EVE is by rim equivalence (or RE). Amphorae were excluded from the analysis since they were primarily transport containers, and hence different from ‘kitchen and table’ pottery. In addition, their massive character gives rise to heavy sherds, while their narrow mouths allied to thick walls often result in rim sherds with uncommonly large proportions of rim circumference present. The sporadic presence of sherds of amphora in contexts can distort weight and EVE data.
One aim in assembling data on the proportions of samian present within pottery groups was to establish the degree to which these proportions reflect the character of the site from which the groups were recovered; character, that is, as established by other archaeological criteria, such as site size, layout, nature of structural elements, coin list, and so forth. As noted, several indicators show that samian was particularly prized and of some value, and that it had a distinct cultural resonance. The incidence of low or high proportions of the ware within stratified groups may thus be considered as an index of the status, exchange connections and identity of sites. Differences are to be expected in the composition of pottery assemblages from site to site for, as with other types of archaeological assemblages, they are the result of combinations of factors.Footnote 39 Amongst these variables, chronological period and site type might be expected to be important determinants of the composition of pottery groups and assemblages.Footnote 40 The samian samples are considered here in terms of these variables. In examining these collections, it is thought likely that the proportions of samian present within stratified groups are an approximate guide to the level of supply and consumption of samian ware at these sites. This is not to suggest that invariably the record at each site is a straightforward reflection of the use and relative importance of samian at the site; this relationship might, for instance, be skewed or impacted upon by rubbish disposal regimes and other practices around deposition.
Some 137 samples were collected where weight is the measure, and 97 by EVE (in some instances the same assemblage/group has provided both weight and EVE data). The majority of samples come from the main site types. Accordingly the data set is fairly balanced in terms of site type, particularly when weight is the measure. These sets of samples should provide a fairly robust and reliable guide to the relative frequency of samian at sites in Britain. The samples show a marked difference in the frequency of samian at both military sites and major civil centres on the one hand and, on the other, the smaller civil centres including ‘small towns’ and roadside settlements, rural sites and religious foci (mainly in the countryside, or settlement outskirts), where the frequency is very low. This pattern endures amongst individual groups independent of chronological period. Divergence from the general pattern is of interest, since such cases may highlight significant aspects of sites and require explanation.Footnote 41
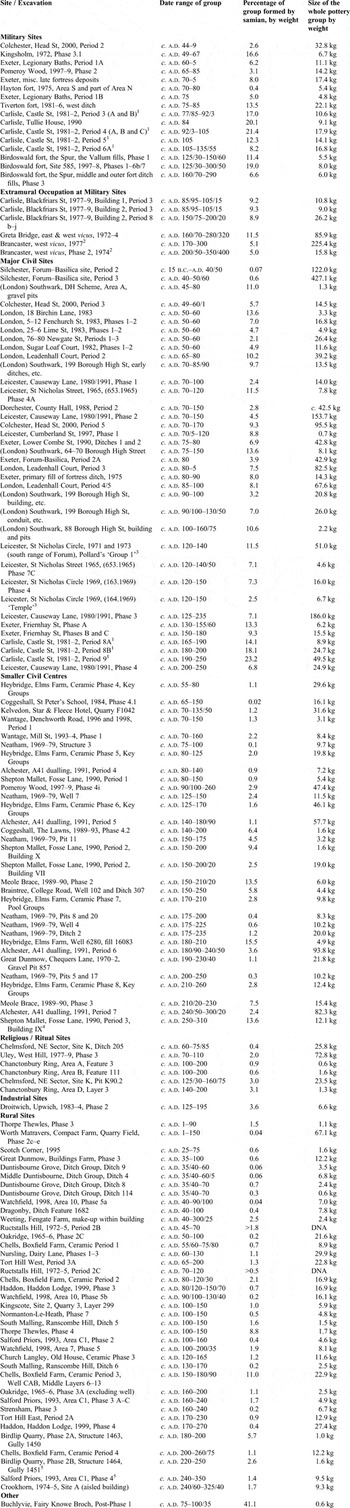
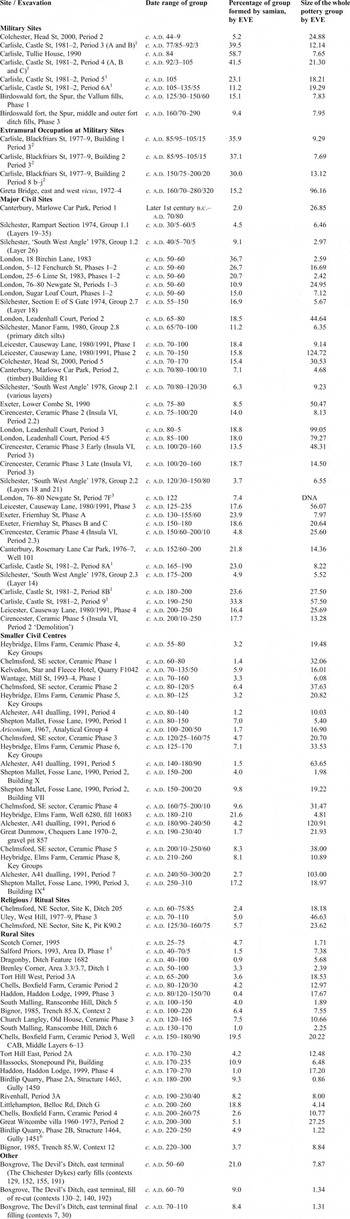
Table 1 catalogues the presence of samian within discrete site pottery groups, recording the percentage that samian forms within these groups by weight (references for the assemblages and groups listed here are given in Appendix 1, where contextual details are also recorded). The groups in the table are arranged by site type and in chronological order within each of these categories. Table 2 lists groups where EVE is the measure of the frequency of samian within groups; again the table is arranged chronologically by site type.Footnote 42 A rapid scan of these tables reveals a general pattern, whereby proportions of samian, i.e. its frequency, vary by site type. Comparison of these two tables shows that the frequency of samian within groups usually appears higher when EVE is the measure, when compared with measurement by weight. This is an anticipated outcome arising from the nature of samian as a fine ware, since fine ware pottery types tend to be thinner walled than many coarse wares, while samian cups and dishes, etc. weigh less than other pottery types. While all pottery forms have a maximum rim equivalence of 1.00 (that being 100 per cent of rim circumference), some forms weigh much more than others: samian vessels are rather light when considered beside other contemporary types and so measurement by weight, whilst very useful for inter-site comparisons, tends to depress the presence of samian in terms of proportions of pottery fabrics/vessels. Hence, the difference seen between Tables 1 and 2 is explained by the comparatively low weight to EVE ratio of samian vessels relative to many other pottery types.
SAMIAN AS A PERCENTAGE WITHIN POTTERY GROUPS BY WEIGHT, ARRANGED BY SITE TYPE AND IN CHRONOLOGICAL ORDER (excluding amphora)

Notes
DNA (under Sample Size) denotes that data was not available.
1 Identifiably residual sherds (i.e. items belonging to a vessel first represented in an earlier period) were excluded from the calculations relating to these groups by the reporter (Taylor Reference Taylor1991, 369).
2 The sequences and pottery from the 1974 and 1977 excavations could not be reliably divided into anything other than temporally broad phases. The figures here are those for each of the areas as a whole, though in the case of the 1974 area only data for the ‘second phase’ of activity in the Roman period is available. There is evidently a very modest amount of fourth-century pottery amongst the sample from 1977, but the excavator notes that occupation had essentially ceased in this vicinity from c. a.d. 300 (Hinchliffe with Sparey-Green Reference Hinchliffe and Sparey-Green1985, 181). There is proportionally more fourth-century pottery amongst the 1974 sample, relating to some activity in this vicinity (west of the 1977 area) at this time, though the assemblage as a whole is mainly of earlier date. The majority of the samian from the 1974 area was East Gaulish; c. 38 per cent of the samian recovered from the 1977 area was East Gaulish.
3 See Pollard Reference Pollard1994, table 8, part II.
4 A late group with an apparently high residual content of samian, included here for comparative purposes.
5 May include a re-deposited element.
For further notes on some of the groups appearing in this table, see Willis Reference Willis2005a, specifically the notes accompanying table 23.
SAMIAN AS A PERCENTAGE WITHIN POTTERY GROUPS BY EVE ARRANGED BY SITE TYPE AND IN CHRONOLOGICAL ORDER (excluding amphora)

Notes
DNA (under Sample Size) denotes that data was not available.
1 Quantification by EVE in these cases is evidently by rim only (RE). Identifiably residual rim sherds (that is items belonging to a vessel first represented in an earlier period) were excluded from the calculations relating to these groups by the reporter (Taylor Reference Taylor1991, 369).
2 Quantification by EVE in these cases is evidently by rim only (RE); procedural details are not stated in this report, though it seems likely given the quantities of pottery documented by count and weight, that only rims have been measured; moreover measurement of rims only was the method followed by the same author in the contemporary companion report (Taylor Reference Taylor1991, 336).
3 Deposits comprising fire debris from major fire dating to the early Hadrianic period; calculations may include amphorae.
4 Late group with apparently very high residual content of samian, included here for comparative purposes.
5 In this case the data relate to EVE measurements evidently including both rims and bases.
6 May include a re-deposited element.
THE FREQUENCY OF SAMIAN
Military sites
In considering samian from Roman military sites, there are 16 samples available by weight and 8 by EVE (Tables 1 and 2). It is a little surprising that quantified samples from military sites are not more commonly available, since such sites have over time been a particular focus for fieldwork.Footnote 43 This reflects in part the manner in which some pottery assemblages have been reported in the past, while there may also have been somewhat less excavation at military sites in recent decades when quantification has become more customary;Footnote 44 publication of those sites examined latterly on the northern frontier should ameliorate this situation. Considering the available data, it is apparent that Roman military sites show generally high levels of samian compared with other types of site.
The earliest samples from military sites come from the Claudian fortress at Colchester (Table 1), specifically the site at 29–39 Head Street.Footnote 45 The proportions of samian are quite low: 2.6 per cent by weight and 5.2 per cent by EVE. In fact these are the lowest proportions for any of the samples from military sites with the exception of Hayton (E Yorks.). The explanation for these comparatively low proportions probably lies in the nature of the area investigated, which is thought to be part of the fortress hospital. However, there is little in the way of comparative data available from contemporary military horizons in Britain, including Colchester, and it may be the case that during the early Claudian period supplies of samian to the military were at a lower level than they were later on. The samian from Rosalind Niblett's work at SheepenFootnote 46 might be taken as support for this interpretation, but since at this time the functional and perhaps cultural identity of Sheepen differed from that of the fortress, it may not be a particularly valid comparison. Nonetheless, the data presented in Table 1 suggest that samian may have formed relatively modest proportions of military assemblages in the Claudian–Neronian era (as at Exeter), but became more frequent from the Flavian period.
The low proportion of samian from the fort at Hayton (0.4 per cent by weight) is conspicuous. This may be a function of the nature of the areas of the fort — a section of a barrack block and part of the defences — from which the sample was collected. Spatial variations are likely to be a factor in group composition at most sites, especially forts, where a variety of differing functional and status milieux occurred within a confined area. The military installation at Pomeroy Wood (east Devon) also has a low level of samian (3.1 per cent by weight). This contrasts with much higher proportions from the fort at Tiverton (Devon), and from Kingsholm (Glos.), both similarly located in the South-West. Such variations might relate to supply arrangements or garrison, especially during the conquest era.Footnote 47 Both Hayton and Pomeroy Wood might be classified as ‘campaign forts’ which may be significant.
Tables 1 and 2 show that pottery groups from Birdoswald and Castle Street, Carlisle (Cumbria), have remarkably high proportions of samian present. This is a pattern that endures at these sites over time, suggesting a greater level of supply and consumption than at other sites, military or otherwise. It is possible that the group from a ditch section investigated below Tullie House in 1990Footnote 48 represents a structured deposit,Footnote 49 but this does not appear to be the case with the other samples from Carlisle. The samples from the Castle Street site lay within the military annexe attached to the Annetwell Street fort; it is possible that some fort annexes, or parts of annexes, were areas of higher status residence. If this were to be the case here it might perhaps partially explain the high levels of samian from dated horizons at the site, but this is not proven; evidence for stabling in the investigated area, for example, raises certain possibilities, but a fuller picture of the function(s) of the annexe is required before a firmer understanding is achieved.
Jeremy Evans has suggested that it is possible to discern several discrete supply zones of the Roman military in northern and western England.Footnote 50 It is possible that Carlisle and Birdoswald were part of the same zone: if so, it is one receiving high proportions of samian. It is likely, of course, that Carlisle was a strategic supply node for the western side of the Stanegate — Hadrian's Wall corridor and its hinterland — with samian arriving for redistribution; if so there was evidently a high level of turnover at this centre.
That Roman military sites show comparatively high levels of samian might be predicted given the articulation of such sites with wide exchange networks and the identity of the consumers, many of whom will have been familiar with Roman and provincial pottery forms, their use in eating and the etiquette of shared meals. Whether there were differences in the levels of consumption of samian at legionary sites as opposed to forts occupied by auxiliaries is an interesting question, but an answer will have to wait until more samples are available from a wider selection of sites. A study by Birgitta HoffmanFootnote 51 hints at greater consumption of samian by centurions, whilst graffiti point to individual and shared ownership by soldiers.Footnote 52 Further samples generally will improve our understanding of other aspects of supply to the military.
Extramural settlements outside military installations
Six samples by weight are available for extramural settlements and four by EVE (Tables 1 and 2). The six samples measured by weight, however, come from just three sites (Greta Bridge, Carlisle and Brancaster). The latter two sites are also those with EVE data available. The three groups from Carlisle come from the Blackfriars Street site and show a consistently high level of samian at around 9 per cent by weight, while data by EVE show that samian vessels account for around a third of the recovered pottery, which is a remarkably high proportion for a fine ware. At Greta Bridge (Durham), a sample extending from the late second into the fourth century included 15 per cent samian by EVE and 11.5 per cent by weight, again indicating a high level of samian consumption. Finally, the samples from both the west and the east vicus areas outside Brancaster fort (Norfolk) had proportions of samian by weight of 5 per cent; these proportions are fairly high, especially since here too the date-range of the samples extends into the late Roman period, by which time the supply of samian to Britain had tailed off. Data from these sites, combined with information from other extramural settlements, such as South ShieldsFootnote 53 and the canabae at Caerleon,Footnote 54 indicate fairly high levels of samian use at settlements of this character. Further, it is likely that the pottery forming the two samples from The Spur at Birdoswald, with their high levels of samian,Footnote 55 derive not from the fort but from the extramural settlement.Footnote 56 Of course this pattern of high levels of samian at vici may result from contrasting factors, site to site. Yet the nature of vici suggests that high levels of samian in such domains is to be expected: not only were such sites closely articulated with the exchange systems of the Empire via the road system and association with a fortress/fort, but additionally, a large proportion of their occupants are likely to have been accustomed to Roman practice and material culture. Vici would have included venues of entertainment and consumption for military officers and men, as well as shops, and may also have contained the households of soldiers' wives and families and, perhaps, alternative accommodation for officers and equestrians seeking respite from the fort(ress). Additionally, a proportion of occupants within vici are likely to have been traders, retailers, money lenders and others ‘on the make’, relatively affluent people with the accompanying domestic trappings of moderate wealth. The use of samian in such social environments is likely, and appears to be borne out by these samples. Eckardt has observed that there is a high incidence of drinking vessels amongst the glass items from the area of the fortress canabae at Balkerne Lane, Colchester, an occurrence that seems consistent with the picture emerging from the samian evidence.Footnote 57
Major civil sites
Some 37 samples are available for major civil settlements by weight and 35 by EVE. These sites include London, and its Southwark suburb, Canterbury, Carlisle, Colchester, Dorchester, Exeter, Leicester and Silchester. These sites are broadly similar in urban character, though the degree to which they differed should not be under-estimated. On the whole they have relatively high proportions of samian; for instance, the majority have levels greater than 7 per cent by weight. By EVE samian formed between 10 and 20 per cent of the pottery from these major civil centres during the early and mid-Roman periods; in other words, these data imply that 1 in 6, or 1 in 5, vessels in use at these sites was a samian item. The three lowest levels recorded here are associated with Silchester from periods pre-dating a.d. 60, and Canterbury before c. a.d. 70/80. These low levels probably reflect the somewhat smaller scale of samian being imported into Britain in the years before c. a.d. 70, and perhaps also their identity as major centres of the pre-Roman era, for at such sites imported Gallo-Belgic pottery typically continues to dominate fine ware assemblages (rather than samian) in the era before c. a.d. 60, apparently reflecting a cultural preference amongst indigenous consumers.Footnote 58
The percentage of samian (5.7 per cent) amongst deposits relating to the early colonia at Colchester places it, interestingly, in the middle of the percentages for contemporary sites in Roman London and Southwark. Samples from London and Southwark generally display particularly high percentages of samian through the second half of the first century and into the second century (often over 10 per cent by weight). This presumably reflects both the status of this centre and the identities of its populations, as well as its function as an entry point for samian shipments, as attested by warehousing and other indicators.Footnote 59 Samian from the Regis House site is accepted as a warehouse deposit, while at the riverside site at New Fresh Wharf samian accounts for an extraordinary c. 63 per cent of all the Roman pottery recovered, as calculated by EVE.Footnote 60 Excavations at Wellington Row, York (1987–91), on the south bank of the Ouse, similarly yielded some strikingly high proportions of samian, in this case though dating to the late second century and, perhaps, the early third century;Footnote 61 this material, much of it in large pieces, comes from levels associated with a substantial building. Given the proximity of the waterfront, it has been speculated that the material relates to a warehouse deposit, or discarded stock or cargo.Footnote 62
An exception to the general picture in London is a sample from 76–80 Newgate Street dating to c. a.d. 50–60.Footnote 63 In this case the relative frequency of samian was low at 2 per cent. The site lies on the western side of the city in an area some distance from the core of the settlement, and where early development was perhaps relatively unplanned and incremental. Significantly, the sample came from a phase including buildings in the vernacular roundhouse tradition implying indigenous migrants to the embryonic city.Footnote 64 Hence, it is conceivable that these occupants were less able to afford samian and/or were less interested in acquiring it than were other city-dwellers.
Three other samples with low proportions of samian occur, specifically at Dorchester, Canterbury and Leicester. Amongst the pottery from Period 2 at the County Hall site, Dorchester, samian amounts to just 2.8 per cent. One explanation for this low frequency is the liminal nature of the site at this time, away from the hub of the settlement. Indeed, during Period 2a ditches likely to be field boundaries were encountered, while during Period 2b a street was laid across the area, but with no indication of associated buildings. At Canterbury, the Marlowe Car Park site (Period 2) shows a low frequency of samian, which may be attributed to the fact that the area was a suburb at this time, used more for cultivation than occupation.Footnote 65 In contrast, while a sample of Hadrianic–early Antonine date from St Nicholas Circle, Leicester, has a similarly low percentage of samian (2.5 per cent by weight), the sample is from the heart of the Roman city and is associated with a likely public building which may be a temple.Footnote 66 As noted elsewhere religious sites are often associated with low levels of samian.Footnote 67 Three groups covering the late second and first half of the third centuries stand out as having noticeably high levels of samian. Again these are from Carlisle, indicating a sustained supply and turnover of samian despite its change to civil occupation at this time.Footnote 68
Smaller civil sites
There has been a rapid expansion in our knowledge of smaller civil centres of the Roman period in recent years through publication and fieldwork. Sites allocated to this category include ‘small towns’, roadside settlements and smaller ‘centres’, such as Heybridge, Elms Farm (Essex), a site combining local marketing and religious functions.Footnote 69 As with the major civil centres, the more that has been learnt about these sites of ‘middle rank’, the more apparent it is that they encompass a variety and are far from being a homogeneous category.Footnote 70 Many, nonetheless, share a series of characteristics and their grouping is not inappropriate. Some 31 samples were collected from sites in this category where weight is the measure, with 22 samples available by EVE. To these may be added two samples arising from systematic surface collection at the smaller centre and industrial site at Ariconium (Herefords.), quantified by EVE. Amongst one group (collected in 1986) — with a date range of c. 70 b.c.–a.d. 400 and EVE of 6.10 — 4.9 per cent of the pottery was samian, while amongst a further collected group from a different area of the same field pottery with the same date range (EVE total 13.09) had a level of 3 per cent samian.Footnote 71 These figures are in agreement with the general picture emerging from the data in Table 2.
Reference to Table 1 shows that by weight samian forms modest and often very low proportions within groups from these sites. Equally by EVE (Table 2) proportions of samian within groups are moderate to low, with only two groups (out of 22) having percentages for samian above 10 per cent — one of these is a structured deposit and the other is abnormal (see below). The percentages are particularly low amongst groups of first-century a.d. date. This is of interest, since other indicators also suggest that sites of this type did not begin to flourish before the end of the first century. Samples of second-century date from a range of sites show significantly higher proportions of samian, and this is especially so with samples of mid- and late second-century date. This trend probably reflects, in part, the increasing economic vitality of these sites during the second century and the fact that samian imports into Britain evidently rose during the early to mid-Antonine period. Yet, one or two sites are conspicuous when seen beside the general trend. The ‘small town' at Neatham (Hants.) has consistently very low proportions of samian amongst its quantified groups — as does, generally, Heybridge, Elms Farm — independent of date. Overall, to judge from the samian evidence from the conquest period, the latter site appears to be one of only moderate local significance despite the remarkable pre-conquest imports.Footnote 72
Quantification of the pottery from the extensive excavations at Elms Farm enables more data on the relative frequency of samian at this site to be presented.Footnote 73 Amongst 32 groups from this site measured by weight, three-quarters have percentages for samian at less than 3 per cent, while by EVE around a third of the 27 groups in this category register percentages for samian of over 10 per cent.Footnote 74 There is one group with a very high proportion of samian, namely that from Well 6280 (fill 16083) with 15.5 per cent samian by weight (c. 20 per cent by EVE); this is undoubtedly a structured deposit which has involved the selective inclusion of samian vessels.
In contrast, two samples from Meole Brace (Shrops.) have high proportions, of a level similar to that of the major civil centres. The site lies west of Wroxeter, adjacent to the Roman road to/from mid-Wales. It is not clear why these proportions are conspicuously high, but explanation may lie in the fact that whilst there was a regional tradition of using ceramics, this was not on any scale and so coarsewares for cooking and storing at this site may have been fewer than was normal in other regions.Footnote 75 Samples from Fosse Lane, Shepton Mallet (Somerset) show varying levels of samian; two groups have high percentages of samian by weight (where one is a late group) compared with the others. These variations seen at Shepton Mallet are doubtless associated in large part with specific functional or status differences between areas or buildings. One group contained a notably high percentage of samian — this being 17 per cent by EVE — from Building IX (iv), Period 3, though this is seemingly a residual assemblage from a building (with painted wall plaster) that may have been multi-functional. Heybridge, Elms Farm and Shepton Mallet emphasise the value of acquiring multiple samples from sites, wherever possible, in order to develop a nuanced archaeological picture across a site.
Coggeshall (Essex) is a site that can be assigned to the ‘smaller civil centre’ category, but the two samples from the site illustrate the fact that their circumstances and context have to be considered in evaluating results. The small group from The Lawns is associated with a building (or buildings) probably lying within its own compound, adjacent to Stane Street. Dressel 20 and Italian wine amphora sherds also occur in this phase.Footnote 76 It has been suggested that the building(s) is possibly a mansio or villa.Footnote 77 In contrast, the sample from St Peter's School (1984), Phase 4.1, derives from trackside ditches and associated gullies, relating to land organisation on the edge of the Roman settlement. No contemporary structures were identified within the excavated area, while sherds from five near-complete vessels account for some 55 per cent of this group by weight, their strong presence depressing the representation of samian. Hence, both samples from Coggeshall may be unrepresentative of the consumption of samian at this site as a whole, and its relative frequency. Similarly, at Wantage (Oxon.)Footnote 78 the excavations at Mill Street, 1993–4, Phase 1, examined ditches interpreted as being associated with agricultural production; occupation was presumed to occur near by. Not surprisingly, samian accounted for a low proportion of the recovered pottery (c. 2 per cent by weight). (It has been observed that Wantage may be considered an example of the ‘fuzziness’ in the distinction of a smaller centre and a rural settlement.) It is possible that sites on the periphery of major and smaller civil centres will yield pottery assemblages more akin to rural sites.
It is worth noting that whilst the ‘small towns’ and roadside settlements forming this data set are associated with generally low levels of samian, many of them lay on main arterial roads between major centres, which themselves have high levels of samian. This is the case, for instance, with: Neatham, lying on the road between Chichester and Silchester; Kelvedon, on the road between London and Colchester; Braintree, Coggeshall and Great Dunmow, on the road between Colchester and Verulamium; Shepton Mallet, between Bath/Cirencester and Ilchester; and Alchester, between Verulamium and Cirencester. Evidently large and frequent quantities of samian ware would have passed through smaller civil centres across the province on the way to the major towns. However, the data suggest that comparatively little was acquired by the inhabitants of the smaller civil centres as this fine ware passed on its way. Evidently, samian was ‘pulled-in’ to the civitas-capitals and other major centres. This phenomenon has implications for our understanding of interpretative concepts of the Roman era, such as ‘connectivity’.Footnote 79 Furthermore, something of the organisation of the samian trade might be suggested by this pattern: this fine ware travelled as consignments to merchants and traders based at major centres, which then acted as main points of marketing and redistribution. The comparatively high proportions of samian at major civil centres and low percentages at smaller civil centres imply that the pattern of consumption of this ware follows the settlement hierarchy or the identity and ‘taste’ of consumers.
Religious / ritual sites
Temples and religious locations generally show a low frequency of associated samian, but indicate some level of use of the ware in and around such sites. Samian from sites in this category has been discussed elsewhere.Footnote 80 Overall, the level of use/consumption of samian ware at these locations is ostensibly similar to that at smaller centres and rural sites. Perhaps an exception is the temple site at Great Chesterford (Essex),Footnote 81 where sample excavations in the precinct brought forth a total of 749 samian sherds.Footnote 82
Rural sites (including villas)
There are 39 samples available showing samian as a percentage by weight and 22 by EVE. By weight there is an emphatic pattern: samian constitutes only tiny proportions of pottery groups from rural sites. This is a constant pattern independent of geography and time (Table 1). By EVE the majority of the groups register less than 5 per cent samian. In only six of the 39 samples by weight does samian account for more than 2 per cent of the group, and in three of these the percentages are under 3 per cent. Of the remaining three groups, one is from Birdlip Quarry (Glos.) (Phase 2A, Structure 1463, gully 1450), associated with domestic occupation, where the samian is 5.7 per cent by weight, while another is from Thorpe Thewles (Durham) (Phase 4) where it is 8.8 per cent by weight. In the case of the latter site the ‘high’ proportion of samian probably arises from the incidence of a moderate amount of samian in a region where there was a traditional pattern of low absolute quantities of pottery being deposited (and here the group is just 1.7 kg in total). The location of the Birdlip Quarry site on the main Roman road between Cirencester and Gloucester, in a region with abundant Roman material culture, means that there was no problem of access to samian; nonetheless, the site inhabitants had still to be inclined to acquire and use it. It is noteworthy that these higher proportions of samian are associated with apparent domestic buildings, often of vernacular circular tradition.Footnote 83 The building at Weeting (Norfolk) (2.5 per cent samian by weight) was rectangular, and was thought to be a barn rather than a domestic structure,Footnote 84 though it had a range of aspects indicative of occupation.
Amongst the data by EVE, some of the highest percentages for samian come from high-status sites, such as Bignor, Great Witcombe villa, the building at Stonepound Pit, Hassocks and Rivenhall (Table 2). The site group with the highest proportion of samian by weight and EVE in this category is that from a well at Boxfield Farm, Chells (Herts.) (Ceramic Period 3, Well CAB, Middle Layers 6–13) of Antonine date. In this group samian accounts for 11 per cent of the pottery by weight and 19.5 per cent by EVE. However, the group is a structured deposit (comprising selected and perhaps symbolic components) or contains elements of such a deposit, which included c. 26 complete, almost complete or semi-complete samian and non-samian vessels. The sample from Littlehampton, Belloc Road, Ditch G (W Sussex), whilst only small, at 4.14 EVE, is equally unusual. Samian amounts to almost 19 per cent of this pottery group by EVE. Lyne comments that: ‘The fine and specialized wares … make up an unusually high 54.8 per cent of all the pottery, …’.Footnote 85 The explanation for these high proportions is unclear and it is unfortunate that a greater area of the site could not be revealed. The general pattern amongst these samples is also reflected at the Flemish rural sites at Destelbergen, near Ghent, and Smeermaas, Lanaken. At Destelbergen, samian — from a sizeable pit assemblage dating to the early second century — accounts for 4.3 per cent of the pottery by the number of vessels represented within a total group size of 327 vessels, while at Smeermaas — a site with a stone cellar and hypocaust, but no record of a masonry house — samian amounted to 3 per cent of the pottery by sherd count and 6.4 per cent by number of vessels represented, of a total of 421 vessels.Footnote 86
As with all sites, the feature/context from which the sample is derived will affect its composition.Footnote 87 Under the category of ‘rural sites’ there are samples from within and around domestic buildings, while others come from fields, perhaps some distance from domestic environments.Footnote 88 In such cases location may be important in terms of the amount of samian likely to be in use in particular milieux and potentially entering the archaeological record. In other words, it is important to establish whether samples come from ‘rural occupation’ or ‘rural landscape’ features.
The consistent paucity of samian at rural sites contrasts with the regular selection of samian for inclusion with burials and ritual ‘offerings’ in rural environments (see below). It should not be overlooked that samian, whilst present in meagre proportions, is nonetheless virtually universally present at rural sites. Evidently there was no social or cultural constraint upon its acquisition by rural populations; it cannot have been an uncommon sight in the countryside.
THE FREQUENCY OF SAMIAN AT DIFFERENT SITE TYPES: SUMMARY AND DISCUSSION
In an earlier review Fulford and Huddleston wrote, ‘ … we know very little about … the relative abundance, and the distribution within Britain, of samian in comparison with other wares’.Footnote 89 This, with the collation of samples for this study, is now no longer the case. It is apparent that there is a structured pattern to the relative frequency of samian at sites in Britain and that site type is a major determinant of levels of consumption. There is a pronounced division between the patterns seen amongst samples associated with the Roman military and from the major towns on the one hand, and smaller centres including ‘small towns’ and roadside settlements and all types of rural sites on the other (that is, where the bulk of the population lived). One interesting aspect to emerge is that samian is often relatively more frequent within extramural sites outside forts and fortresses than within these establishments. It is also apparent that samian is more frequent at military sites than at the major civil centres.
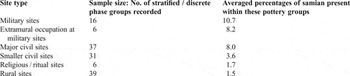
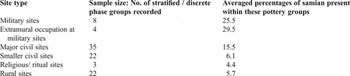
Tables 3 and 4 summarise the data collected in Tables 1 and 2 by employing the ‘short cut’ of averaging the percentages of samian presence per group by site type. This summary approach amalgamates the groups by site type independent of date, location or context, but in doing so clarifies the differences in supply and consumption between the categories of site, which is instructive. It is perhaps not inconsistent with what might have been predicted, but this type of data presentation demonstrates trends very clearly. Table 4 using EVE shows that the average proportion formed by samian present within groups from military sites amounts to c. 25 per cent of the pottery, while from extramural sites, these data suggest an even greater frequency of samian, at about 1 in 3 vessels; a greater number of samples from sites of this type might verify such a high frequency. By this method too, the average frequency for samian at major civil centres is 15.5 per cent. For the smaller centres, religious foci and rural sites the averaged proportions are much lower. Overall, the general pattern to emerge from Table 4 is consistent with that of Table 3, indicating that they are a broad guide to the relative frequency of samian by site type.
AVERAGED PERCENTAGES OF SAMIAN BY WEIGHT WITHIN STRATIFIED/DISCRETE POTTERY GROUPS FROM DIFFERENT SITE TYPES (based on Table 1)

AVERAGED PERCENTAGES OF SAMIAN BY EVE WITHIN STRATIFIED/DISCRETE POTTERY GROUPS FROM DIFFERENT SITE TYPES (source: Table 2)

Inevitably, scrutiny of site groups reveals some differences between certain sites within the same category and this may potentially be illuminating when investigated further. Each individual group can now be compared with the ‘norm’ for the site-type category to which it belongs, highlighting any deviations from the general trend. Distinction of the main trends, however, is of principal significance. That comparatively high proportions of samian are associated with major civil centres and low percentages with smaller civil centres and rural sites may be seen as reflecting the ability and interest of inhabitants of the major towns in acquiring fine tableware as a status indicator and as a statement of cultural affinity (since so many aspects of samian ware connect it to the Mediterranean/Roman core). Conversely, a conventional interpretation of consistently low proportions of samian at the smaller centres and rural sites would be that the people living at these sites could not so readily afford such vessels (which will have been somewhat more expensive than other pottery types) and were less concerned to invest in them as a display of status at communal meals or as expressions of ‘Romanitas’. Indeed, Evans has shown that pottery assemblages from rural sites become markedly utilitarian, with little apparent use of pottery for status display, from about the mid-second century.Footnote 90 However, several indicators point strongly to the likelihood that samian was not disregarded by the inhabitants of smaller centres and rural sites, but rather that it was valued and treated in a distinctive manner:
(i) Samian, including decorated forms, seems to have been acquired in the conquest era at numerous rural sites (though in small quantities) where it shows as a floruit.Footnote 91
(ii) Samian is prominent amongst grave groups associated with smaller centres and rural sites (i.e. in South-East Britain; other rural areas of Roman Britain do not have an identifiable burial tradition at this time).
(iii) Samian is often prominent amongst structured deposits at such sites, occurring in wells and other selected groups. This is all the more conspicuous given its low proportions from other context types.
(iv) There is, perhaps surprisingly, a strong tendency for unusual samian forms to occur at rural sites.
These aspects indicate that whilst samian is not a very frequent find amongst stratified pottery assemblages at settlement sites in the middle and lower end of the settlement structure, it was nonetheless evidently ‘prized’ by communities at such sites and treated differently from other pottery types, being employed in a number of ways that relate to status passages and ‘events’. Such uses marked samian as of special significance. It may well be that samian was more prominent in the lives of people living in smaller centres and rural sites than the nature of the archaeological record can directly reveal. Samian may, for instance, have been employed regularly or periodically in normal domestic life, but if vessels were carefully curated, there would be, accordingly, ‘less turnover’, resulting in only small proportions appearing within stratified groups from such sites.
Overall the data show that samian was markedly more frequent at the major civil centres and at military sites. These sites are likely to have been the main recipients of bulk deliveries of this specialist fine ware and it was at these sites that the quickest turnover of samian occurred. They also yield evidence of its commercial retail at major urban centres, as at Colchester and Wroxeter.
III. PATTERNS IN THE DISTRIBUTION OF DECORATED SAMIAN VESSELS
Proportions of decorated vessels, as opposed to plain forms, amongst samian assemblages also vary according to site type.Footnote 92 This project has enabled a large sample of data from assemblages/groups to be collected in order to examine trends in this area. This is a response to Hartley's call ‘for statistics for a wide range of types of site’ in order to explore the question as to whether relative proportions of decorated to plain samian at sites reflect their status and identity.Footnote 93 Decorated samian forms comprise mainly bowls, together with occasional beakers and jars, plus some other much rarer forms.Footnote 94 These bowls are the large familiar forms: the carinated Drag. 29 of the first century a.d.; the hemispherical Drag. 37, dating from the Flavian period to the end of the samian industries in the third century; and the cylindrical Drag. 30, which, though less common, spanned the whole of the manufacturing period from the early first century a.d.
How samian vessels may have been regarded in the past has until recently not been explored systematically. Archaeologists studying the Roman era have consistently regarded — or rather, presumed — decorated samian vessels to have been comparatively valued items amongst the Roman pottery repertoire, and more valued than plain samian forms. Hence, the decorated forms are typically seen as an index of wealth and status (good living!), but without explanation as to why this may have been so. These perceptions have been discussed recently elsewhere,Footnote 95 where it was concluded that there are several firm reasons for suspecting that decorated vessels would have been more expensive and more prized than other vessel types, including plain samian. Decorated vessels will have been more expensive in terms of resources, to both produce and transport, than was the case with plain forms. Evidence from two instances of graffiti regarding cost has been noted above. Thus one would predict that larger proportions of samian assemblages would comprise decorated bowls at those sites where there was greater wealth and disposable income, or ascribed status that might accrue gifts. Further, when one considers the widespread emulation or ‘imitation’ of samian forms undertaken by local potters in Britain and the North-West provinces, it is apparent that it is normally the decorated forms that are reproduced with greatest frequency in local fabrics, not the plain ware forms.Footnote 96 Hence there are grounds for considering decorated samian vessels to be good indicators of personal status, site status and site identity within some, if not all, social milieux.Footnote 97
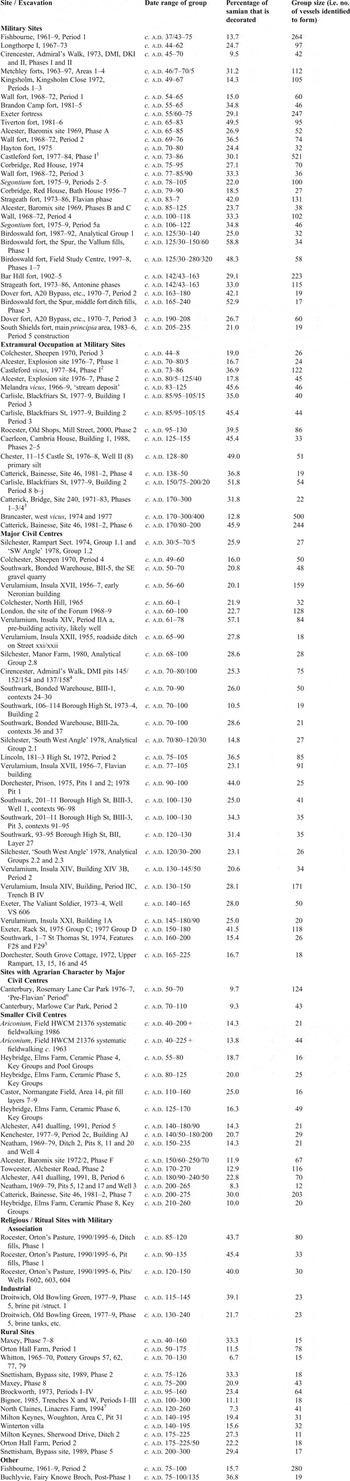
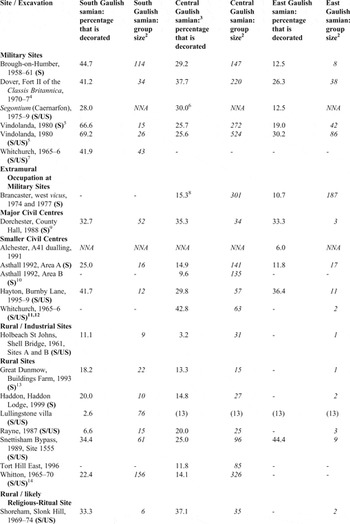
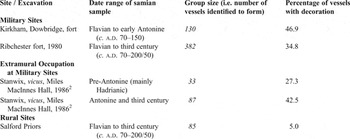
The present study, building upon previous work, identifies strong trends in the incidence of decorated forms across a variety of sites in Britain.Footnote 98 These trends evidently indicate if not differential access to these ceramic types, then consistent patterning in their consumption relating to site type. Table 5A records the percentages of decorated vessels amongst samian assemblages at various site types by stratified/dated group; the various production centre sources of the samian are not discriminated in this exercise. Quantification in this case is via number of vessels represented. EVE data might be considered a preferable means of comparison, but requisite information on EVE values per form type by period is not yet available within publications in any number. Table 5A is supplemented by two further tables in cases where the samian is reported in publications not by site phase/group, but rather by (i) fabric type (Table 5B) or (ii) date of the samian (Table 5C). The total number of samples by stratified/dated group amounts to 110, supplemented by 27 further groups where the data are recorded in a differing manner.
PERCENTAGES OF DECORATED VESSELS AMONGST SAMIAN ASSEMBLAGES AT VARIOUS SITE TYPES, BY STRATIFIED / DATED GROUP (quantification by number of vessels represented)

Notes
1 The total of 521 vessels excludes 7 vessels from Central Gaul understood to be intrusive.
2 The total of 122 vessels excludes 16 vessels from Central and Eastern Gaul, understood to be intrusive.
3 From c. a.d. 200 this site is thought likely to be civilian.
4 This group is thought to have been deposited at a time after the departure of the Roman military from this site, though much of the samian pottery within the group itself is believed to relate more to the military phase than to the subsequent proto-town.
5 F28 and F29 represent two pits with apparent structured deposits within.
6 The sample comes from a ditch; this deposit could be related to military occupation at this time; 8 intrusive items have been removed from this calculation.
7 The group is a site collection and so may include a proportion of unstratified samian. This is the ‘maximum’ date range for the stratification.
PERCENTAGES OF DECORATED VESSELS AMONGST SAMIAN ASSEMBLAGES AT VARIOUS SITES, BY SAMIAN FABRIC TYPE, INDEPENDENT OF PHASE1 (quantification by number of vessels represented)

Notes
(S) Denotes that the sample includes all stratified samian from the excavations.
(S/US) Denotes that the sample includes all the stratified and unstratified samian from the excavations. NNA denotes that the number is not available.
1 These data mainly derive from published assemblages that are not divided in the published report by phase, group or dated horizon.
2 Group size specifies the number of vessels identified to form.
3 For number of vessels from Les Martres amongst the Central Gaulish totals, see Willis 2005a.
4 Sample includes all stratified samian from deposits associated with the ‘CL. BR. II Fort’ c. a.d. 130/140–270 (i.e. from Periods I–III, plus ‘soil over final rubble’). The South Gaulish samian is presumed to be residual.
5 The areas investigated in 1980 lay principally within the military forts and annexe.
6 This is the percentage for Lezoux vessels only.
7 The South Gaulish samian here approximates to the military episode at this site.
8 There is one early (i.e. pre c. a.d. 120) vessel from Lezoux from this site; this plain vessel is not included in the data forming the table.
9 The sample represents all stratified items from site Periods 2–5.
10 Data exclude 1 vessel from Vichy.
11 The Central and East Gaulish samian here approximates to the civil episode at this site.
12 Data exclude 1 vessel of early Lezoux ware.
13 Only combined figures for Central and East Gaulish ware are available: of a total of 311 vessels of Central and East Gaulish ware recorded, only 12.9 per cent are decorated vessels.
14 The tally of 482 is something of a ‘maximum number of vessels’ total (Webster 1981, 102), especially with regard to the plain forms, though in the case of decorated items it is more likely that sherds from the same vessel have been recognised independent of context, thus resulting in some comparative ‘over-representation’ of numbers of plain forms.
PERCENTAGES OF DECORATED VESSELS AMONGST SAMIAN ASSEMBLAGES AT VARIOUS SITES, BY BROAD DATE OF THE SAMIAN POTTERY, WHERE ONLY DATA TO THIS LEVEL IS AVAILABLE (quantification by number of vessels represented)1

Notes
1 Includes all the samian from each site, of the date range specified, identifiable to form.
2 Finds derive from systematic professional recovery of material during ‘watching brief’ and spoil scanning; material is essentially unstratified.
Although there are now data samples of this type available for all the main categories of site in some number, the total of samples for rural sites is comparatively low. Rural sites are under-represented for various reasons,Footnote 99 but in part this is because contract archaeology tends to result in limited sampling of rural sites and hence the recovery of numerically small pottery groups. Table 6 summarises the general frequency of decorated samian by site type, based upon the data collected by this Project. In this case, the percentages of decorated samian within each site sample are averaged to generate a rough guide to the general frequency for each site type. The general pattern is clear: samian groups from military sites and major civil centres have above average proportions of decorated vessels present. The ‘small towns’, roadside settlements and rural sites have much lower average percentages. The overall ratio figure for the frequency of decorated samian vessels, including all 110 sites, is around 1 in every 4 vessels; the total number of vessels in the sample was 7,414.
AVERAGED PERCENTAGES OF DECORATED VESSELS WITHIN SITE SAMIAN GROUPS FROM DIFFERENT SITE TYPES IN BRITAIN, FIRST TO THIRD CENTURIES A.D. (source: Table 5A; quantification by number of vessels)

THE MANUFACTURE OF DECORATED SAMIAN VESSELS: CHRONOLOGICAL TRENDS
The output of the samian manufacturing centres over time is, of course, a potential key variable when considering relative proportions of form types. As noted elsewhere,Footnote 100 it seems likely that proportionately fewer decorated bowls were being produced in Southern Gaul around the mid-first century a.d. than was the case both later in the first century, or indeed, at Lezoux during much of the second century. The earliest groups amongst the sample presented in Table 5A appear to confirm this phenomenon. Of those groups from military sites there are only five cases in which the percentage of decorated ware present is less than 20 per cent, and four of these occur amongst the six earliest groups, with a Claudian or early Neronian start date. They comprise groups from Cirencester, Fishbourne, Kingsholm and Wall. Turning to the groups from extramural occupation outside military sites, there is one of Claudian date, from Sheepen, Colchester (Period 3), and this has a low proportion of decorated samian (at 19 per cent) compared with other sample groups from this type of site. The five earliest groups from major civil centres appearing in Table 5A, dating around the mid-first century a.d., also show relatively low proportions for decorated samian when compared with the later groups from this category of site. These data appear to indicate that the supply of decorated samian to Britain during the period c. a.d. 40–60 was lower than during the Flavian era.
It seems clear that towards the end of the second century a.d. and into the third century decorated forms (essentially bowls) again become somewhat less frequent.Footnote 101 The East Gaulish samian kilns of the later second and third centuries are understood to have produced less decorated ware than did the other centres, but there seems also to have been a relative decline in the proportion of decorated bowls being produced at Lezoux (Central Gaul) in the later second century. Such vessels required more preparation and application than others in the repertoire; other indicators suggest standards of production were not as high as at other times and so a fall in the proportion of decorated bowls being produced may be a related aspect. Could price have contributed to this trend, with the market price per bowl increasing as they were less available, or did a decline in quality result in lower prices? Was the market determining this? It is also possible that the market (consumers) was not so interested in acquiring these forms; the role they had performed may have related to a fashion that was losing popularity. The early third-century group from South Shields and those from the west vicus at Brancaster potentially hint at this trend, as does the latest group from a major civil centre, namely Dorchester (Tables 5A and 5B). Low proportions of decorated vessels also occur in the early third-century groups from Neatham and Heybridge, Elms Farm (Table 5A). At Segontium there is a low percentage of decorated samian vessels from East Gaul (Table 5B), where they account for just 12.5 per cent of the samian from this source (compared with percentages for decorated vessels of 28 per cent and 30 per cent in the case of the South and Central Gaulish sources). A similar situation is apparent amongst the large assemblage of samian from the canabae at Caerleon, where East Gaulish bowls are conspicuously infrequent.Footnote 102 At Catterick, however, three groups, two from Bainesse Site 46 and one from the Bridge, Site 240, of late second- or third-century date are at variance with the general trend, displaying sustained high levels for decorated forms (Table 5A). This may be taken as further indication that the Catterick complex was of considerable significance at this time.Footnote 103
Evidence from samian assemblages on the Continent suggests that these trends in the frequency of decorated samian vessels over time are part of a broad picture, reflecting changes in the balance of output by the samian production centres, rather than being specifically related to the supply of samian to Britain.
THE RELATIVE FREQUENCY OF DECORATED SAMIAN VESSELS
Military sites
The sample of 30 groups from military sites in Table 5A suggests that the average proportion of decorated vessels present amongst such groups is around 30 per cent. This figure emerges from averaging the percentage totals for decorated vessels amongst these 30 groups, as well as from establishing the medial percentage, which is 29 per cent; with 14 groups having a percentage lower than 29 per cent and 14 a higher total. The range of percentage totals for decorated vessels amongst these 30 site groups is wide, but the majority of groups register between 24 and 26 per cent at a minimum. An explanation for some of the lower percentages amongst these sites in the mid-first century a.d. is suggested above, and the only remaining group with a percentage of less than 20 per cent is the group from the bath-house at Corbridge, Red House, where the specific function of the area may be a factor. In contrast, Dickinson in considering the samian from the fort at Ribchester states that: ‘One of the most striking features of this assemblage is the unusually high proportion of decorated ware, averaging over 30%, the same holding true for the areas excavated between 1968 and 1980’.Footnote 104 The percentage from the excavation of 1980 at this site is 35 per cent (Table 5C). Compared with the data set assembled here the percentage is high, but falls at the top end of the range of the majority of groups in the sample of 24–35 per cent decorated.
There are a few groups with percentages for decorated types over 40 per cent (Table 5A). Strikingly, however, three of the four highest percentages relate to one site, namely Birdoswald fort. These three groups comprise the Vallum fill (the Spur) and the subsequent (middle) fort ditch at the same site, both of which have decorated vessels accounting for more than 50 per cent of the group, while the remaining site is the area of the Field Study Centre within the fort. These high proportions of decorated types correspond with the exceptionally high proportions of samian generally compared with other pottery types from the site. The Birdoswald garrison thus appears to have received unusually rich supplies of samian. Whilst this may relate to the status of the site and/or its consumers, it might equally be a function of supply, which saw extraordinary shipments to and consumption of samian by the Roman military in the north-west of England, as witnessed by the data from Carlisle noted above, and the forts at Ribchester and Kirkham (Table 5C).
The other site with a very high level of decorated types is the fort at Tiverton (Devon). The high frequency of decorated vessels amongst the samian from this site has previously been identified as being exceptional and within this larger sample of groups it remains conspicuous.Footnote 105 Possible explanations for this unusual composition have been discussed elsewhere;Footnote 106 the bulk of the samian comes from the ditch terminals either side of the western gate, where the pottery may represent deposits associated with the abandonment of the fort.Footnote 107 The nature of these deposits remains intriguing and it is possible that there was a symbolic or ritual element to them.Footnote 108 If they indeed represent the discard of a ‘life-assemblage’Footnote 109 at the time of the demolition of the fort, it would appear that a high proportion of the samian vessels in use in at least one milieu within the fort were decorated bowls. Similarly, the group from Period 5a at Segontium (Table 5A) comes from what is in large part demolition/destruction debris and has an above average proportion for decorated samian at c. 35 per cent. According to King and Millett the group appears to include a ‘substantial residual [component that] can perhaps be compared with the assemblages at Cirencester (Wacher and McWhirr Reference Wacher and McWhirr1982, 133) … where the military appear to have dumped pottery during clearance phases within the forts’.Footnote 110 It is possible that like the groups from Tiverton and Cirencester this Segontium group also includes items deposited as part of a rite of ‘closure’ or ‘termination’.Footnote 111
Amongst the 30 groups from military sites, only the comparatively early groups from Exeter and Longthorpe come, seemingly, from legionary as opposed to auxiliary installations. Hence, it is not possible, on this evidence, to pursue the potentially interesting question as to whether or not groups from legionary sites have higher proportions of decorated types present than do groups associated with auxiliary units. Proportions of decorated forms amongst samian groups from sites in Antonine Scotland have been discussed elsewhere.Footnote 112
Samples are available for both the fort and vicus at Castleford (W Yorks.), dating to the early/mid-Flavian period. The group from the fort is the largest sample of the 110 groups listed in Table 5A, consisting of 521 samian vessels. The proportion of decorated vessels from the fort area is 30 per cent, but that from the vicus is even higher (sample size 122 vessels) at 37 per cent. This difference suggests a ‘richer’ consumption of samian in the vicus area, which is in line with the observation made in this article that samian is usually more prominent in extramural settlements than within forts. Overall, it is apparent from the data assembled here that sites associated with the Roman military generally had significantly higher proportions of decorated samian, relative to plain samian, than was the case at civil sites.
Extramural settlements outside military installations
Extramural sites outside military establishments are an exceptional case, having higher frequencies of decorated ware than those groups from within forts. Table 5A lists 15 groups from extramural settlements and indicates that the average proportion of decorated vessels present amongst these groups is c. 35 per cent (Table 6). The medial percentage is 37 per cent. The range of percentages is wide, but nine of the groups have percentages in the range of 32–46 per cent. On the whole, therefore, the data verify that decorated forms are more frequent from settlements outside forts than (i) from within forts or (ii) from other centres of occupation, whether large or small. There are just four groups with percentages below 30 per cent, and indeed these are all below 20 per cent. One is from Sheepen, Colchester (Period 3), already discussed above. Two others come from successive phases at the Explosion site, Alcester (Warwicks.), where the specific function of the area may be a factor. This site lies to the north of the putative fort,Footnote 113 and the occupation is presumed to be civilian, being associated with what is thought to be a rectilinear building.Footnote 114 The fourth assemblage is the ‘late’ group from Brancaster (also discussed above).
The groups from Melandra and Chester, Castle Street, have comparatively high proportions of decorated samian. The latter group is associated with a substantial building, perhaps a mansio, where decorated ware is likely to have been in frequent use. This group, however, comes from a well, so there is a question as to whether these finds are ‘day-to-day rubbish’ or possibly form a ‘special deposit’. The group from the vicus at Melandra (Derbys.) might also derive from a mansio, though there is a possible ‘watery’ dimension since the group is associated with a stream. Both groups have been discussed elsewhere,Footnote 115 and it is not necessarily the case that the composition of either was influenced by symbolic or ritual practice.
The proportions of decorated samian amongst the three groups from Blackfriars Street, Carlisle, are high. Two groups come from Period 3 (Late Flavian/Trajanic) at the site, and are associated with two buildings which are thought to have been domestic, with at least one having glazed windows;Footnote 116 both fronted onto the main Roman street south of the fort. In addition to high levels of decorated samian, they produced an exceptional assemblage of at least nine glass vessels including fine tablewares. It would seem that these high levels of decorated samian are consistent with other indicators, suggesting occupation by an individual or several people of some standing at this time. During Period 8 (Antonine) there is again a very high percentage of decorated samian present, when the building represented included a probable craft workshop, a shop and domestic quarters.Footnote 117 Fifty-two fragments of vessel glass were recovered from deposits of this phase (a high number), while the building itself appears to have had glazed windows at this time as well. Again, the proportion of samian formed by decorated vessels is high (52 per cent), so a coherent picture of occupation of some pretension emerges. It is also worth noting that amongst the Antonine and third-century samian recovered from the vicus at Stanwix, near Carlisle, in 1986,Footnote 118 the proportion of decorated vessels is also high, being some 42.5 per cent.
Major civil centres
Data for 28 groups from major civil centres are listed in Table 5A. The average proportions of decorated vessels present amongst groups from these sites is c. 26 per cent (Table 6) with the medial percentage being 25 per cent. Seventeen of the groups have proportions of decorated samian of between 21 and 29 per cent. Comparison with the settlements outside military establishments is of note, for whereas only a quarter of extramural settlements examined here have percentages for decorated ware below 30 per cent, over three-quarters of the samples from major civil centres have percentages of decorated ware below 30 per cent, which is a striking difference. On the other hand, the percentages are significantly higher than those recorded amongst groups from smaller civil centres and rural sites. Again, however, there are several groups with quite low percentages. The lowest, at c. 11 per cent, is associated with a Flavian building at 106–14 Borough High Street, Southwark; why the proportion in this case is so low is not clear, but the sample size at just 19 vessels may be a consideration. A Claudian group from Insula XVII at VerulamiumFootnote 119 (not listed in Table 5A) includes c. 133 samian vessels of which only 12.8 per cent are decorated types. It is uncertain whether the horizon from which this group comes is military or civilian; although there are indicators amongst the finds and features of a military presence, this remains unproven. The low value for decorated forms is consistent with the trend noted above for mid-first-century groups to have low proportions, owing to the lower output of such forms at this time.
Whilst the various major civil sites are batched together for this analysis, it should be remembered that each site had its own identity, origins, configuration of functions and perhaps distinctive population. These sites will have had differing legal statuses too within the imperial system. Whether such gradations might be seen in the composition of finds assemblages — specifically samian — between these major sites is unlikely given the many other sources of variability likely to have been influential in assemblage formation.
One group amongst those listed within Table 5A has an exceptionally high proportion of samian, namely a Neronian–early Flavian group from Insula XIV (Period IIa) at Verulamium. This group comes from a pit-like feature (Pit 7), which ‘may have been intended as a well’.Footnote 120 Some 84 samian vessels were represented in the fill of this feature, and the proportion of decorated samian vessels present is 57 per cent. This group presents an oddity and it is possible that this feature had a votive function — perhaps as a ritual shaft — like some other features of similar character and date in the Hertfordshire/Bedfordshire Catuvellaunian region. Precisely what other material came from this feature is not fully stated in the report, but amongst the published coarse pottery is an ensemble of flagons, including a complete flagon with, extraordinarily, multiple piercings.Footnote 121
Two groups from Canterbury have low proportions of decorated samian at below 10 per cent. One is Claudio-Neronian from the Rosemary Lane Car Park, while the other is Flavian/early Trajanic from the Marlowe Car Park. It is unlikely that these are representative of Canterbury as a whole, but rather the low proportions probably relate to their location at the periphery of the settlement at this time, where the evidence indicates agricultural activity and, perhaps, lower status occupation.Footnote 122
The groups from North Hill, Colchester (1965) and Insula XVII at Verulamium relating to an early Neronian building might be seen as special cases, since they may be described as de facto deposits relating to the Boudiccan ‘destruction’ of those towns.Footnote 123
Comparison with major civil centres elsewhere in the Western provinces
Some data on the frequency of decorated samian (again principally bowls) at major civil centres in other Western provinces of the Empire can be assembled for comparison with the patterns emerging from the sites of this type in Britain. fig. 1 shows the relative frequency of decorated samian (as opposed to plain forms) during the first century a.d. at several sites in Gaul and Iberia; a much larger set of site comparisons would be desirable, but the recording and publication of exact numbers of samian vessels by type and phase has not been common practice on the Continent. fig. 1 also includes the average percentage (i.e. 26.4 per cent.) of decorated samian amongst assemblages and groups from major civil centres in Britain for comparison. The graph shows that there is a broad similarity in the frequency of decorated samian at these sites, with the conspicuous exception of a group from the town at St Romain-en-GalFootnote 124 — a small group that comprises 34 samian vessels from Horizon 2 at the rue du Commerce site.Footnote 125 The group consists of samian dating to the earlier first century a.d., which is the likely explanation for the comparative infrequency of decorated samian from this site (only two examples of Drag. 29), despite its location at an important point within the settlement; as already noted, it is apparent that comparatively less decorated vessels were being produced in the period before c. a.d. 60 than after. In contrast, the sample from extensive excavations at Baelo in southern Baetica has a proportion of decorated samian consistent with the average for sites in Britain.Footnote 126 In the case of the first-century South Gaulish samian from Mérida (Augusta Emerita, the provincial capital of Lusitania) some 18 per cent is decorated.Footnote 127 This is a comparatively low figure, for which the explanation is unclear.
Comparison of the percentage of decorated vessels amongst samian assemblages from various major civil centres in the Western provinces (first century a.d.). Measure: by number of vessels.

The sample from the 1990 excavations (Periods 2–5) at la place Camille Jullian, Bordeaux (Burdigala) dating to c. a.d. 25–100 shows decorated vessels to comprise 29.6 per cent of the c. 2,979 recovered samian vessels.Footnote 128 This is a percentage close to that at Baelo and well within the main range of proportions seen at major urban centres in Britain; as Table 5A shows, for instance, first-century groups from Silchester and Southwark and second-century groups from Verulamium and Exeter have similar proportions of decorated samian. The similarity of proportions may, of course, arise from contrasting factors, and is a matter for further investigation. However, it points to an interesting general consistency, which may be a function of supply, or arise from other factor/s, but given the strongly patterned nature of samian consumption seen here in conjunction with the evidence from Britain, it is perhaps more likely to reflect broadly comparable levels of status and wealth, and cultural practice, amongst the urban consumers at these sites. It confirms a shared receptivity to samian ware amongst these communities, an interest in acquiring decorated forms (bowls), while providing a further reminder of the wide distribution and importance of samian wares in the Western Empire.
Smaller civil centres
Data for some 15 groups from smaller civil centres are listed in Table 5A, supplemented by five more in Table 5B. The analysis presented in Table 6 suggests that the average proportion of decorated vessels present amongst the groups from these smaller centres is c. 17 per cent, a figure less than half of the equivalent total in the case of extramural sites outside military installations and, indeed, the lowest average for all types of site by this measure. The medial percentage for the 15 groups is c. 14 per cent; the range of percentages is 8–30 per cent, but four-fifths of the sample lie within the range 12–25 per cent. The two groups with the lowest proportions of decorated ware are from Neatham and Heybridge, Elms Farm, at 8 and 10 per cent respectively, though both are third-century in date and hence relate to a period when the supply of decorated vessels to Britain, relative to plain types, had dropped. A group from Catterick is, however, at variance with the general picture, with a third-century group from the Bainesse site registering a percentage of decorated ware at 30 per cent, the highest proportion amongst the whole sample of sites in this category. This reflects the unusually high proportions of decorated ware noted above when the site was essentially an extramural settlement outside the fort. Overall, there is a highly consistent pattern amongst the samples from these sites that is independent of geography and chronology: proportions of decorated ware are markedly low when compared with the figures for military sites, vici/canabae and the major civil centres.
At the ‘small town' of Asthall (Oxon.) (1992, Area A) a comparatively high proportion of decorated vessels (25 per cent) amongst the South Gaulish ware occurs for a site of this type (Table 5B). This may reflect a short-lived initial prominence of decorated samian at many sites in the countryside immediately following the conquest, all be this in low absolute numbers.Footnote 129 In contrast, the percentage of decorated vessels amongst the Central Gaulish samian at this site drops to 15 per cent, consistent with the pattern apparent from Table 5A. From Area B at Asthall the proportion of decorated Central Gaulish samian is particularly low, probably owing to the chronology of the group, which is predominantly a later second-century assemblageFootnote 130 and dates to a period when decorated samian vessels become less common. This low proportion for decorated samian also fits with the apparent industrial/non-residential identity of this area.Footnote 131
The small sample of South Gaulish ware from Hayton, Burnby Lane, also shows a high percentage of decorated samian at 42 per cent (Table 5b). This contrasts with the moderate figure of 24 per cent for the adjacent contemporary fort (Table 5A). This difference may reflect the short-lived prominence of decorated samian at rural sites immediately following the conquest in East Yorkshire and elsewhere.Footnote 132 It should be noted though that the percentages for decorated vessels at the Burnby Lane site in the case of later Central and East Gaulish samian remain comparatively high, which correlates with the structural evidence for a building complex of some pretension. A further site registering a comparatively high percentage of decorated vessels is Whitchurch (Shrops.) (Table 5B), with a figure of 43 per cent in the case of Central Gaulish samian. Again this high figure is consistent with the structural evidence, which indicates a substantive building, perhaps a ‘town house’ or mansio.Footnote 133
The roadside settlement at Shiptonthorpe (E Yorks.) yielded an exceptionally high proportion of decorated ware; Drag. 37 comprises 40.8 per cent of the Central Gaulish samian, and half of the East Gaulish material.Footnote 134 However, decorated sherds were particularly associated with the vicinity of a waterhole and it is suggested that the institution of that feature may have disturbed an unusual deposit of decorated ware, which itself is noteworthy.Footnote 135
Rural sites
The number of samples available from rural sites is constrained, particularly owing to group size: for where samian group composition is published, the group size is often too small to ensure a valid picture, with the aggregate number of vessels represented not reaching a threshold of c. 17 vessels. Samian though invariably present at rural settlements, is a fairly infrequent find at such sites and hence the chances of excavated samples including sufficient numbers of items identifiable to form are that much less than at other categories of site. This outcome is influenced by the small-scale sampling of features at rural sites that is a consequence of economies and project specifications; increasing the ‘take’ of archaeological soils, such as doubling the amount of fill excavated from a ditch, may generate larger samples of cultural material, including samian, etc., that may be more amenable to analysis. The number of suitable groups from rural sites has recently been augmented with more information becoming available as post-PPG 16 projects have progressed to publication; pottery reports within these works have been much more comprehensive than in the past.
Some 13 groups from rural sites are listed in Table 5A, supplemented by eight groups appearing in Tables 5B and 5C. The sample of the 13 groups from rural sites suggests that the average proportion of decorated vessels present amongst such groups is around 20 per cent (Table 6). The medial percentage for them is consistent at 21 per cent. The frequency of decorated samian amongst groups from rural sites is broadly equivalent to that at the smaller civil centres. Three groups from rural sites have higher incidences of decorated ware, above 28 per cent, two of which come from Snettisham (Norfolk) and the other from Maxey (Cambs.). Snettisham not only has a high percentage of decorated vessels over time, but also has some unusual forms represented.Footnote 136 The samian evidence, therefore, implies a site of some status, though there is no evidence for it developing into a villa as occurs at some other sites.
The modest percentages of decorated samian at sites, such as Haddon Lodge and Tort Hill East (both Cambs.) are likely to be typical of rural farmsteads (Table 5B). This also appears to be the case at Buildings Farm, on the fringe of modern Great Dunmow (Essex), where again the proportions of decorated samian present are modest (Table 5B). This site lies near to the Roman smaller civil centre at Great Dunmow, but is evidently spatially separate from it and appears to represent a rural complex. The lower frequency of decorated samian at many rural sites following an initial prominence has already been discussed,Footnote 137 and it is consistent with a shift towards utilitarian pottery suites at rural sites from the second century.Footnote 138
The rural site at Slonk Hill, Shoreham (W Sussex), which has a strong religious/ritual element, has conspicuously high proportions of decorated samian (Table 5B) that distinguish it from other rural sites. Whether this high proportion of decorated samian relates to the likely religious/ritual activities at this site is unclear. Many rural sites and smaller civil centres would have had associated temples/shrines that will have helped shape their identity and which may have impacted upon the types of artefacts to be found in their vicinity. It is not clear what impact the presence of such elements had upon samian consumption at rural sites and smaller centres. Samian though appears, generally, not to have been particularly associated with temples in Britain; perhaps this was variable, dependent upon specific rites.
Villas
Consumers at some, though not all, rural sites which were later to develop into villas acquired high proportions of decorated samian in the years following the Claudian invasion. This was the case at Rudston (E Yorks.), where 13 South Gaulish decorated vessels out-number the South Gaulish plain vessels represented.Footnote 139 This pattern, however, is not sustained at Rudston during the second century,Footnote 140 nor, broadly, elsewhere.
After this early floruit the picture changes. Samples from villas dating to the earlier Roman period — or from excavations beside such sites — seem generally to yield samian groups with proportions of decorated ware no higher than at more humble farmsteads. At Salford Priors (Warwicks.), where a villa also developed, Dickinson notes that decorated vessels account for only ‘5% of the samian which, in a large assemblage, would be a reliable indicator of an impoverished, or non-domestic, site’Footnote 141 (though the excavated areas lie at some distance from the postulated house). At Lullingstone villa (Kent) just 2.6 per cent of the 76 samian vessels represented from Southern Gaul were decorated (a curiously low proportion), while the equivalent figure for the Central and East Gaulish samian (311 vessels) is a moderate 13 per cent decorated.Footnote 142 Even the samian from Period 2 at Fishbourne, during its period of opulence (c. a.d. 75–100) included a remarkably low proportion of decorated ware.Footnote 143 It is possible that this low representation could be explained if the role of decorated samian bowls on the table had perhaps been fulfilled by higher status vessels of glass or metal, potentially silver.Footnote 144 Evans has suggested that this preference might be true at villa sites generally.Footnote 145 Such scenarios, however, might not be straightforward, since bronze and silver tarnish and also may affect the taste of consumables.Footnote 146 Hence metal vessels might have been more appropriate as containers for dryer foodstuffs and display, whilst samian bowls were used for the more liquid foods and where contact with the mouth, directly or indirectly, was the case. Whilst greater use of higher status artefacts is plausible, it implies a rather inflexible repertoire in the sideboards/dressers of these villas: a ‘best table service always’ scenario, which is not especially convincing.
This trend continues in the second century. The fill of the cellar at Ditches villa (Glos.) produced a second-century group that included 99 vessels identifiable to form, with only ten being decorated vessels.Footnote 147 At Whitton (Glamorgan) and Bignor (W Sussex), the proportions of decorated samian are both very low during the ‘proto-villa’ phases. This is also the case at Rudston in the period before the construction of the villa, despite the strong showing of decorated ware of first-century date.Footnote 148 Similarly at Winterton (N Lincs.), the proportion of decorated samian during the early phase of the villa is again low, at just 15.6 per cent. In contrast, apparently more humble rural settlements, as judged by their architecture, have greater proportions of decorated bowls, as at Maxey and Brockworth; this is despite the fact that these bowls were almost certainly more expensive than plain forms. A future study might investigate whether the use of non-samian tablewares — especially larger containers and drinking vessels — was more widespread amongst villa society in Britain.
THE FREQUENCY OF DECORATED SAMIAN AT DIFFERENT SITE TYPES: SUMMARY AND DISCUSSION
The Project has enabled a large sample of groups/assemblages to be assessed, allowing trends to be substantively explored. It has been possible to gather together a large number of groups of samian in Tables 5A–C for which the proportions of decorated vessels present can be established. This information shows that there is a firm relationship between site type and the proportion of decorated vessels likely to be present amongst the associated samian assemblage. Such structuring in the distribution of samian has not been demonstrated previously.Footnote 149 Whilst there are, as one would expect, variations in the proportions of decorated vessels present within site type groupings, the general pattern is clear. Moreover, the trends per site type are sustained through time and geographically across the province. This patterning must arise from repeated definitions and practice in the past by conscious social actors who shaped the nature of supply to and consumption at these sites. The greatest consumers of decorated samian (mainly bowls) were the military, the inhabitants of extramural settlements outside military installations and dwellers in the major urban/civil centres. These sites also have higher proportions of samian in general than do other sites and so there is a consistency in consumption between these two dimensions. The most visible ‘Roman’ centres received and consumed greater amounts of samian, as well as the greatest proportions of its more elaborate types. In other words, there was a greater consumption of decorated bowls at military sites and other sites at the top of the settlement hierarchy, implying that such vessels can probably be associated with wealth, social display and identity creation and maintenance. Rural sites in the conquest era form a short-lived exception to this pattern, for many at that time display small groups of samian which are also biased towards decorated bowls;Footnote 150 this could either be the result of a demand for such novel decorated vessels or because more decorated bowls were selected for supply to these sites. This trend is, though, a temporary ‘flush’ and proportions of decorated samian amongst groups of, for instance, second-century date at such sites are much lower. In general the data set confirms that smaller civil centres and rural sites have markedly lower proportions of decorated vessels than is the case at other categories of site. It remains an important research question as to whether this pattern exists at sites on mainland Europe within the Empire.
The data on the incidence of decorated samian clarify certain aspects:
(i) The overall mean figure for the incidence of decorated ware amongst samian groups is c. 25 per cent, though there are distinct divergences from this mean when the data are examined by site type.
(ii) Only a few groups/assemblages contain more decorated than plain vessels and in each case particular circumstances can be identified to account for this composition.
(iii) There is a strong trend for groups/assemblages from military sites and major civil centres to have above average proportions of decorated vessels present. While in the case of the few available samples associated with extramural occupation outside military installations high proportions of decorated samian vessels consistently occur.
(iv) Contrastingly the ‘small towns’, roadside settlements and (second-century) rural sites have below average percentages of decorated samian.
(v) Small groups of samian from rural sites dating to the conquest era / first century a.d. are often biased towards decorated bowls in a manner not hitherto appreciated. This seems either the result of a demand amongst ‘consumers’ at these sites for such (in this context) novel items — perhaps for ‘status display’ — or because more decorated bowls were selected for supply to them. This pattern may relate to the character of later Iron Age resource circulation.Footnote 151 The balance towards decorated vessels at such sites was not, however, enduring, and second-century groups of samian from rural sites show decorated vessels to be much less frequent.
(vi) A low proportion of decorated ware at Fishbourne during Period 2, the era of the palace, is noteworthy; one potential explanation being that fine metal or glass vessels were in use at this site, negating the requirement for decorated samian at the table.Footnote 152
The discovery that the proportions of decorated samian within groups vary between different types of site can be seen to correlate with the results of analyses of other types of material culture at Roman sites. Recent work has shown systematic variations in the nature of cultural assemblages from different types of site.Footnote 153 The evidence for this structuring in the distribution/consumption of material types warrants further attention. In the case here, the patterning is doubtless a function of the comparatively higher cost of decorated bowls, their use as symbols of cultural association and status in ‘wining and dining’ and, to a lesser degree, supply and geographic access. The latter two can be classified as ‘lesser degree’ because within the Empire those who wanted such items would have been able to acquire them despite distance. Perceptions of samian seem to have varied across the social landscape. It would appear that consumers at military sites, extramural settlements and major civil centres were better placed to afford decorated samian and inhabited a social environment within which the possession and display of decorated samian was evidently normal. Consumers at the smaller civil centres and rural sites may have been less able to afford decorated bowls and less interested in their deployment as status and identity indicators (but see below). Eckardt has pointed out that small differences of value are likely to have been important in terms of the decision to purchase material items in the Roman era.Footnote 154 Alternatively, it may only seem that decorated samian was less prominent in their lives because it appears less frequently within the settlement record at these sites. Decorated vessels may have been important within everyday life or on ‘special occasions’ at such sites, but circumstances led to it being well curated with correspondingly less turnover. It is noted below that the evidence of samian found in graves and structured deposits at rural sites indicates that it was regarded as special by rural populations and, in light of this, the comparatively low proportion of decorated samian at rural sites and smaller centres needs to be interpreted with care. It is curious that a range of rural sites has higher proportions of decorated samian than do smaller nucleated centres (Table 5A). This may arise because the sample has ‘caught’ a number of comparatively high-status rural farmstead sites where people were interested in acquiring samian. It is worth noting that the very low proportions of decorated ware at the smaller centres is consistent with the highly utilitarian nature of the finds assemblages excavated at such sites.Footnote 155
IV. SAMIAN IN USE: SAMIAN FORMS, USAGE AND PRACTICE
Samian pottery appears in many forms and these span a number of generic classes, as we define them today, such as bowls, dishes, cups, etc.Footnote 156 Some form types were more common than others, whilst some are rare. Forms changed over time, and only a proportion of samian form types were current in any one period. Hence, samian groups from individual sites are often composed of a fairly circumscribed number of form types. The development from one type to another is now well characterised (e.g. Drag. 18 to 18/31 to 31). Why forms changed is, of course, a domain of interest for investigation. The character and standardisation of samian forms was firmly intentional, and is consistent with norms and ideas of the appearance of pottery as seen in the material culture and literature of the Roman metropolitan world. Graffiti from kiln sites demonstrate that specific samian forms were evidently designed for certain uses, and hence at this level at least a relationship existed between producers and consumers, albeit theoretical.Footnote 157 How consumers defined or used samian vessels in the provinces is another matter and a focus for attention here.Footnote 158
In most cases, the generic classes into which pottery is classified in the Western world today — for instance, ‘bowl’, ‘platter’ and so forth — are recognisable intuitively.Footnote 159 Not least, this is because these terms relate to vessel proportions (which can be expressed as ratios between height and diameter).Footnote 160 The uses to which vessels were put in the past is an area warranting exploration rather than assumption, for this is a domain in which it is possible to slip into ethnocentric and other suppositions. The literature examining artefacts and society over the past two decades has emphasised the often open possibilities of artefact definition and function, with an acknowledgement that artefact use and definitions are context situated, potentially complex and yet often patterned.Footnote 161 The emergence of phenomenological perspectives in archaeology has deepened this awareness. One cannot then, normally, be certain as to the functions to which particular forms and types were put at any site at any time. Hence, it is important to ‘work from the ground up’, and to focus upon such areas as the context of finds at individual sites and site types,Footnote 162 to search for trends in the data that might indicate repeated practice, and to look at aspects such as vessel wear.Footnote 163 At a general level it is established that samian vessels were prized items. They were evidently intended to serve as tablewares and for other functions in which they were socially visible (as with candle holders and perhaps inkwells). The likelihood is that samian vessels were used with some regularity for drinking and serving food in shared/communal meals and at festive events,Footnote 164 whilst being also open to other uses and definitions.Footnote 165
The incidence of forms per site type is considered here to identify any similarities or differences between the categories of sites and to assess their potential meaning. Information collected for this survey on the incidence of samian by form can be explored to inform such enquiries and summary tables of this data are presented here. The composition by form of samian assemblages from specific sites is compared with the general patterns suggested by the information in the Project's Database 1.Footnote 166 The aggregate data forming Database 1 can be sorted so that the relative frequency of specific forms can be established for any particular year. Various case studies are also presented.
THE COMPOSITION OF SAMIAN GROUPS AT DIFFERENT CATEGORIES OF SITE BY FORM
Table 7 summarises the incidence of samian at the main categories of site by generic/functional type. The source is Database 1,Footnote 167 with the raw data therein aggregated for each functional type by site category and converted into summary percentages for the main site types,Footnote 168 so that one can compare the relative importance of, for example, cups at one type of site with another. The sample used is large, consisting of 179 site groups, and hence this data should be a reliable guide to trends. The data set is instructive since it provides an instant snapshot of the relative importance of particular types of samian vessel at contrasting site types. The only drawback in this case is that this specific table aggregates all the data from Database 1 independent of year or period, and so Table 7 presents a ‘whole story’ view.Footnote 169 Significantly it shows there are strong variations in the proportions formed by certain form/functional categories from site to site. figs 2–6 utilise the data presented in Table 7 and show graphically the relative frequency of generic/functional categories at the range of site types used in this survey. These figures show some strong contrasting patterns.
The relative frequency of samian functional categories at Roman military sites in Britain (Sample from 41 dated site groups in Database 1 (Willis Reference Willis2005a)). Measure: by number of vessels.

The relative frequency of samian functional categories at extramural occupation sites at military installations in Britain (Sample from 13 dated site groups in Database 1 (Willis Reference Willis2005a)). Measure: by number of vessels.

The relative frequency of samian functional categories at major civil centres in Britain (Sample from 40 dated site groups in Database 1 (Willis Reference Willis2005a)). Measure: by number of vessels.

The relative frequency of samian functional categories at smaller civil centres in Britain (Sample from 32 dated site groups in Database 1 (Willis Reference Willis2005a)). Measure: by number of vessels.

The relative frequency of samian functional categories at rural sites in Britain (Sample from 28 dated site groups in Database 1 (Willis Reference Willis2005a)). Measure: by number of vessels.

SUMMARY OF THE OVERALL RELATIVE FREQUENCY OF SAMIAN FUNCTIONAL CATEGORIES AT DIFFERENT SITE TYPES (source: Willis Reference Willis2005a, database; quantification by number of vessels)

Military sites
fig. 2 shows that at military sites vessels of the dish/platter category are most frequent (c. 40 per cent), and decorated bowls are the second most common, forming 27 per cent; cups are also strongly represented. The range of other types occurring on military sites, although wide, accounts for only very low proportions of the samian from these sites. These data may be compared with those available from specific sites. To take one example, the incidence of samian by form from the Vallum at Birdoswald Spur may be considered against this general pattern for military sites.Footnote 170 The group is itemised by form in Table 8. This small group shows a very high percentage of decorated bowls (in particular Drag. 37) — 46.3 per cent, compared with 27.1 per cent in the general pattern — with cups and dishes/platters also high, though these have been depressed by the high registration of decorated bowls. This prominence of decorated bowls at Birdoswald is an example of the type of contrast one might detect between a specific group and the general data, which might benefit from investigation. Alex Croom has collected data by EVE on the incidence of vessel types at South Shields by phaseFootnote 171 and data of this nature may now be compared against information from military sites in Table 7/fig. 2.
THE COMPOSITION OF THE SAMIAN FROM THE FILL OF THE VALLUM AT BIRDOSWALD SPUR (SITE 590, SITE PHASE 1), DATED c. A.D. 125/30–150/60 (numbers record the count of vessels represented, attributable to categories; source: Willis Reference Willis2009b)

Extramural settlements outside military installations
fig. 3 plots the relative frequency of functional types at extramural settlements associated with military sites. The main categories present are the same as those for military sites, but in this case the emphasis is strikingly different: decorated bowls are the most common functional category, accounting for 38.4 per cent of vessels, whereas dishes/platters form just over 34 per cent and cups c. 19 per cent. A number of other functional types are recorded, but these comprise only small proportions. This remarkably high frequency of decorated vessels at vici/canabae is consistent with other indicators, and has been discussed above. Again the general pattern may be compared with data from specific sites. Information on the numbers of samian forms present has been published for the vicus at Brancaster and these are summarised in Table 9. The Brancaster vicus sample varies from the general pattern for sites of this type in so far as the proportions formed by decorated bowls and cups are much lower, with contrastingly high percentages of plain bowls. This is almost certainly a function of the late date of the group, for occupation does not begin at this site until c. a.d. 170. Hence, it is not surprising that samian mortaria (from Central and Eastern Gaul) register c. 16 per cent of the total. The strong presence of plain bowls is of note, especially Drag. 31R (again from both Central and Eastern Gaul), with this type being a feature of late Antonine to early third-century groups. The comparatively low proportion formed by decorated bowls may well relate to chronology, for, as noted, it appears that these forms became generally less frequent in the late second century.
THE COMPOSITION OF THE SAMIAN FROM THE AREA OF THE VICUS AT BRANCASTER, NORFOLK, 1974 AND 1977, DATED c. A.D. 140–260+ (numbers record the count of vessels represented, attributable to categories; source: Dickinson and Bird Reference Dickinson and Bird1985)

Major civil centres
fig. 4 shows the relative frequency of samian forms at major civil centres (based on Database 1). In this case, decorated bowls form a lower proportion of the sample than is the case with both military sites and extramural settlements. Cups and dishes/platters each account for more than 30 per cent of the sample. Two aspects are of interest: firstly, whilst dishes and platters form similar proportions at both the military sites and major civil centres, the proportion formed by cups is notably higher amongst the sample from the major civil centres; secondly, the balance of forms at major civil centres is, curiously, nearer to that at military sites than it is to the civil settlements outside forts (compare figs 2–4).
Smaller civil centres
Plain forms register strongly amongst the sample from smaller civil centres. fig. 5 shows that decorated bowls form less than 20 per cent of the sample, a total that is less than at any other category of site. Conversely plain bowls form 12 per cent of the sample, a figure higher than at any other type of site. Cups and dishes are the most common forms represented. It is possible to select data from Database 1 relating to particular site types and years. Table 10, for instance, shows the relative frequency of samian types at smaller civil centres for the year a.d. 160.Footnote 172
THE OVERALL RELATIVE FREQUENCY OF SAMIAN TYPES AT SMALLER CIVIL CENTRES IN THE YEAR A.D. 160 (source: Willis Reference Willis2005a, Database 1; on basis of number of vessels; omits residual types and those represented by miniscule percentages)

Rural sites
fig. 6 shows the constitution of the sample from rural sites by form is again different from that for other types of site. Here, decorated bowls form around 20 per cent of the sample. Remarkably dishes and platters account for almost half the sample, a much higher proportion than at any other category of site. These data shed light on the nature of samian consumption at rural sites, while attention to case studies is likewise instructive. The rural site at Birdlip Quarry (Glos.), for example, produced a samian assemblage that is broadly consistent with this general pattern. It is stated in the excavation report that: ‘Samian pottery was common on the site although the range of forms was limited. Dishes and bowls accounted for 90 per cent of the material … The unimportance of cups reflects the low proportion of all pottery classified as “drinking vessels” (less than 5 per cent of the total assemblage …) and probably relates to the use of bowls for this purpose. … It is probably also significant that there were only three examples of decorated vessels (Drag. 37) and these were among the earliest datable vessels on the site’.Footnote 173 A further factor with regard to this site is the date of the main period of occupation, which is later second and third century. This has implications in terms of the currency of particular types of samian vessels, for both samian cups and decorated bowls are generally less common by the later second century. Table 11 shows the composition of the samian from the rural site at The Old Sugar Beet Works, Felsted (Essex). This sample is mainly second century and is of very modest size; nonetheless it shows a similar plain samian emphasis to that of the general pattern in fig. 6. In all these respects it is broadly representative of samian recovered from basic level rural sites.
THE COMPOSITION OF THE SAMIAN FROM THE OLD SUGAR BEET WORKS SITE, FELSTED, ESSEX, 1998 (AC 210), DATED c. A.D. 40/70–200/50 (numbers record the count of vessels represented, attributable to categories; source: Willis Reference Willis1999a)

THE REPRESENTATION OF SAMIAN FORMS AND THE USE OF EVE DATA: THE FUTURE
The use of EVE data as a measure of presence and quantity of pottery is preferable to employing ‘numbers of vessels represented’ information.Footnote 174 As yet, little data of this kind is in the public domain, and specifically information on the EVE totals per samian type, despite the use of EVE measurement as a standard method for about 25 years. Paul Tyers has previously pointed out the utility of this class of information for samian ware.Footnote 175
Two tables are presented here for reference and to illustrate that EVE data can be used in this manner. Table 12 shows the composition of the samian from the Field Study Centre site, Birdoswald fort, by EVE; whilst Table 13 shows the composition from the villa site at Hayton, Burnby Lane (E Yorks.). The composition of the samian from these two sites can be compared for they are broadly contemporary assemblages. Similar potential for tabulation and scope for comparison exists with archival data from other sites recorded using EVE, as, for instance, with the samian from Leadenhall Court, London.Footnote 176
THE COMPOSITION OF THE SAMIAN FROM THE FIELD STUDY CENTRE SITE, BIRDOSWALD FORT, c. A.D. 100–260+ (numbers record the EVE count (by Rim Equivalent) for categories; source: Willis Reference Willis2009b)

THE COMPOSITION OF THE SAMIAN FROM HAYTON, BURNBY LANE, EAST YORKS., DATED c. A.D. 70–260+ (numbers record the EVE count (by Rim Equivalent) for categories; source: Willis forthcoming b)

SUMMARY AND CONTRAST: THE FREQUENCY OF SAMIAN FORMS AT PARTICULAR SITE CATEGORIES IN BRITAIN AND ELSEWHERE IN THE WESTERN PROVINCES
figs 2–6, drawing upon a large sample, demonstrate and confirm that there were contrasting patterns of samian consumption at different categories of site. These consistent patterns were doubtless mainly owing to economic and cultural differences between the consumers at the different types of site. The evidence from Britain can also be compared with the composition by form of samian assemblages from elsewhere in the Western provinces. fig. 7 plots this data for a number of sites, including Baelo (Baetica), Mérida, São Cucufate villa and Conimbriga (Lusitania), Bordeaux (Gallia Aquitania), and Southwark, London. In order to enable valid comparison, the site samples chosen are all South Gaulish and of the first century a.d. The occurrence of such samian assemblages across the provinces is testimony to the vibrancy of the trade and the potential archaeological value of the ware. On the whole, the site composition shows a broad similarity, which in itself is of significance: was this indicative of similar supply or taste in demand, or did different variables result in an apparent similar pattern of consumption? Southwark, Baelo and Mérida have very similar assemblages by this measure; Conimbriga has proportionally fewer bowls than other sites; all sites other than Bordeaux have closely similar proportions of platters/small dishes; Bordeaux has a higher frequency of cups, while the villa at São Cucufate has proportionately fewer cups. More published data collected by similar methods is needed for samian and other pottery across the Western provinces to enable comparison and synthesis from which to build informed interpretations.
Comparison of South Gaulish samian assemblages from various sites in the Western provinces by form (c. a.d. 25/40–100). Measure: by number of vessels.

SAMIAN CUPS IN ESSEX: A DISTINCTIVE REGIONAL TREND?
One unforeseen aspect to emerge from the Project has been the observation that samian cup forms are very strongly represented in the Essex region, especially (though not only) at rural sites, to a degree not seen elsewhere.Footnote 177 The explanation for this trend is uncertain, but it may be an expression of a (Trinovantian?) cultural preference for forms probably used as individual drinking vessels. fig. 6 suggests that the average proportion formed by cups amongst samian assemblages from rural sites is around 25 per cent, while at smaller centres (fig. 5) the equivalent proportion is c. 24 per cent. For Essex Tables 14 and 15 show that proportions formed by cups amongst the samian from the smaller centre at Elms Farm, Heybridge, are broadly consistent with the overall average for this type of site. However, these tables also show that proportions formed by cups from the rural sites at Felsted, Rayne and Tendring are comparatively high compared with the average for this type of site.Footnote 178
THE REPRESENTATION OF CUP FORMS AMONGST SOME SOUTH GAULISH SAMIAN COLLECTIONS FROM ESSEX (source: author)

THE REPRESENTATION OF CUP FORMS AMONGST SOME CENTRAL GAULISH SAMIAN COLLECTIONS FROM ESSEX (*AND COLCHESTER SAMIAN) (source: author)

A conspicuous presence of cups was also noted amongst the early samian from The Star and Fleece Hotel site, Kelvedon, on the eastern outskirts of the Roman ‘small town’ adjacent to the main Roman road. Fawcett notes that amongst the South Gaulish samian from the site the ‘dominant form is the Drag. 27 cup’.Footnote 179 At the rural site at the Old Sugar Beet Works, Felsted, the heavy emphasis towards cups contrasts with an absence of other common forms (such as the Drag. 18) amongst the South Gaulish samian. The small size of this sample is perhaps a factor, but it should be noted that the only other South Gaulish form present is a Déch. 67 beaker, which whilst not a rare form, is a comparatively infrequent site find even at military and urban sites of the period, so the presence of this further potential drinking vessel is perhaps significant.
At Rivenhall villa, Rodwell stated that: ‘There is a marked upturn in the quantity of Hadrianic [samian] wares. Particularly noticeable is the high proportion of small cups, form 33, of Hadrianic and earlier Antonine date: they comprise more than 30% of the 2nd century wares’.Footnote 180 Going observed that at both the Rivenhall villa site and at Chelmsford the cup form amongst the assemblages was exclusively represented by samian vessels, and he commented that: ‘It is odd that cup forms, for which there appears to have been a constant, if low, demand, were so ill-represented in the ceramic repertoires of the various local potteries’,Footnote 181 they were hardly imitated.
Finally, there are some 732 samian vessels identifiable to form from Fingringhoe Wick, on the Colne below Colchester.Footnote 182 The items, now in the Colchester and Essex Museum, were collected unstratified in the early and middle twentieth century, from a site that is conventionally interpreted as a Roman military installation, with later ‘villa’ occupation. Amongst this material, cups account for 28 per cent of the samian, a higher proportion than appears normal for either military or rural sites, as figs 2 and 6 clearly show.
V. SAMIAN AND BURIALS
SAMIAN VESSELS INCLUDED WITH BURIALS IN BRITAIN
Burial rites and practice during the Roman era were complex and varied. Nonetheless a number of distinct trends can be identified following an examination of the occurrence of samian vessels in funerary contexts in Britain.Footnote 183 This section highlights and summarises some of these patterns.Footnote 184
It is evident that samian was a comparatively frequent inclusion in burial groups through the period c. a.d. 40–240; its incidence in such contexts was both diachronically and synchronically broad. Samian was culturally acceptable as a grave good across southern Britain and beyond (and this is a point of no small interest given its Roman-metropolitan associations as an artefact class, and extra-provincial sources). On close examination, it is apparent that samian placed within funerary deposits, as with other items, was not a random selection, but rather it is highly structured, as Table 16 demonstrates. Study reveals that specific forms were preferred for incorporation within graves and, moreover, that older, worn, damaged or repaired samian vessels are disproportionately represented amongst the samian from graves. Such patterning raises intriguing questions as to how such items were regarded by communities. Funerary contexts represented a highly sensitive status passage in the Roman world. Inclusion amongst the pottery vessels interred of worn, repaired, damaged or altered samian might not represent token items or ‘seconds’, but may rather have been seen as appropriate. This is not because their condition meant they could be discarded more freely by the living, but fitting since these vessels readily show a biography of their own life histories and process in cultural use, that might represent lived material experience. This is in contrast to the use of fresh unworn samian pottery that was frequently offered to the gods in structured deposits not involving the dead.Footnote 185 A surprising discovery is that burials associated with both rural sites and smaller civil centres more frequently have samian as a grave inclusion than do those linked to major civil centres. This is despite the fact that samian is much more prominent amongst settlement deposits at major civil centres than at either rural sites or smaller centres.
THE SAMIAN FROM 30 CEMETERIES IN BRITAIN BY FABRIC, FORM AND GENERIC/FUNCTIONAL TYPE (i.e. the number of vessels represented attributable to a specific category; N = 207; see Willis Reference Willis2005a for further details)

Notes
1 Altered form: apparently refashioned for use as a lamp.
2 Presumed to be CG Lezoux.
A further emphatic pattern exists. With few exceptions samian bowls, including decorated forms, were excluded from graves at cemeteries in Britain and the North-West provinces. The absence of decorated bowls is particularly striking given their prominence amongst settlement assemblages from all types of site. This tendency appears to extend to bowls in coarse fabrics as well, though not so firmly. This trend apropos decorated samian bowls indicates that there must have been particular cultural definitions associated with such vessels that were shared over a wide geography in North-West Europe. It might be proposed that this reflects the likely higher value of such vessels, but this is not a sustainable argument when one considers that other grave goods, including flagons and plain samian vessels, were not without value. Rather, it seems likely that the way in which these bowls were used and defined in everyday life prohibited their inclusion in graves. The overall pattern shows, in fact, a very strong representation of shallow open forms, particularly dishes or platters, together with cups. Cups in graves are almost invariably samian or, far less often, samian copies, or occasionally, in early contexts, of Gallo-Belgic ware. Overall samian forms in burials — with the absence of decorated bowls excepted — reflect the frequency of the forms at their associated settlement sites. There is, then, a correspondence between the frequency of plain forms in use at sites or preferred by types of communities and the incidence with which particular form classes are interred with the dead at these sites.
There is some tendency for ‘sets’ and pairs of samian vessels in graves, and for work of the same potter/workshop to occur in a grave, often bearing the same die stamp. The latter suggests multiple purchase or acquisition by individuals or households, at some point in time, from a bulk supplier, or possibly their selection for inclusion in the grave. One final point to note is that the pattern of samian forms in graves demonstrates that small forms were normally selected for inclusion, implying servings for an individual ‘soul’; decorated bowls, comparatively large forms, were by contrast arguably for communal drinking.Footnote 186 Most pertinently, the patterns identified here are consistent over time, between site types, over a wide geography, and seemingly independent of sub-regional burial traditions and civitas regions.
SAMIAN ACCOMPANYING BURIALS ON THE CONTINENT: A COMPARISON
Samian occurs widely in graves in the North-West provinces of the Empire. It is frequently present as a grave good at military and military/civil centres in the Limes zone, for instance, occurring with cremations in the east cemetery at Nijmegen;Footnote 187 likewise at the Neuenheimer Feld area of Heidelberg;Footnote 188 at Asciburgium on the Rhine, again associated with cremations;Footnote 189 and at Köngen on the Limes in Upper Germany, also with cremations.Footnote 190 It was selected for inclusion in graves associated with all types of settlement: for instance, at Argenton-sur-Creuse, Indre, in cremation and inhumation burials;Footnote 191 in cremation graves in Luxembourg;Footnote 192 amongst the graves forming the cemeteries outside the major civitas centres of the Nervii at Bavay (at La Fache des Près Aulnoys), and the Tungri at Tongeren (on the south-western outskirts) — though notably samian is not especially prominent in these urban circumstancesFootnote 193 — and at Baralle, Pas-de-Calais, within a cremation cemetery.Footnote 194 Examination of some graves and cemeteries from this region enables the incidence of samian in burials in Britain to be evaluated in a wider context. This is not intended as a comprehensive review of this evidence, rather several case studies drawn from a variety of sites provide some characterisation.
Excavations at Asciburgium in the northern cemetery in 1984 revealed c. 100 cremation burials covering, broadly, the mid-first century to the Antonine period.Footnote 195 Up until the period c. a.d. 83–85 there was a Roman military installation at the site, but following redeployment the associated civil settlement continued. Around 30 per cent of the burials had samian vessels present. As with the sample from southern Britain, dishes and cups predominate (including Drag. 18/31, 31 and 27). At this cemetery, however, four decorated samian bowls occur, plus a crater; all are seemingly examples of South Gaulish ware, four being Drag. 29, the other vessel being a Drag. 11.Footnote 196 These vessels probably, on the basis of chronology, relate to burials during the era of the fort when the military unit may have exercised a particular rite. Subsequently, during the civil era, no decorated bowls are included in graves, mirroring the pattern seen in Britain.
From the vicinity of the extensive Roman military and civil complex at Nijmegen, a comparatively large number of cremation graves — largely dating to the first century a.d. — with associated grave goods have been excavated.Footnote 197 Stuart's publication of the grave assemblages shows that plain samian vessels were commonly included with burials.Footnote 198 Some 378 samian vessels identified to form are noted, coming from several cemetery locations. No decorated samian bowls are reported and an assessment of the published listing for this survey shows the collection to be dominated by cups (mainly Drag. 27, plus Drag. 24/25) and small platters (Drag. 18, plus Drag. 15/17) with a few dishes (several Drag. 18/31s, apparently South Gaulish). There are no examples of the larger platters Drag. 15/17R nor 18R, and there are only two examples of the dish type Drag. 18/31R, neither very large, with the only other large plain vessel represented being a variant of a Drag. 36 dish.Footnote 199 Otherwise the samian vessels forming the collection are small forms. This dominance of the samian assemblage by small forms mirrors the pattern observed amongst the British sample, as reference to Table 16 confirms.
The cemetery excavated at Baralle in 1987 is essentially of Claudian-Trajanic date, and relates to a smaller civil centre lying adjacent to the Roman road from Cambrai to Arras.Footnote 200 Around 100 cremation graves have been excavated, yielding one or two, to several, ceramic grave goods per grave. In her discussion of the pottery from this cemetery Tuffreau-LibreFootnote 201 demonstrates that samian vessels are particularly associated with a type of rectangular burial-cut and that they only become prominent in the latter part of the first century a.d. when Terra Rubra and Terra Nigra vessels diminish in frequency, co-incident with other discernible changes in burial rites. A similar continuity in the use of Gallo-Belgic pottery in graves in the mid-first century is also seen at both King Harry Lane, Verulamium, and at Bavay, presumably because these cemeteries relate to indigenous communities with established cultural ties and traditions.Footnote 202 Again, at Baralle, samian cups (Drag. 27 plus Drag. 24/25) and dishes/platters (Drag. 15/17, 18 and 18/31) are the predominant forms represented; no decorated samian bowls are represented. This is also the case at Bavay, on the basis of information collated by Loridant and Deru.Footnote 203 Interestingly samian forms, especially copies of Drag. 27, reproduced in local Gallo-Belgic fabrics are prominent amongst the mid-first-century grave groups at the site at La Fache des Près Aulnoys, on the eastern approach to the city.Footnote 204 Such copies are seen elsewhere in the region, as at Fontaine-Notre-Dame (Nord) and in southern Britain, where, for example, one of two Flavian graves furnished with a range of items at Grange Road, Winchester contains similar imitations.Footnote 205 In these cases, were there simply insufficient samian cups available or was employment of local clay and manufacturing to reproduce samian forms a means of negotiating cultural change and tension?Footnote 206
In eastern Belgium, in the region of Limburg, a series of rural tumuli with furnished cremations of first- and second-century a.d. date have been excavated. At Berlingen, near Hoepertingen, north-west of Tongeren, a tumulus and cemetery was extensively excavated between 1968 and 1970.Footnote 207 One grave (No. 26), of Flavian date, was particularly well furnished, with some resemblance to the breadth of material items seen in the two contemporary burials from Grange Road, Winchester. The grave was provided with a structured arrangement of accoutrements including, in glass, a jug, a jar, a tankard, two ‘saucepans’ and two flasks, ceramic lamps, pottery flagons, pottery beakers and a jar, plus a series of metal items and 12 samian vessels, which constituted the majority of the pottery. The samian is South Gaulish, and largely intact, comprising: seven Drag. 27 cups, three Drag. 18 platters, all bearing a stamp with the same die, a Drag. 18R dish/platter, and a plain bowl resembling Ritt. 12 or Curle 11 minus the flange, and with spout and handles.Footnote 208 No decorated samian bowls or beakers occur. It has been speculated that this grave is of a person of status in the local community.Footnote 209 At Helshoven, south-west of Berlingen, by the Roman road between Tongeren and Tienen, a tumulus covering four furnished cremation burials was excavated in 1970, in this case dating to the mid-second century a.d.Footnote 210 Grave 1 contained a richly furnished assemblage, including a copper-alloy handled flask, a brooch, a ceramic bowl with lid, pottery jars, flagons, a mortarium, four coarse redware dishes similar in appearance to samian, and beakers, glass beakers, bottles and a dish, ceramic lamps, strigils and the fittings of a box, plus 11 samian vessels. The latter comprised six Drag. 27 cups, two with the same die stamp, four Drag. 18/31 dishes, and a Drag. 18/31R dish. As at Berlingen no decorated samian bowls (nor beakers) occur, while the only open forms within the burial (the mortaria apart) are samian, or pseudo-samian. Animal bones lay within several samian vessels. A second grave (No. 2) included a range of pottery vessels (flagons and jars) and a pair of Drag. 18/31s bearing the same die. A third grave contained a range of pottery, but only one samian form, namely a Drag. 18/31. The fourth burial contained no samian. Graves 1–3 are dated c. a.d. 125–150. Grave 1 at least might be seen as continuing the tradition observed in the Flavian period at Berlingen.
Other burials from this area of Belgium display a similar rite. That at Eben-Emael/Kanne, of first-century date, contained two Drag. 27s and four Drag. 18s; a burial at Rosmeer included one Drag. 27, one Drag. 18/31, an 18/31–18/31R, and a Drag. 38; the burial at Gors-Opleeuw contained four Drag. 27s and four Drag. 18/31s; and that at Riemst had eight Drag. 33 cups (with repeated dies), four Drag. 18/31s all with the same die, a Drag. 18/31R, and a Drag. 38; while the mid-second-century grave at Arsimont contained samian cups and dishes together with other non-samian items.Footnote 211 In all these cases, no decorated samian bowls or other decorated forms occur, which fully mirrors the pattern seen in southern Britain. The emphasis upon Drag. 27 and 33 cups and the dish/platter forms 18 and 18/31 is the same in both southern Britain and the burials from Limburg. There is one difference, however, in that four of the burials in Limburg contained one example of a larger samian dish (Drag. 18R or 18/31R), while in three a small plain samian bowl is present.
Overall, this brief examination of burials in the North-West of Roman mainland Europe shows that samian present within graves was highly selected, with repeated patterning through time and space, as was the case in southern Britain. The samples suggest the existence of either: (i) a shared cultural consciousness as to which vessel types it was appropriate to include (and exclude) with the burial (which apparently dates back to Late Iron Age practices); (ii) differing social definitions and practices which had the same outcome. The existence of levels of similar patterning with regard to samian inclusion in graves is remarkable given the great range of variables potentially operative within the milieux of human burial. On the other hand, actions around death and burial were a domain deeply influenced by social laws, cultural rules, repeated ‘norms’ and traditions within the communities of North-West Europe at this time.Footnote 212
VI. CONCLUSION
This project has enabled a great deal of data on the incidence of samian to be assembled. The analysis here is only part of the potential and the full data set is available for further study.Footnote 213
Samian travelled far and in quantity, but the how and why of its distribution are complex matters yet to be comprehensively explored (and not the purpose of this paper). MiddletonFootnote 214 and others have suggested military orders and markets were a key to its spread. This paper has clearly shown that it was used by a wide range of recipients. The Pompeii hoard, the ‘pottery shops’ and other consignment finds, plus wrecks, indicate some means of movement and marketing (albeit that these records result from extraordinary circumstances) that were not via great shipments, rather the samian of these groups was mixed and often unrepresentative of assemblages recovered from sites.Footnote 215 It might be said that it inevitably ‘got around’ for there was so much of it (the output was vast, as the scale of the production sites demonstrates); nonetheless there may still not have been enough of it to satisfy demand and Monaghan has suggested that the supply of pottery was typified by perpetual shortage.Footnote 216 Communities wanted it; a great variety of consumers found it useful practically and as a mark of status and/or a cultural indicator.Footnote 217 By purchase, contract, diplomacy, gift exchange or as an offering it was passed on and acquired to be employed and deployed in social situations, evidently conforming to shared norms. This article clarifies some of the structured normative ways it was used, following patterns of practice.
Data collected for this project demonstrate how the character of samian assemblages is strongly related to site type, status, function, exchange connections and identity. Clearly the incidence of samian is often patterned in a manner closely related to the social and economic fabric of the Roman province of Britain. The results of the Project confirm that the character of samian assemblages at sites appears to be a sensitive indicator of their status and identity.Footnote 218 It is evident that consideration of the composition of samian groups and assemblages from sites can prove instructive for our understanding of the nature of Roman Britain. Furthermore, a similar structure is apparent at sites across the Western provinces.
To a degree it is possible via the syntheses developed here to discern ‘normal patterns’ or parameters of samian occurrence by time, region and site type. Specific site assemblages and stratified groups can now be compared with such ‘normal patterns’ identified by the Project. Certain domains, such as the South-West peninsula and North Wales, have their own distinctive ‘normal’, which is qualitatively different from elsewhere and hence requires a different type of approach and analysis. The archaeology of Roman Britain is a rich patchwork of variation,Footnote 219 and syntheses such as the present study enable access to this variety and cast perspectives upon it. Whilst focusing upon samian, the Project has aimed to locate samian within its broader cultural milieux. This is only appropriate since samian is part of a wider nuanced record of life in Roman times. Hence the Project objectives and the discussion of findings have been integrated with the present general research aims in the study of the Roman era in Western Europe.
APPENDIX 1. REFERENCES RELATING TO SITES AND GROUPS USED IN TABLES 1, 2, AND 5A–C
Information is arranged alphabetically by site type in the following order: the site/excavation and assemblage/group/period is stated, its county or district is then documented (not repeated after the first entry), the context/s of the assemblage/group is given (using the coding system below), and finally references are noted; the latter are not repeated after the first entry for a site/excavation. Further details relating to these sites and groups can be found in Willis Reference Willis2005a, particularly in table 23.
Full bibliographic details for the references listed here can be found in Willis 2005a, and are not given here for reasons of brevity.
Key to context type abbreviations:
C, constructional contexts; CF, cemetery related features; D, ditch fill contexts; DG, mainly ditches and gullies; E, enclosure ditch fill contexts; F, floors; FD, debris from major fire; G, gully/ies; L, layer(s); LD, levelling and/or demolition; LSC, layer, probably cultivated soil; MD, mainly ditch fill contexts; MM, midden or midden-like deposit; MU, make-up layers; O, oven; P, pit fill(s); PG, penannular gully fills; PH, post-holes, including post-holes relating to buildings/structures; Q, fill of quarry pit(s); R, road surfaces and silts; S, slot(s); SD, fill of shallow depression; SL, silt layer(s); ST, stream channel fill(s); V, various; VI, various industrial; VS, various settlement deposits; W, well(s).
Military sites
Alcester, Baromix site 1969, Phase A; Warwickshire; Context: V; Booth and Evans Reference Booth and Evans2001; Ward 2001.
Alcester, Baromix site 1969, Phases B and C; Context: V.
Bar Hill fort, 1902–5; Dunbartonshire; Context: V; Robertson et al. 1975; Docherty and Wild 1975.
Birdoswald fort, 1987–92, Analytical Group 1; Cumbria; Context: V; Wilmott 1997; Dickinson 1997b; Mills 1997b.
Birdoswald fort, Field Study Centre, Site 585, 1997–8, Phases 1–6b/7; Context: VS; Wilmott Reference Wilmott2009; Willis Reference Willis2009b.
Birdoswald fort, the Spur, the Vallum fills, Phase 1; Context: D; Wilmott Reference Wilmott2009; Willis Reference Willis2009b.
Birdoswald fort, the Spur, middle and outer fort ditch fills, Phase 3; Context: D.
Brandon Camp fort, 1981–5; Herefordshire; Context: V; Frere 1987; Hartley 1987.
Brough-on-Humber, 1958–61; E Yorkshire; Context: V; Wacher 1969; Hartley 1969a.
Carlisle, Castle St, 1981–2, Period 3 (A and B); Cumbria; Context: VS, C, L; Taylor Reference Taylor1991.
Carlisle, Castle St, 1981–2, Period 4 (A, B and C); Context: VS, P, L.
Carlisle, Castle St, 1981–2, Period 5; Context: MM.
Carlisle, Castle St, 1981–2, Period 6A; Context: VS, C.
Carlisle, Tullie House, 1990; Context: D; Caruana Reference Caruana1992; Dickinson 1992; Hird 1992.
Castleford fort, 1977–84, Phase I; W Yorkshire; Context: V; Dickinson and Hartley Reference Dickinson, Hartley, Rush, Dickinson, Hartley and Hartley2000.
Cirencester, Admiral's Walk, 1973, DMI, DKI and II, Phases I and II; Gloucestershire; Context: V; Wacher and McWhirr Reference Wacher and McWhirr1982; Hartley and Dickinson 1982.
Colchester, Head St, 2000, Period 2; Essex; Context: V; Brooks Reference Brooks2004.
Corbridge, Red House, bath-house 1956–7; Northumberland; Context: V; Daniels 1959; Hartley 1959.
Corbridge, Red House, 1974; Context: V; Hanson et al. 1979.
Dover, A20 Bypass, Fort II of the Classis Britannica, 1970–7; Kent; Context: V; Philp 1981; Bird and Marsh Reference Marsh, Anderson and Anderson1981.
Exeter fortress; Devon; Context: V; Holbrook and Bidwell 1991.
Exeter, misc. late fortress deposits; Context: V; Bidwell 1979.
Exeter, Legionary Baths, Period 1A; Context: C, V; Bidwell 1979.
Exeter, Legionary Baths, Period 1B; Context: C, V.
Fishbourne, 1961–9, Period 1; W Sussex; Context: V; Cunliffe 1971; listing by M. Millett.
Hayton fort, 1975; E Yorkshire; Context: V; Johnson 1978; Pengelly 1978.
Hayton fort, 1975, Area S and part of Area N; Context: V; Johnson 1978; Pengelly 1978.
Kingsholm, Kingsholm Close 1972, Periods 1–3 and Phase 3.1; Gloucestershire; Context: V; Hurst 1985; Wild 1985a.
Kirkham, Dowbridge, fort; Lancashire; Context: V; Howard-Davis and Buxton 2000; Mills 2000.
Longthorpe I, 1967–73; Cambridgeshire; Context: V; Frere and St Joseph 1974; Hartley 1974.
Metchley forts, 1963–97, Areas 1–4; Birmingham; Context: V; Jones 2001; Pengelly et al. 2001.
Pomeroy Wood, 1997–9, Phase 2; Devon; Context: V; Fitzpatrick et al. 1999; Mills 1999.
Ribchester fort, 1980; Lancashire; Context: V; Buxton and Howard-Davis 2000; Dickinson 2000a.
Segontium fort (Caernarfon), 1975–9; Gwynedd; Context: V; Casey and Davies, with Evans 1993; King and Millett Reference King, Millett and Casey1993.
Segontium fort (Caernarfon), 1975–9, Periods 2–5; Context: V.
Segontium fort (Caernarfon), 1975–9, Period 5a; Context: V.
South Shields fort, main principia area, 1983–6, Period 5 construction; Tyne and Wear; Context: V; Bidwell and Speak 1994; Hartley and Dickinson 1994.
Strageath fort, 1973–86, Flavian phase; Perthshire; Context: V; Frere and Wilkes 1989; Frere and Hartley 1989.
Strageath fort, 1973–86, Antonine phases; Context: V.
Tiverton fort, 1981–6; Devon; Context: V; Maxfield 1991; Hartley 1991; Holbrook Reference Holbrook1991.
Tiverton fort, 1981–6, west ditch; Context: D.
Vindolanda, 1980; Northumberland; Context: V; Bidwell Reference Bidwell1985; Pengelly 1985.
Wall fort, 1968–72, Period 1; Staffordshire; Context: V; Round 1983; Hartley 1983.
Wall fort, 1968–72, Period 2; Context: V.
Wall fort, 1968–72, Period 3; Context: V.
Wall, 1968–72, Period 4; Context: V.
Whitchurch, 1965–6; Shropshire; Context: V; Jones and Webster Reference Jones and Webster1969; Wild 1969.
Extramural occupation at military sites
Alcester, Explosion site 1976–7, Phase 1; Warwickshire; Context: V; Booth and Evans Reference Booth and Evans2001; Ferguson 2001.
Alcester, Explosion site 1976–7, Phase 2; Context: V.
Brancaster, west vicus, Phase 2, 1974; Norfolk; Context: MD, VS; Hinchliffe with Sparey-Green Reference Hinchliffe and Sparey-Green1985; Andrews 1985; Dickinson and Bird Reference Dickinson and Bird1985.
Brancaster, west vicus, 1977; Context: MD, VS.
Caerleon, Cambria House, Building 1, 1988, Phases 2–5; Newport; Context: VS; Evans Reference Evans2000; Hartley Reference Hartley2000.
Carlisle, Blackfriars St, 1977–9, Building 1, Period 3; Cumbria; Context: VS, C, L; McCarthy Reference McCarthy1990; Taylor 1990.
Carlisle, Blackfriars St, 1977–9, Building 2, Period 3; Context: VS, C, L.
Carlisle, Blackfriars St, 1977–9, Building 2, Period 8 b–j; Context: VS, C, L.
Castleford vicus, 1977–84, Phase I; W Yorkshire; Context: VS; Dickinson and Hartley Reference Dickinson, Hartley, Rush, Dickinson, Hartley and Hartley2000.
Catterick, Bainesse, Site 46, 1981–2, Phase 4; N Yorkshire; Context: VS; Wilson Reference Wilson2002.
Catterick, Bainesse, Site 46, 1981–2, Phase 6; Context: VS.
Catterick, Bridge, Site 240, 1971–83, Phases 1–3/4; N Yorkshire; Context: VS; Wilson Reference Wilson2002.
Chester, 11–15 Castle St, 1976–8, Well II (8), primary silt; Cheshire; Context: W; Mason 1980; Bulmer 1980.
Colchester, Sheepen 1970, Period 3; Essex; Niblett Reference Niblett1985; Dannell 1985.
Greta Bridge, east and west vicus, 1972–4; Durham; Context: VS; Casey and Hoffmann 1998; Croom and Bidwell 1998.
Melandra vicus, 1966–9, ‘stream deposit’; Derbyshire; Context: ST; Webster 1971; Wild 1971.
Rocester, Mill Street, 2000, Phase 2; Staffordshire; Context: VS; Ferris forthcoming; Willis forthcoming e.
Stanwix vicus, Miles MacInnes Hall, 1986; Cumbria; Context: V; Caruana 2000; Dickinson 2000b.
Major civil sites
Canterbury, Marlowe, Period 1; Kent; Context: E, PG, V; Blockley et al. Reference Blockley, Blockley, Blockley, Frere and Stow1995, table 11.
Canterbury, Marlowe, (timber) Building R1, Period 2; Context: VS.
Canterbury, Rosemary Lane Car Park, 1976–7, Well 101; Context: W; Bennett, Frere, and Stow 1982; Pollard 1988.
Carlisle, Castle St, 1981–2; Period 8A; Cumbria; Context: VS, C, PH; Taylor Reference Taylor1991.
Carlisle, Castle St, 1981–2; Period 8B; Context: L.
Carlisle, Castle St, 1981–2, Period 9; Context: VS, C, MU.
Cirencester, Admiral's Walk, DMI pits 145/152/154 and 137/158; Gloucestershire; Context: P; Wacher and McWhirr Reference Wacher and McWhirr1982; Hartley and Dickinson 1982.
Cirencester, Ceramic Phase 2 (Insula VI, Period 2.2); Context: VS; Cooper 1998.
Cirencester, Ceramic Phase 3 Early (Insula VI, Period 3); Context: LD.
Cirencester, Ceramic Phase 3 Late (Insula VI, Period 3); Context: LD.
Cirencester, Ceramic Phase 4 (Insula VI, Period 2.3); Context: D.
Cirencester, Ceramic Phase 5 (Insula VI, Period 2 ‘Demolition’); Context: LD.
Colchester, Head St, 2000, Period 3; Essex; Context: VS; Brooks Reference Brooks2004.
Colchester, Head St, 2000, Period 5; Context: VS.
Colchester, North Hill, 1965; Context: VS; Dunnett 1966; Dannell 1966.
Colchester, Sheepen 1970, Period 4; Context: VS; Niblett Reference Niblett1985; Dannell 1985.
Dorchester, Prison, 1975, Pits 1 and 2; 1978 Pit 1; Dorset; Context: P; Draper and Chaplin 1982; Pengelly 1982a; 1982b.
Dorchester, County Hall, 1988, Period 2; Context: D, P, R, VS; Seager Smith 1993; Mills and Corney 1993.
Dorchester, South Grove Cottage, 1972, upper rampart, 13, 15, 16 and 45; Context: MU; Startin 1981; Draper and Startin 1981.
Exeter, Lower Combe St, 1990, Ditches 1 and 2; Devon; Context: D; Holbrook and Bidwell 1992.
Exeter, primary fill of fortress ditch, 1975; Context: D; Bidwell 1979.
Exeter, Forum-Basilica, Period 2A; Context: C; Bidwell 1979.
Exeter, Friernhay St, Phase A; Context: D; Holbrook and Bidwell 1992.
Exeter, Friernhay St, Phases B and C; Context: D.
Exeter, Rack St, 1975 Group C; 1977 Group D; Context: V; Holbrook and Bidwell 1991.
Exeter, The Valiant Soldier, 1973–4, Well VS 606; Context: W; Holbrook and Bidwell 1991.
Leicester, Causeway Lane, 1980/1991, Phase 1; Leicestershire; Context: P, VS; Connor and Buckley 1999; Clark 1999.
Leicester, Causeway Lane, 1980/1991, Phase 2; Context: VS.
Leicester, Causeway Lane, 1980/1991, Phase 3; Context: VS.
Leicester, Causeway Lane, 1980/1991, Phase 4; Context: P.
Leicester, Cumberland St, 1997, Phase 1; Context: P, VS/VI; Cooper 1998.
Leicester, St Nicholas Circle 1969, (163.1969) Phase 4; Context: R; Clay and Pollard Reference Clay and Pollard1994; Pollard Reference Pollard1994.
Leicester, St Nicholas Circle 1969, (164.1969) ‘Temple’; Context: VS; Pollard Reference Pollard1994.
Leicester, St Nicholas Circle 1971 and 1973, (south range of forum), Pollard's ‘Group 1’; Context: VS; Pollard Reference Pollard1994.
Leicester, St Nicholas St, 1965, (653.1965) Phase 4A; Context: O, P; Clay and Pollard Reference Clay and Pollard1994; Pollard Reference Pollard1994.
Leicester, St Nicholas St, 1965, (653.1965) Phase 7C; Context: MU.
Lincoln, 181–3 High St, 1972, Period 2; Lincolnshire; Context: VS; Darling and Jones 1988.
London, 18 Birchin Lane, 1983; Context: VS; Chadburn and Tyers 1984; Davies et al. 1994.
London, 5–12 Fenchurch St, 1983, Phases 1–2; Context: VS; Chadburn and Tyers 1984; Davies et al. 1994.
London, the site of the forum 1968–9, c. a.d. 60–100; Philp 1977; Dannell 1977.
London, Leadenhall Court, Period 2; Context: VS; Milne and Wardle 1993; Groves Reference Groves1993.
London, Leadenhall Court, Period 3; Context: VS.
London, Leadenhall Court, Period 4/5; Context: VS.
London, 25–6 Lime St, 1983, Phases 1–2; Context: VS; Chadburn and Tyers 1984; Davies et al. 1994.
London, 76–80 Newgate St, Periods 1–3; Context: VS; Chadburn and Tyers 1984; Davies et al. 1994.
London, 76–80 Newgate St, Period 7F; Context: VS / FD; Rhodes 1986, 202; Davies et al. 1994, 221.
London, Sugar Loaf Court, 1982, Phases 1–2; Context: VS; Chadburn and Tyers 1984; Davies et al. 1994.
(London) Southwark, Bonded Warehouse, BII-5, SE quarry; Context: Q; SLAEC 1978.
Southwark, Bonded Warehouse, BIII-1, contexts 24–30; Context: L/MU.
Southwark, Bonded Warehouse, BIII-2a, contexts 36–37; Context: L/MU.
Southwark, 64–70 Borough High St, fills of channel, c. a.d. 75–150; Context: ST; Graham 1988b; Hammerson 1988.
Southwark, 88 Borough High St, building and pits; Context: P, PH, S, VS; Yule and Hinton 1988; Hammerson 1988.
Southwark, 93–5 Borough High St, BII, layer 27; Context: ST; SLAEC 1978.
Southwark, 106–114 Borough High St, 1973–4, Building 2; Context: VS; SLAEC 1978.
Southwark, 199 Borough High St, early ditches etc.; Context: MD, L, P, W; Schaaf 1988; Hammerson 1988.
Southwark, 199 Borough High St, building etc.; Context: F, LD.
Southwark, 199 Borough High St, conduit etc.; Context: D, LD, P.
Southwark, 201–11 Borough High St, BIII-3, Pit 3, contexts 91–5; Context: P; SLAEC 1978.
Southwark, 201–11 Borough High St, BIII-3, Well 1, contexts 96–8; Context: W.
Southwark, DH Scheme, Area A, gravel pits; Context: Q; Graham 1988a; Hammerson 1988.
Southwark, 1–7 St Thomas St, 1974, Features F28 and F29; Context: P; SLAEC 1978.
Silchester, Forum-Basilica site, Period 2; Context: D, W, VS; Hampshire; Fulford and Timby 2000.
Silchester, Forum-Basilica site, Period 3; Context: P, VS.
Silchester, Manor Farm, 1980, Group 2.8 (primary ditch silts); Context: D; Fulford 1984.
Silchester, rampart section 1974, Group 1.1 (layers 19–35); Context: P, VS; Fulford 1984.
Silchester, section east of South Gate, 1974, Group 2.7 (layer 18); Context: LSC; Fulford 1984.
Silchester, ‘South West Angle’ 1978, Group 1.2 (layer 26); Context: MM; Fulford 1984.
Silchester, ‘South West Angle’ 1978, Group 2.1 (various layers); Context: LSC.
Silchester, ‘South West Angle’ 1978, Group 2.2 (layers 18 and 21); Context: LSC.
Silchester, ‘South West Angle’ 1978, Group 2.3 (layer 14); Context: L.
Verulamium, Insula XIV, Period IIA a, ‘pre-building activity’, likely well; Hertfordshire; Context: W; Frere Reference Frere1972; Hartley Reference Hartley1972a.
Verulamium, Insula XIV, building, Period IIC, Trench B IV; Context: VS; Frere Reference Frere1972; Hartley Reference Hartley1972a.
Verulamium, Insula XIV, Building XIV 3B, Period 2; Context: VS; Frere Reference Frere1983.
Verulamium, Insula XVII, 1956–7, early Neronian building; Context: VS; Frere Reference Frere1983, 37–43, 105–17.
Verulamium, Insula XVII, 1956–7, Flavian building; Context: VS; Frere Reference Frere1983, 102–19.
Verulamium, Insula XXI, Building 21 1A; Context: VS; Frere Reference Frere1983.
Verulamium, Insula XXII, 1955, roadside ditch, Street xxi/xxii; Context: D; Frere Reference Frere1983, 179.
Whitchurch, 1965–6; Shropshire; Context: VS; Jones and Webster Reference Jones and Webster1969; Wild 1969.
Sites with agrarian character by major civil centres
Canterbury, Rosemary Lane Car Park 1976–7, ‘Pre-Flavian’ period; Kent; Context: VS; Bennett et al. 1982; Bird 1982a.
Canterbury, Marlowe Car Park, Period 2; Context: VS; Blockley et al. Reference Blockley, Blockley, Blockley, Frere and Stow1995; Bird 1995.
Smaller civil centres
Alcester, Baromix site 1972/2, Phase F; Warwickshire; Context: VS; Booth and Evans Reference Booth and Evans2001; Ward 2001.
Alchester, A41 dualling, 1991, Period 4; Oxfordshire; Context: D, VS; Booth et al. 2001; Dickinson 2001d.
Alchester, A41 dualling, 1991, Period 5; Context: D, VS.
Alchester, A41 dualling, 1991, Period 6; Context: D, PH, VS.
Alchester, A41 dualling, 1991, Period 7; Context: D, P, VS.
Ariconium, 1967, Analytical Group 4; Herefordshire; Context: L; Jackson forthcoming; Willis forthcoming a.
Ariconium, Field HWCM 21376, fieldwalking c.1963; Jackson forthcoming; Willis forthcoming a.
Ariconium, Field HWCM 21376, fieldwalking 1986; Jackson forthcoming; Willis forthcoming a.
Asthall 1992, Area A; Oxfordshire; Context: VS; Booth Reference Booth1997; Mills 1997a.
Asthall 1992, Area B; Context: VS.
Braintree, College Road, Well 102 and Ditch 307; Essex; Context: W, D; Garwood and Lavender 2000; Martin 2000b.
Castor, Normangate Field, Area 14, pit fill layers 7–9; Cambridgeshire; Context: P; Perrin and Webster 1990.
Catterick, Bainesse, Site 46, 1981–2, Phase 7; N Yorkshire; Context: VS; Wilson Reference Wilson2002.
Chelmsford, SE sector, Ceramic Phase 1; Essex; Context: D, S; Going 1987.
Chelmsford, SE sector, Ceramic Phase 2; Context: P, PH, S.
Chelmsford, SE sector, Ceramic Phase 3; Context: LD.
Chelmsford, SE sector, Ceramic Phase 4; Context: P, V.
Chelmsford, SE sector, Ceramic Phase 5; Context: D.
Coggeshall, The Lawns, 1989–93, Phase 4.2; Essex; Context: MU, PH, S; Isserlin Reference Isserlin1995; Martin Reference Martin1995; Rodwell 1995.
Coggeshall, St Peter's School, 1984, Phase 4.1; Context: D, G; Clarke 1988.
Great Dunmow, Chequers Lane, 1970–2, gravel pit 857; Essex; Context: P; Wickenden 1988; Going and Ford 1988.
Hayton, Burnby Lane, 1995–9; E Yorkshire; Context: VS; Millett and Halkon forthcoming; Willis forthcoming b.
Heybridge, Elms Farm, Ceramic Phase 4, Key / Pool Groups; Essex; Context: D, P; Atkinson forthcoming; Compton et al. forthcoming.
Heybridge, Elms Farm, Ceramic Phase 5, Key Groups; Context: P.
Heybridge, Elms Farm, Ceramic Phase 6, Key Groups; Context: D, P.
Heybridge, Elms Farm, Ceramic Phase 7, Pool Groups; Context: P.
Heybridge, Elms Farm, Ceramic Phase 8, Key Groups; Context: P.
Heybridge, Elms Farm, Well 6280 fill 16083; Context: W.
Kelvedon, Star and Fleece Hotel, Quarry F1042; Essex; Context: Q; Fell and Humphrey 2001; Fawcett Reference Fawcett, Fell and Humphrey2001.
Kenchester, 1977–9, Period 2c, Building AJ; Herefordshire; Context: VS; Wilmott and Rahtz 1985; Dickinson and Hartley 1985.
Meole Brace, 1989–90, Phase 2; Shropshire; Context: VS; Ellis et al. 1994.
Meole Brace, 1989–90, Phase 3; Context: SL.
Neatham, 1969–79, Ditch 2; Hampshire; Context: D; Millett and Graham 1986; Bird Reference Bird, Millett and Graham1986b.
Neatham, 1969–79, Pits 5 and 17; Context: P.
Neatham, 1969–79, Pits 8 and 20; Context: P.
Neatham, 1969–79, Pit 11; Context: P.
Neatham, 1969–79, Pits 12; Context: P.
Neatham, 1969–79, Structure 3; Context: PH, S.
Neatham, 1969–79, Well 4; Context: W.
Neatham, 1969–79, Well 7; Context: W.
Pomeroy Wood, 1997–9, Phase 4i; Devon; Context: VS; Fitzpatrick et al. 1999; Mills 1999.
Shepton Mallet, Fosse Lane, 1990, Period 1; Somerset; Context: VS; Leach with Evans, C.J. Reference Leach and Evans2001; Evans, C.J. 2001.
Shepton Mallet, Fosse Lane, 1990, Building X, Period 2; Context: VS.
Shepton Mallet, Fosse Lane, 1990, Building VII, Period 2; Context: VS.
Shepton Mallet, Fosse Lane, 1990, Building IX, Period 3; Context: VS.
Towcester, Alchester Road, Phase 2; Northamptonshire; Context: VS; Brown et al. 1983; Bird et al. 1983.
Wantage, Denchworth Road, 1996 and 1998, Period 1; Oxfordshire; Context: D, P, PG, R; Barber and Holbrook Reference Barber and Holbrook2001; Timby 2001.
Wantage, Mill St, 1993–4, Phase 1; Context: D; Holbrook and Thomas Reference Holbrook and Thomas1996; Timby 1996.
Religious / ritual sites
Chanctonbury Ring, Area A, Feature 3; W Sussex; Context: L; Bedwin 1980; Rudling 1980.
Chanctonbury Ring, Area B, Feature 111; Context: SD.
Chanctonbury Ring, Area D, Layer 3; Context: E.
Chelmsford, NE Sector, Site K, Ditch 205; Essex; Context: E; Wickenden 1992; Going 1992b.
Chelmsford, NE Sector, Site K, Pit K90.2; Context: P.
Uley, 1977–9, Phase 3; Gloucestershire; Context: V; Woodward and Leach 1993; Leach 1993.
Religious / ritual sites with military association
Rocester, Orton's Pasture, 1990/1995–6, ditch fills, Phase 1; Staffordshire; Context: D; Ferris et al. 2000; Willis 2000b.
Rocester, Orton's Pasture, 1990/1995–6, pit fills, Phase 1; Context: P.
Rocester, Orton's Pasture, 1990/1995–6, pits/wells F602, 603, 604; Context: P/W.
Industrial sites
Droitwich, Old Bowling Green, 1977–9, brine pit /structure 13, Phase 5; Worcestershire; Context: P; Woodiwiss 1992; Dickinson 1992b.
Droitwich, Old Bowling Green, 1977–9, brine tanks etc., Phase 5; Context: P.
Droitwich, Upwich, 1983–4, Phase 2; Context: VI; Hurst 1997; Lentowicz 1997.
Rural / industrial sites
Holbeach St Johns, Shell Bridge, 1961, Sites A and B; Lincolnshire; Context: VS; Bell et al. 1999; Gurney 1999; Hartley 1999; Dickinson Reference Dickinson, Going and Hunn1999b.
Rural / likely religious-ritual site
Shoreham, Slonk Hill, 1969–74; W Sussex; Context: V; Hartridge 1978; Fulford 1978.
Rural sites
Bignor, 1985, Trench 85.X, context 2; W Sussex; Context: D/L; Aldsworth and Rudling 1995; Lyne 1995.
Bignor, 1985, Trench 85.W, context 12; Context: P or SD.
Birdlip Quarry, Structure 1463, Gully 1450, Phase 2A; Gloucestershire; Context: PG; Mudd et al. Reference Mudd, Williams and Lupton1999; Timby Reference Timby1999.
Birdlip Quarry, Structure 1464, Gully 1451, Phase 2B; Context: PG.
Brenley Corner, Area 3.3/3.7, Ditch 1; Kent: Context: D; Pollard 1988, appendix 5.
Brockworth, 1973, Periods I–IV; Gloucestershire; Context: D; VS; Rawes 1981.
Chells, Boxfield Farm, Ceramic Period 1; Hertfordshire; Context: VS; Going and Hunn 1999; Waugh 1999.
Chells, Boxfield Farm, Ceramic Period 2; Context: VS.
Chells, Boxfield Farm, Ceramic Period 3, Well CAB, middle layers 6–13; Context: W.
Chells, Boxfield Farm, Ceramic Period 4; Context: VS.
Church Langley, Old House, Ceramic Phase 3; Essex; Context: D, G, P; Foreman 2000; Martin 2000a.
Crookhorn, 1974–5, Site A (aisled building); Hampshire; Context: E, L, O, P, PH; Soffe et al. 1989.
Dragonby, ditch feature 1682; N Lincolnshire; Context: D; May 1996; quantification by author.
Duntisbourne Grove, ditch group, Ditch 8; Gloucestershire; Context: D; Mudd et al. Reference Mudd, Williams and Lupton1999; Timby Reference Timby1999.
Duntisbourne Grove, ditch group, Ditch 9; Context: D.
Duntisbourne Grove, ditch group, Ditch 114; Context: D.
Great Dunmow, Buildings Farm, Phase 3; Essex; Context: D; Lavender 1997; Wallace 1997.
Great Witcombe villa, 1960–73, Period 2; Gloucestershire.; Context: VS; Leach 1998.
Haddon, Haddon Lodge, 1999, Phase 3; Cambridgeshire; Context: VS; Hinman 2004; Evans 2004; Willis 2004b.
Haddon, Haddon Lodge, 1999, Phase 4; Context: VS.
Hassocks, Stonepound Pit, building; W Sussex; Context: VS; Lyne 1994.
Kingscote, Site 2, Quarry 3, Layer 299; Gloucestershire; Context: Q; Timby 1998.
Littlehampton, Belloc Rd, Ditch G; W Sussex; Context: D; Gilkes 1993; Lyne Reference Lyne1993.
Lullingstone villa; Kent; Context: VS; Meates Reference Meates1987; Simpson Reference Simpson1987.
Maxey, Phase 7–8; Cambridgeshire; Context: VS; Pryor et al. 1985; Wild 1985b.
Maxey, Phase 8; Context: VS.
Middle Duntisbourne, ditch group, Ditch 4; Gloucestershire; Context: D; Mudd et al. Reference Mudd, Williams and Lupton1999; Timby Reference Timby1999.
Milton Keynes, Sherwood Drive, Ditch 2; Buckinghamshire; Context: D; Marney 1989; Pengelly 1989.
Milton Keynes, Woughton, Area C, Pit 31; Context: P.
Normanton-Le-Heath, Phase 7; Leicestershire; Context: E, PS; Thorpe et al. 1994; Marsden 1994.
North Claines, Linacres Farm, 1994; Worcestershire; Context: VS; Dalwood et al. 1998; Dickinson and Hurst 1998.
Nursling, Dairy Lane, Phases 1–3; Hampshire; Context: E, P, PH; Adam et al. 1997; Seager Smith 1997.
Oakridge, 1965–6, Phase 2C; Hampshire; Context: MD; Oliver 1992.
Oakridge, 1965–6, Phase 3A (excluding well); Context: MD, P.
Orton Hall Farm, Period 1; Cambridgeshire; Context: D; VS; Mackreth 1996; Wild 1996.
Orton Hall Farm, Period 2; Context: VS.
Rayne, 1987; Essex; Context: VS; Smoothy Reference Smoothy1989; Cheer Reference Cheer1989.
Rivenhall, Period 3A; Essex; Context: VS; Rodwell and Rodwell Reference Rodwell and Rodwell1993; Going Reference Going1993.
Ructstalls Hill, 1972–5, Period 2 B; Hampshire; Context: MD; Oliver and Applin 1978; Stephenson 1978.
Ructstalls Hill, 1972–5, Period 2 C; Context: MD.
Salford Priors, 1993, Area C1, Phase 2; Warwickshire; Context: MD; Palmer 1999; Evans, J. 1999; Dickinson Reference Dickinson1999c.
Salford Priors, 1993, Area C1, Phase 3 A–C; Context: D, E, PH.
Salford Priors, 1993, Area C1, Phase 4; Context: MD.
Salford Priors, 1993, Area D, Phase 1; Context: D, P, PH.
Scotch Corner, 1995; N Yorkshire; Context: VS; Abramson 1995; quantification by author.
Snettisham Bypass, 1989, Site 1555; Norfolk; Context: VS; Flitcroft Reference Flitcroft2001; Dickinson Reference Dickinson2001a.
South Malling, Ranscombe Hill, Ditch 5; E Sussex; Context: D; Bedwin 1978; Green 1978.
South Malling, Ranscombe Hill, Ditch 6; Context: D.
Strensham, Phase 3; Worcestershire; Context: D, G, PH; Jackson et al. 1996; Dickinson 1996c.
Thorpe Thewles, Phase 3; Stockton; Context: D, PG; Heslop 1987; Millett 1987c.
Thorpe Thewles, Phase 4; Context: E.
Tort Hill East, Period 2A; Cambridgeshire; Context: DG; Ellis et al. 1998; Hancocks et al. 1998.
Tort Hill West, Period 3A; Context: D; Ellis et al. 1998.
Watchfield, 1998, Area 7, Phase 5; Oxfordshire; Context: MD, CF; Birbeck 2001; Laidlaw 2001.
Watchfield, 1998, Area 10, Phase 5a; Context: MD.
Watchfield, 1998, Area 10, Phase 5b; Context: MD.
Weeting, Fengate Farm, make-up within building; Norfolk; Context: MU; Gregory and Gurney Reference Gregory and Gurney1996.
Whitton, 1965–70; Vale of Glamorgan; Context: VS; Jarrett and Wrathmell 1981; Webster 1981.
Winterton villa; N Lincolnshire; Context: VS; Stead 1976; Hartley and Pengelly Reference Hartley, Pengelly and Stead1976.
Worth Matravers, Compact Farm, Quarry Field, Phase 2c–e; Dorset; Context: C, LD, MM, VS; Graham et al. 2002; Seager Smith 2002.
Other sites
Boxgrove, Devil's Ditch, east terminal, early fills (contexts 129, 152, 155, 191); W Sussex; Context: D; Bedwin and Orton 1984; Orton 1984.
Boxgrove, Devil's Ditch, east terminal, fill of re-cut (contexts 130–2, 140, 192); Context: D.
Boxgrove, Devil's Ditch, east terminal final filling (contexts 7, 30); Context D.
Buchlyvie, Fairy Knowe Broch, post-Phase 1; Stirlingshire; Context: VS, LD; Main 1998; Willis Reference Willis1998b.
Fishbourne, 1961–9, Period 2; W Sussex; Context: VS; Cunliffe 1971; listing by M. Millett.