


1. History
In 1992/93, the two deep drilling projects GRIP (Greenland Icecore Project) and GISP2 (Greenland Ice Sheet Project 2) were completed. These two drillings were situated at the summit of the Greenland ice sheet, only 28 km apart.1 the stable-isotope records have been measured for these cores in order to establish a palaeoclimatic history (Reference DansgaardDansgaard and others, 1993; Reference Grootes, Stuiver, White, Johnsen and JouzelGrootes and others, 1993; Reference JohnsenJohnsen and others, 1997).
The two isotope records show correlation for the upper 2700m (Reference Alley, Gow, Johnsen, Kipfstuhl, Meese and ThorsteinssonAlley and others, 1995). Below this depth, however, large discrepancies between the records begin to occur. the bottom 500 m span ice older than 60 kyr including the entire Eemian interglacial 115–135 kyr BP. This climatic period is of special interest because of what we might learn about the stability of the current climate. Below 2700 m, the isotope records from the two ice cores differ and cannot be correlated. Since the two drill sites are situated so close to each other, the large differences in the two records have been regarded as an artifact arising from disturbed stratigraphy due to the bedrock undulations and flow patterns unique to the basal zone (Reference Thorsteinsson, Kipfstuhl and MillerThorsteinsson and others, 1997).
In order to obtain a more reliable Eemian record, a search was initiated for a new drill site. Since the disturbances are constrained to the basal zone, the principal search criterion was to have the Eemian layer located relatively high in the core over a relatively flat bed. the search was restricted to ice ridges in order to minimize the shear stress, which simplifies the interpretation. Among other criteria were: (1) an accumulation rate so low that the Eemian ice is far from the bedrock without basal melting, (2) little horizontal flow, and (3) no melting at the bed (Reference Dahl-JensenDahl-Jensen and others, 1997).
Radio-echo soundings were carried out along the ice ridge north of Summit (Reference Chuah, Gogineni, Allen and WohletzChuah and others, 1996). These measurements show the depth of internal reflectors within the ice. Each reflector is believed to represent an event such as a volcanic eruption orabrupt change in climate and can be thought of as an isochrone. It is not possible to distinguish reflectors in the lower half of the profile. Therefore, the depth of the Eemian needed to be predicted by using a flow model that best fit the observed isochrones. the bedrock temperature was calculated using a combined flow/heat model. on these grounds, the NorthGRIP drill site was chosen.2 the predicted depth of the Eemian at NorthGRIP was 2750–2850m.
The drilling of NorthGRIP has reached 3001 m, and the Eemian has not yet been found. Therefore the expectations have clearly not been met. This suggests that the flow history is different from that modelled during the search. In order to obtain a better understanding of the flow, a simple model with a few more degrees of freedom than the one used in the search has been used here. the inverse Monte Carlo analysis will then be applied to find the most likely model parameters.
2. The D.J. Flow Model
Because little is known about the flow in this region, a Dansgaard–Johnsen (D.J.) type flow model has been selected (Reference Dansgaard and JohnsenDansgaard andJohnsen, 1969). This model has few parameters, can be solved analytically and allows very large time-steps, factors which make it suitable for inclusion in a Monte Carlo algorithm. the D.J. model can be described by the following equations.
The coordinate system (x, y, z) is placed so the x axis runs along the ridge in the direction of the flow at NorthGRIP. the z axis is the vertical height above bedrock. the flow at NorthGRIP is 1.329±0.015 m a–1 along the ice ridge (Reference Hvidberg, Keller and GundestrupHvidberg and others, 2002). the velocity field (U, V,W) is thus described by U and W, defined as:
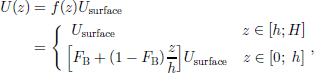
where f(z) is a shape factor, H is the ice thickness in ice equivalent, and h is a characteristic height above the bedrock. the surface velocity, Usurface, and the bedrock velocity, Ubed, are boundary conditions. FB = Ubed/Usurface is the fraction of bottom sliding.
The vertical velocity is given by Reference Dansgaard and JohnsenDansgaard andJohnsen (1969):
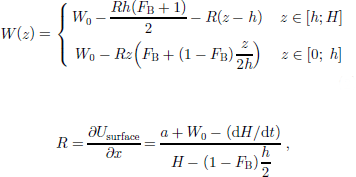
where the accumulation rate, a, and the basal melting rate, –W0, both in ice equivalent, are the boundary conditions.
In the calculations, a, W0 and FB are assumed to be time-dependent as described in the following sections, while h andH are assumed to remain constant. the parameter h is unknown and must be determined by the Monte Carlo inversion.
3. Accumulation Model
The past accumulation rates are calculated using a model similar to that developed for the dating of the GRIP ice core (Reference JohnsenJohnsen and others, 1997). the model relates the accumulation rate to the δ18O value:
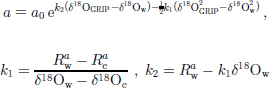
in which a present-day value δ18Ow = –35.2‰ and a glacial value δ18Oc = –40.0‰ are defined. a0 is the present-day accumulation rate at NorthGRIP. the time-dependent δ18O value is taken from the GRIP data.  and
 are the relative slopes of a(δ18OGRIP).

The relative slopes and are unknown constant parameters.
4. Melt and Sliding Model
The basal melt rate –W0 can be calculated directly by assuming energy balance (Reference PatersonPaterson,1994).

ρ being the density of ice, L the specific latent heat of fusion and G the geothermal heat flux which is assumed to be constant in time. Qc is the heat flux which is transferred from the bed through the ice.
A simple heat-flow model is used to make an estimate of Qc:

where k is the thermal diffusivity and the vertical velocity is assumed to be w = –a(H – z)/h. the model is steady-state, one-dimensional and ignores internal heat generation. Knowing the boundary conditions Tsurface and (dT/dz)base = –Qc/K, the following relation can be calculated analytically (Reference PatersonPaterson,1994):

For the conditions at NorthGRIP, Equation (7) can be approximated by
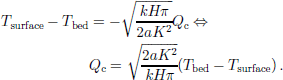
Now Qc can be calculated as a function of surface temperature and accumulation rate, assuming that the basal ice is at the pressure-melting point (Tbed = –2.4˚C). In this estimate, the relation between the surface temperature and the δ18O values has been taken fromReference Johnsen, Dahl-Jensen, Dansgaard and GundestrupJohnsen and others (1995).
If G is less than Qc, basal melting is discarded and we set Qc = G. the model gives a rough estimate of the Qc value to be used in the Monte Carlo calculations. It does not account for the time needed to reach steady-state temperature profiles in the ice. the next development would be to include a true time-dependent heat energy model.
The fraction of sliding is modelled assuming that FB is linearly dependent on the melt rate:

The main differences between the collective model presented here and the model used during the search are that the new model allows for the melt rate (W0) and the fraction of sliding (FB) to be non-zero. Furthermore, it has an independent accumulation model.
5. Monte Carlo Inversion
The combined model has five unknown model parameters: h from the flow model (Equation (2)), G and dFB/dW0 from the melt and sliding model (Equations (5) and (9)) and Raw and R; from the accumulation model (Equation (3)). Each combination of these parameters constitutes a model (m) in the five-dimensional model space. the observed dataset (dobs) consists of age/depth horizons (fix points) determined in the NorthGRIP ice core. to evaluate the quality of a modelled dataset (dmodel), a likelihood function L(m) is defined. This is done by introducing a misfit function S (m):

The likelihood function takes the form L(m) = c e–S(m), where c is a normalization constant. the uncertainties (σi) in dobs originate primarily from uncertainties in the GRIP time-scale. Hence, uncertainties are estimated by comparing four different time-scales of GRIP and GISP2, looking at specific events such as the Z2 ash layer and the Campanian Ignimbrite event. These uncertainties in years are then converted to NorthGRIP depths using dobs.
In order to determine the flow history, this dataset is inverted into a probability distribution of the five model parameters, being interested not only in the most likely model, but also in the resolution power. the direct way to do this is to make an exhaustive search of the entire model space, and store the likelihood of each point. the resulting distribution is called the posterior-probability distribution (Reference MosegaardMosegaard, 1998). However, this is not feasible since it requires huge amounts of storage and processing power.
Inverse Monte Carlo sampling is an importance sampling method which can significantly reduce the number of calculations needed to estimate the posterior-probability distribution. In the Monte Carlo scheme used here, a random walk is made in the model space. A perturbed model mtest of the current model mcurrent is proposed. the perturbed model becomes the next model according to an acceptance probability

The resulting set of accepted models can be shown to be sampled according to the posterior-probability density (Reference Mosegaard and TarantolaMosegaard and Tarantola, 1995). the frequency of accepted models, in a subspace of the model space, indicates how probable models are in this area. It is also worth noting that a mean of a model parameter over all the accepted models can be regarded as a posterior-probability weighted mean.
6. Discussion
The random walk was continued until a total of 200 000 models were accepted. Histograms of all model parameters can be seen in Figure 1. These histograms represent the relative likelihood of the model parameters.
Probability distributions for the model parameters derived from inverse Monte Carlo analysis. (a) the geothermal heat flux, G, (Equation (5)) at NorthGRIP is approximately double the expected 51mWm–2. (b) the kink point h of the D.J. flow model (Equation (1)). (c, d) the relative slopes of a warm and a cold control point, respectively, in the accumulation model (Equation (3)). (e) the dependence of the fraction of sliding upon the basal melt rate (Equation (9)). the mean model corresponds to a mean fraction of sliding of 41% during the Holocene and 53% under glacial conditions.
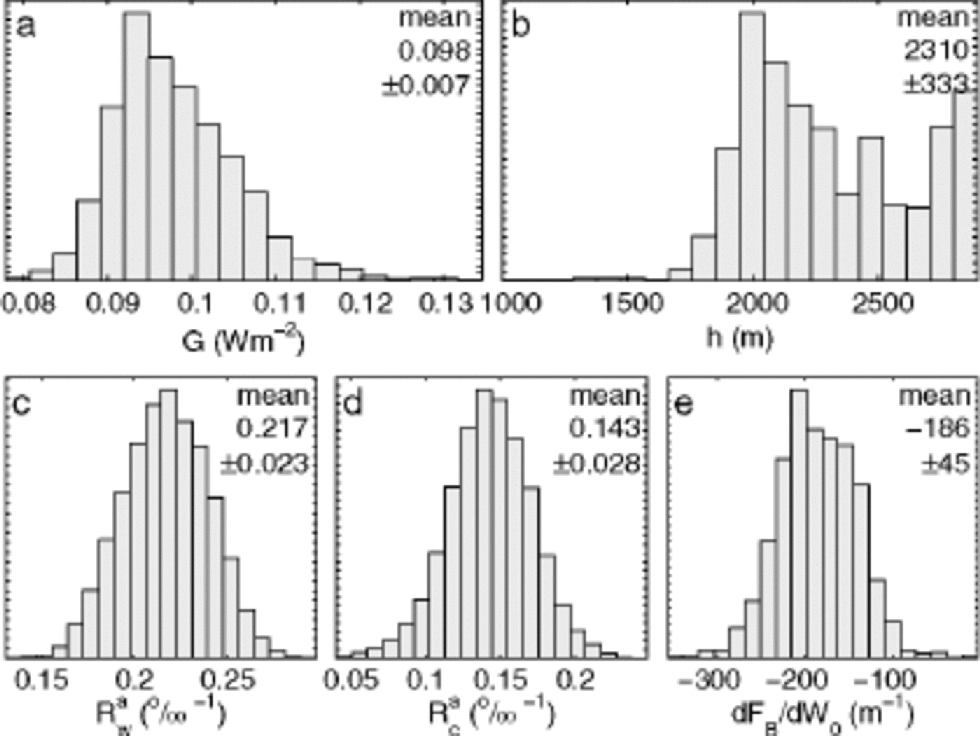
The flow kink point h has the value 2310 ±333 m(Fig.1b). the probability distribution for h shows multiple maxima. the Monte Carlo analysis fails to find an unambiguous value because the specific choice of h has little impact on the misfit when FB is high. Luckily, the effect on the inversion of the other parameters is small.
The Monte Carlo-tuned NorthGRIP accumulation-model parameters were found to have values  ±0.02‰ –1 and
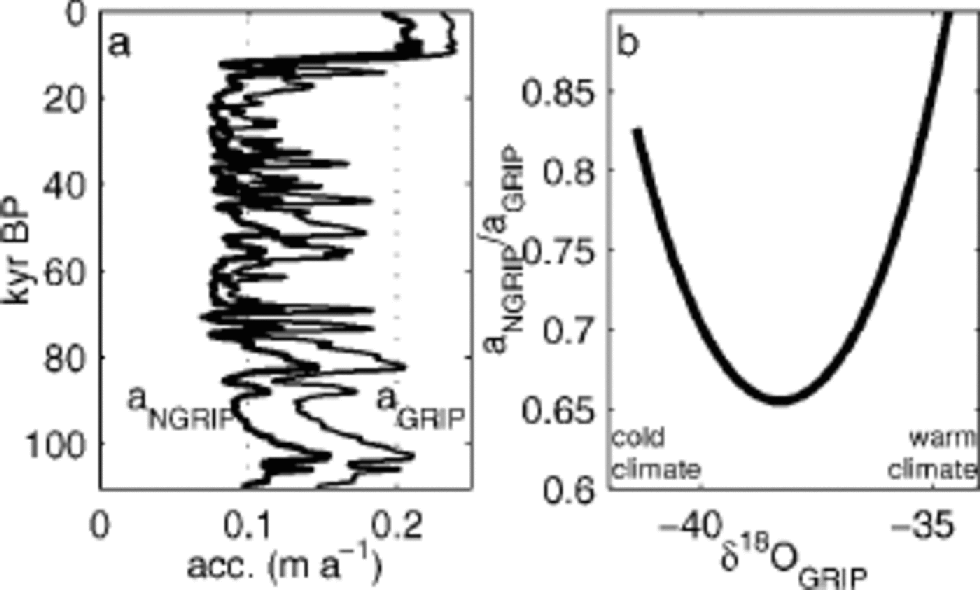
 (Fig. 1c and d). the accumulation ratio aNorthGRIP/aGRIP was expected to be constant through different climatic conditions. As seen in Figure 2, this is not the case. the accumulation pattern seen today was more pronounced during glacial times. the present-day relative accumulation pattern shows that the accumulation rate at NorthGRIP is 83% of that at GRIP. During glaciation, it was as low as 66% of that at GRIP.
(a) the accumulation rate at NorthGRIP derived from the modelled parameters. the thin curve shows the accumulation rate at GRIP (Reference Johnsen, Dahl-Jensen, Dansgaard and GundestrupJohnsen and others, 1995) in comparison. (b) the ratio of the accumulation rates for GRIP and NorthGRIP. Both accumulation models are a function of δ18OGRIP. During glacial conditions the ratio aNorthGRIP/aGRIP was as low as 80% of present-day values.
The geothermal heat flux at NorthGRIP implied by the Monte Carlo method is 98 ±7 mWm–2 (Fig. 1a). This is twice the value of the Precambrian shield (51 mWm–2) which is believed to cover most of Greenland. Since there is no melting at GRIP, the geothermal heat flux at GRIP can be directly observed to be 51 mWm–2 (Dahl-Jensen and others, 1998). the change to 98 mWm–2 cannot be seen as a dip in the radio-echo-derived isochrones along the ridge. the mean model gives a mean melt rate of 2.2 mma–1 during the Holocene and 2.8 mma–1 during the glacial.
The probability distribution of dFB/dW0 (Fig. 1e) has a mean of dFB/dW0 = –186±45 years m–1. Using the mean model, this corresponds to a mean fraction of sliding of 41% and 53% for the Holocene and glacial periods, respectively.
7. Conclusions
The reason no Eemian is seen in the NorthGRIP ice core is that there is melting at the bottom. from the Monte Carlo analysis it is concluded that the geothermal heat flux at NorthGRIP is 98 ±7 mWm–2. This is considerably higher than the value for the Precambrian shield which is believed to cover most of Greenland. from bottom topography maps it is seen that the bedrock is very flat in the NorthGRIP area. One possible explanation for the flatness and higher heat flux might be that the bed beneath NorthGRIP is composed of sediments.
At present the accumulation rate at NorthGRIP is 83% of that at GRIP. During the glaciation it was as low as 66% of that at GRIP (Fig. 2).
For the mean model it can be calculated that the mean melt rate at NorthGRIP is 2.7 mma–1 and the mean fraction of sliding is 50%, for the past 89 kyr.
The model presented here predicts the depth of the Eemian to be 2890 m. This is at least 110m too high in the core. the simple model presented here cannot give a correct prediction of the Eemian without losing the fit on the fix points younger than 89 kyr. This suggests that the oldest ice at NorthGRIP has experienced a higher melting upstream. A zone of increased divergence is found 120 km upstream from NorthGRIP. In Reference Hvidberg, Keller and GundestrupHvidberg and others (2002) it is estimated that ice older than 90 kyr has been influenced by the flow in this region.
During the search for the NorthGRIP ice-core drilling site, modelling showed that the basal ice at NorthGRIP had been close to the melting point (Reference Dahl-JensenDahl-Jensen and others, 1997). the 52 kyr BP radio-echo horizon was the oldest horizon used to tune the models. We should not put too much trust in models which are not well constrained by observations. In retrospect, high modelled basal temperatures should have served as a warning of a relatively high probability of basal melting.
Although the goal of obtaining a core with a good Eemian record was not achieved, the melting had the fortunate side-effect that it stretched the glacial record. the NorthGRIP core has the highest resolution yet of the 110 kyr glacialperiod.



