Introduction
Anxiety disorders are among the most prevalent and costly psychiatric disorders (Rice and Miller, Reference Rice and Miller1998; Kessler et al., Reference Kessler, Berglund, Demler, Jin, Merikangas and Walters2005; Olesen et al., Reference Olesen, Gustavsson, Svensson, Wittchen and Jonsson2012) and the understanding of their neural mechanisms remains limited (Sylvester et al., Reference Sylvester2012). Anxiety symptoms and disorders have received considerable attention from functional imaging studies which determined the implication of several brain areas including the amygdala, ACC, prefrontal cortex (PFC), and insula (Etkin and Wager, Reference Etkin and Wager2007; Stein et al., Reference Stein, Simmons, Feinstein and Paulus2007; Sylvester et al., Reference Sylvester2012). On the other hand, anxiety has received less attention from structural imaging studies and these studies showed confusing findings.
Most of the literature on the relationships between anxiety and gray matter characteristics has assessed pathological anxiety. It was reported that anxiety disorders were associated with decrease (Uchida et al., Reference Uchida2003; Massana et al., Reference Massana2003a; Reference Massana2003b; Yoo et al., Reference Yoo2005; Protopopescu et al., Reference Protopopescu2006; Asami et al., Reference Asami2008; Uchida et al., Reference Uchida2008; Asami et al., Reference Asami2009; Hayano et al., Reference Hayano2009; Roppongi et al., Reference Roppongi2010; Sobanski et al., Reference Sobanski2010; van Tol et al., Reference van Tol2010) or increase (Szeszko et al., Reference Szeszko2008; Uchida et al., Reference Uchida2008; Schienle et al., Reference Schienle, Ebner and Schafer2011) in gray matter volume in the amygdala and in various cortical areas including the ACC, insula, temporal, PFC, parahippocampal, and orbitofrontal (OFC). Increased temporal cortical thickness was observed in patients with social anxiety disorder compared to healthy controls (Frick et al., Reference Frick, Howner, Fischer, Eskildsen, Kristiansson and Furmark2013) and worry severity in patients with generalized anxiety disorder was positively correlated with gray matter volume in the ACC, PFC, and OFC volumes (Mohlman et al., Reference Mohlman, Price, Eldreth, Chazin, Glover and Kates2009; Schienle et al., Reference Schienle, Ebner and Schafer2011). Very few studies on the topic have measured trait or anxiety symptoms. In healthy participants, associations between subclinical anxiety symptoms and gray matter appeared in similar brain areas as in participants with pathological anxiety, but these studies also showed inconsistent results. While some studies indicated that anxiety symptoms were negatively related to ACC volume, PFC volume (Spampinato et al., Reference Spampinato, Wood, De Simone and Grafman2009), amygdala volume (Blackmon et al., Reference Blackmon2011) and medial OFC thickness (Kuhn et al., Reference Kuhn, Schubert and Gallinat2011), others showed that anxiety symptoms were positively correlated with OFC and temporo-parietal cortex thickness (Blackmon et al., Reference Blackmon2011). Hence, presently, nearly no study on pathological or subclinical anxiety has replicated the findings of another and results on the gray matter characteristics of anxiety are far from conclusive.
Many factors could account for the diverging results on the gray matter characteristics related to anxiety. Most of the aforementioned results do not take into account many confounding variables including lifestyle, physical health, and psychiatric comorbidities, in particular subclinical depressive symptoms and history of previous depression. Indeed, one major difficulty in determining the specific characteristics of anxiety is its proximity with depression and subclinical depressive symptoms (Lenze et al., Reference Lenze2000; Kessler et al., Reference Kessler2003). In addition, while an individual may not be depressed at a given time, a history of previous major depressive episode (MDE) is a long-term vulnerability for recurrence (Hardeveld et al., Reference Hardeveld, Spijker, De Graaf, Nolen and Beekman2013) and this vulnerability may be associated with structural imaging particularities. Thus, anxiety may have distinct gray matter characteristics according to the presence or antecedents of depression. Moreover, aging is another factor that could have a major influence on the gray matter particularities of anxiety. Late-life anxiety has higher rates of comorbidity with MDE (Kessler et al., Reference Kessler2010) and normal aging is accompanied by heterogeneous reduction of gray matter volume including accelerated reduction for the insula and ACC and slower atrophy rate for the amygdala (Good et al., Reference Good, Johnsrude, Ashburner, Henson, Friston and Frackowiak2001; Fjell et al., Reference Fjell2013).
Anxiety disorders subtypes are likely to differ in their functional neural networks, but theoretical and empirical models indicate that these disorders share an important common factor of trait anxiety or negative affectivity (Clark et al., Reference Clark, Watson and Mineka1994; Brown et al., Reference Brown, Chorpita and Barlow1998; Hettema et al., Reference Hettema, Prescott, Myers, Neale and Kendler2005; Reference Hettema, Neale, Myers, Prescott and Kendler2006; Watson, Reference Watson2005; Rosellini and Brown, Reference Rosellini and Brown2011). In opposition to state anxiety, the currently experienced anxiety which is critically influenced by factors such as life events, trait anxiety reflects stable individual differences in anxiety proneness. Thus, common central functional networks and common patterns of gray matter characteristics related to trait anxiety are expected between most anxiety disorders as well as in subclinical anxiety (Sylvester et al., Reference Sylvester2012). In order to identify this central pattern of gray matter characteristics associated with anxiety, the present study examines the relationship between trait anxiety and structural aspects of gray matter in a large sample of older adults and verifies whether current depressive symptoms and antecedents of MDE moderate this relationship. Based on previous results, these objectives were tested for gray matter volume or cortical thickness in the following ROIs: ACC, amygdala, insula, OFC and temporal cortex.
Methods
Participants
Participants were a subsample of the Three-City Study cohort (3C Study Group, 2003), a randomly recruited sample of 9294 non-institutionalized individuals aged 65 years and older. Participants of the present study were those recruited in the Bordeaux sample at baseline who accepted to undergo a cerebral MRI. Trained psychologists and nurses collected information through face-to-face interviews. The study protocol was approved by the ethics committee of Kremlin-Bicêtre University Hospital (Paris, France) and all participants provided written informed consent.
MRI data were visually inspected to discard major acquisition artifacts and pathological brain including stroke, tumors, and arachnoïd masses (n = 31) and severe leucoaeriosis (Fazekas scale grade 3; n = 33). Participants with incident dementia in the following 7 years were excluded (n = 19). Three hundred and ninety-three participants had MRI and mental health (anxiety and depression) data available.
Following these exclusions, the participants were younger (Mean: 72.2 ± 3.8 vs. 75.0 ± 5.1, F [1, 2025] = 104.4, p < 0.001) and the proportion of women was lower (63.3% vs. 53.3%, χ2 = 13.6, df = 1, p < 0.001) in the study sample compared to participants in the whole Bordeaux sample without prevalent cases of dementia. Furthermore, although significantly different, the study sample was relatively similar to the original sample in terms of Mini-Mental State Examination (MMSE) score (27.9 ± 1.8 vs. 27.3 ± 2.0, F [1, 2007] = 33.3, p < 0.001) and trait anxiety score (38.0 ± 9.5 vs. 39.3 ± 10.2, F [1, 7835] = 4.7, p < 0.001).
Magnetic resonance imaging
Image acquisition
MRI was performed using a 1.5 Tesla Gyroscan Intera system (Philips Medical Systems, Netherlands) equipped with a quadrature head coil. Anatomical high resolution MRI volumes were acquired in transverse plan using a 3D MPRAGE T1 weighted sequence (TR/TE 8.5/3.9 ms, flip angle 10°, matrix size 256 × 256, FOV 240 mm, yielding 124 slices and slices thickness of 1 mm, voxel size 0.94 × 0.94 × 1 mm3). Head motions were minimized by use of tightly padded clamps attached to the head coil.
Gray matter volume
An optimized VBM procedure (Ashburner and Friston, Reference Ashburner and Friston2000; Good et al., Reference Good, Johnsrude, Ashburner, Henson, Friston and Frackowiak2001) implemented in the VBM8 toolbox (revision 343, http://dbm.neuro.uni-jena.de/vbm) of Statistical Parametric Mapping (SPM8; Welcome Laboratory of the Department of Cognitive Neurology, Institute of Neurology, London, UK, http://www.fil.ion.ucl.ac.uk./spm) was used to analyze brain volumes with default parameters. Briefly, images were segmented into gray, white matter and cerebrospinal fluid maps, warped to the Montreal Neurological Institute (MNI) space and modulated to preserve volume information. All segmented partitions were visually checked by an experienced operator so as to discard poor quality processes. Total intracranial volume was calculated by adding gray and white matter and cerebrospinal fluid volume after masking out the cerebellum because the acquisition for some MRI scans did not cover the whole cerebellum. Gray matter volume for each ROI was extracted using Automated Anatomical Labeling (AAL) (Tzourio-Mazoyer et al., Reference Tzourio-Mazoyer2002) and Easy volume (http://www.sbirc.ed.ac.uk/LCL/LCL_M1.html) (Pernet et al., Reference Pernet, Andersson, Paulesu and Demonet2009).
Cortical thickness
The procedure was based on Querbes et al. (Reference Querbes2009) Volumes were resampled to a 1 × 1 × 1 mm resolution and then segmented using an in-house reimplemented segmentation algorithm. Using the gray matter, white matter and cerebrospinal fluid maps, cortical thickness was computed on the whole cortical ribbon in the native space of the patient's brain, using a Laplace's equation-based algorithm (Jones et al., Reference Jones, Buchbinder and Aharon2000). To take into account partial volume effects at the white matter/gray matter and cerebrospinal fluid/gray matter interfaces, a boundary cortical thickness was derived by using a fuzzy distance method, (Bloch, Reference Bloch2005) which led to a sub-millimetric measurement of cortical thickness. By computing cortical thickness for the entire cortical ribbon, a 3D cortical thickness map was obtained, which was then registered in the standardized MNI space using nine-parameter rigid registration (ITK Software, Ixico, London) (Studholme et al., Reference Studholme, Hill and Hawkes1999). Similarly to ROIs volume procedure, AAL (Tzourio-Mazoyer et al., Reference Tzourio-Mazoyer2002) was used to extract the mean cortical thickness for each ROI.
Anxiety, depression, and covariates
Trait anxiety, relatively stable individual differences in anxiety-proneness, was assessed with the STAI Y version (Spielberger, Reference Spielberger1983) which has excellent psychometric properties (Spielberger, Reference Spielberger1983; Bergua et al., Reference Bergua2012). The CESD (Radloff, Reference Radloff1977) was used to capture subclinical and clinical level of current depressive symptoms. This scale has been shown to be an accurate and valid measure of depressive symptoms in elderly general population. History of MDE was assessed according to DSM-IV criteria using the Mini International Neuropsychiatric Interview (Sheehan et al., Reference Sheehan1998).
The standardized interview included questions on demographic characteristics, handedness, alcohol consumption, tobacco use, height and weight, dyspnea, history of angina pectoris, and myocardial infarction. Hypertension (blood pressure ≥140/90 mm Hg or treated) and diabetes mellitus (glucose level ≥130 mg/dL or treated) were assessed and the presence of apolipoprotein E ɛ4 allele (APOE4) was determined as previously described (3C Study Group, 2003). Psychotropic drugs use was coded according to the World Health Organization's Anatomical Therapeutic Chemical Classification and was assessed by interview and inspection of participants’ medicine cabinet for prescribed and over-the-counter drugs employed during the preceding month. Global cognitive functioning was measured using the MMSE (Folstein et al., Reference Folstein, Folstein and McHugh1975). Cognitive complaints were assessed by six commonly experienced difficulties resulting in a score varying from 0–6 as described elsewhere (Potvin et al., Reference Potvin2013).
Statistical analyses
Since 18 participants had one or two missing covariates (alcohol consumption n = 3; MMSE n = 1; cognitive complaint n = 1; dyspnea n = 1; diabetes n = 7; APOE4 n = 7), multiple imputation (Rubin and Schenker, Reference Rubin and Schenker1991) was performed to avoid their exclusion from statistical analyses. Ten datasets were generated with IBM SPSS Statistics Version 21 using all covariates.
In order to avoid multiple testing, only two linear mixed models were conducted (one for each dependent variable: volume and cortical thickness) including hemisphere and brain region as repeated factors with a random intercept. Anxiety, current depressive symptoms (CESD score), and history of MDE were included as predictors and the following covariates were included if p value was below 10%: age, sex, education level, handedness, total intracranial volume, MMSE score, subjective cognitive complaint, smoking, body-mass index, alcohol consumption, psychotropic drug use, APOE4, hypertension, diabetes, dyspnea, and heart disease. Z scores were used for anxiety and CESD scores. In order to test the influence of CESD score and history of MDE, as well as differences between ROIs and hemispheres, interactions were tested in the final model including covariates. Statistical analyses were performed with SAS 9.2 software using a 5% alpha level.
Results
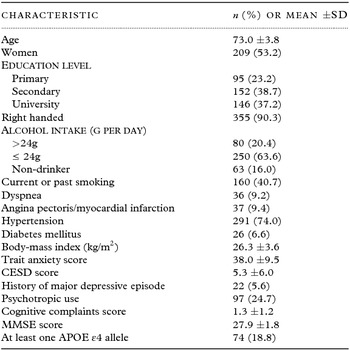
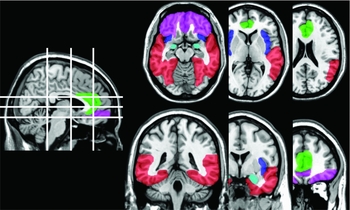
Table 1 shows the characteristics of the participants including sociodemographic, lifestyle, mental health and physical health variables. Participants had a mean trait anxiety score of 38 and 22 participants had a history of MDE. The mean CESD score was 5.3. No participants met DSM-IV criteria for MDE at the time of interview, but five had MDE within the last year. Figure 1 illustrates the ROIs as delineated using AAL templates.
Characteristics of the participants (N = 393)

CESD: Center for Epidemiological Studies–Depression Scale. MMSE: Mini-Mental State Examination.
Illustration of the regions of interest as delineated using automated anatomical labeling. Blue: insula, Cyan: amygdala, Green: anterior cingulate cortex, Pink: orbitofrontal cortex, Red: temporal cortex.

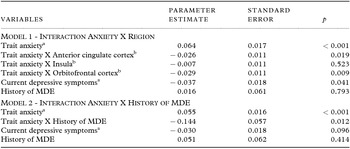
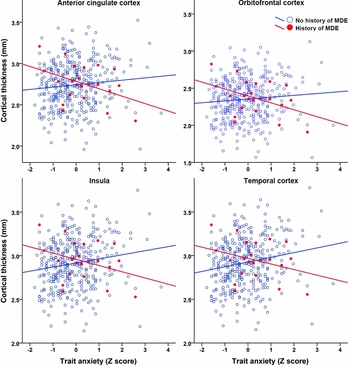
For both gray matter volume and cortical thickness, hemisphere had no significant influence. Thus, statistical analyses were conducted on bilateral volume and bilateral cortical thickness. For gray matter volume, the effect of anxiety was not significant (Table 2; covariates coefficients are presented in Table S1, available as supplementary material attached to the electronic version of this paper at www.journals.cambridge.org/jid_IPG) and it was not influenced by ROI, current depressive symptoms, history of MDE, or a combination of these factors (ps > 0.05). For cortical thickness, anxiety had a significant positive effect (higher anxiety was associated with a larger cortical thickness) and it was significantly moderated by ROI (F 31173 = 3.28; p = 0.020) and by history of MDE (F 1378 = 6.30; p = 0.012), but not by current depressive symptoms. The influence of history of MDE did not significantly differ between ROI. Table 3 shows the coefficients of interest of each model including each significant interaction (covariates coefficients are presented in Table S2 and S3, available as supplementary material attached to the electronic version of this paper at www.journals.cambridge.org/jid_IPG). The first model with the ROI interaction indicates that the positive effect of anxiety on cortical thickness was less pronounced in the ACC and OFC than in the temporal cortex. The second model with the history of MDE interaction revealed that the effect of anxiety on cortical thickness was negative (higher anxiety was associated with a smaller cortical thickness) in participants with history of depression. Figure 2 illustrates the results on cortical thickness in each ROI.
Coefficients from a linear mixed model predicting ROI volume

a Coefficients correspond to a 1 SD increase.
Significant covariates also included in the model are age, alcohol consumption, hypertension, dyspnea, diabetes, APOE4, and intracranial volume. MDE: Major depressive episode.
Coefficients from linear mixed models predicting ROI cortical thickness

a Coefficients correspond to a 1 SD increase.
b Trait anxiety X Temporal cortex is the reference category.
Significant covariates also included in the model are age, education level, alcohol consumption, body-mass index, dyspnea, diabetes, APOE4, and intracranial volume. MDE: Major depressive episode.
Trait anxiety and cortical thickness according to regions of interest and history of major depressive episode (MDE). Cortical thickness values originate from a linear mixed model adjusted for covariates.

In order to verify whether the moderation effect of history of MDE could be explained by different characteristics between participants with and without history of MDE, we tested the differences of covariates between groups. Table S4, available as supplementary material attached to the electronic version of this paper at www.journals.cambridge.org/jid_IPG, shows that participants with history of MDE were younger, were more likely to be women and to use psychotropic, and had higher CESD scores than participants without history of MDE. Adding any interaction term of these factors with anxiety in the model predicting cortical thickness did not alter the significant interaction anxiety X history of MDE. Moreover, using antidepressants instead of a category including all psychotropics did not alter the moderation effect. In addition, since the covariates associated with ROI volume and ROI cortical thickness slightly differed, we also tested models including all covariates and this procedure did not modify the results: no significant effect of anxiety for ROI volume and the same significant effects for cortical thickness. We also compared the results with and without the multiple imputation procedure for covariates and both procedures yielded the same significant effects (Table S5, available as supplementary material attached to the electronic version of this paper at www.journals.cambridge.org/jid_IPG).
Finally, we verified whether the effect of anxiety and its interaction with history of MDE involved the whole cortex rather than only the selected ROIs by testing these effects on the mean cortical thickness of the whole brain. The results show that the effects of interaction anxiety X history of MDE and anxiety alone were significant, but both effects had a smaller magnitude (interaction B = −0.111; p = 0.042; anxiety B = 0.047; p = 0.002) compared to that of the ROIs analysis.
Discussion
The objective of the present study was to examine in a community sample of older adults whether gray matter in the ACC, amygdala, insula, OFC, and temporal cortex was associated with trait anxiety. The results revealed that trait anxiety was associated with increased cortical thickness in bilateral ROIs, but that this effect was more pronounced in the temporal cortex than in the ACC or OFC. Furthermore, the results indicated that for all ROIs, trait anxiety was associated with increased cortical thickness in participants without past history of MDE, but with decreased cortical thickness in participants with a history of MDE. These findings suggest that in the general population, trait anxiety is associated with an increased cortical thickness in multiple cortical areas and that this relationship is modified in presence of antecedents of depression. The present findings represent one more step in understanding the neurobiology of anxiety. Furthermore, it is likely that additional factors also moderate the relationship between anxiety and brain morphology. Nevertheless, the moderating effect of history of MDE on the gray matter characteristics associated with anxiety could account for some of the results discrepancies reported between previous studies.
Unlike cortical thickness, no significant association was observed between anxiety and ROI volumes. While we did not aim to compare two techniques examining structural gray matter, our results pointed out notable differences. Because cortical volume not only measures thickness but also cortical surface, Hutton et al. recommended using both techniques in order to identify the underlying gray matter changes (Hutton et al., Reference Hutton, Draganski, Ashburner and Weiskopf2009). Previous results also suggested that cortical thickness and cortical surface are genetically independent (Winkler et al., Reference Winkler2010). Since the specific microscopic correlates of cortical thickness and volume are unknown because there are affected by multiple factors, we cannot point out a particular microscopic aspect of the cortex. However, previous results indicated that cortical thickness in older adults was not related to the number of neurons, suggesting that dendrites and axons might be more related to this process (Freeman et al., Reference Freeman2008). Nevertheless, our results strengthen the recommendation of using both parameters for structural imaging in psychiatry.
Moreover, no significant association was observed between anxiety and the volume of the only subcortical ROIs, the amygdala. Many studies have found a relationship between amygdala volumes and anxiety in young adults. However, this relationship appears to differ according to the type of anxiety: compared to controls, smaller amygdala volumes were observed in individuals with panic disorder (Uchida et al., Reference Uchida2003; Massana et al., Reference Massana2003b; Asami et al., Reference Asami2009; Hayano et al., Reference Hayano2009) or higher trait anxiety (Blackmon et al., Reference Blackmon2011), and larger amygdala volumes were found in individuals with GAD (Schienle et al., Reference Schienle, Ebner and Schafer2011) while no difference was observed for social anxiety disorder (Syal et al., Reference Syal2012). Further studies in older adults are needed to verify if this is an actual difference between young and older adults or other factors such as the type or severity of anxiety may explain this discrepancy.
Anxiety without antecedents of depression
The present results show straightforward findings in participants without prior history of depression: higher trait anxiety was associated with a larger cortical thickness in all cortical ROIs. Two previous studies have assessed the association between dimensional anxiety scale and cortical thickness in controls and despite their similar procedures with exclusion of individuals with antecedents of depression, these studies obtained conflicting results (Blackmon et al., Reference Blackmon2011; Kuhn et al., Reference Kuhn, Schubert and Gallinat2011). One reported a negative correlation between trait anxiety and right OFC cortical thickness (Kuhn et al., Reference Kuhn, Schubert and Gallinat2011) whereas the other found positive correlations between anxiety scores and cortical thickness for small portions of the left OFC (Beck anxiety inventory; BAI) and the left temporo-parietal cortex (BAI and trait anxiety) (Blackmon et al., Reference Blackmon2011). These two studies excluded pathological depressive symptomatology at the time of interview, but did not take into account subclinical depressive symptoms. Our results partially agree with those of the second study which showed a positive correlation with cortical thickness. However, unlike the present results, this effect was restricted to the left OFC, but it should be noted that the small sample used in this second study might have limited to detect positive associations with other cortical areas.
Few previous studies have examined the relationship between cortical thickness and anxiety and most of these studies assessed pathological anxiety, rather than trait anxiety (Rauch et al., Reference Rauch2004; Syal et al., Reference Syal2012; Frick et al., Reference Frick, Howner, Fischer, Eskildsen, Kristiansson and Furmark2013). One of these study reported findings similar to ours by showing increased cortical thickness in several areas including bilateral ACC, insula, temporal cortex, and parietal cortex in individuals with specific phobia (Rauch et al., Reference Rauch2004). Whether thicker cortical areas is the consequence of anxiety or that anxiety is the result of thicker cortical areas is unknown. The finding that higher trait anxiety was related to larger cortical thickness in all cortical ROIs suggests a relatively broad effect rather than an effect restricted to a particular neural circuit. Further results indicated a significant effect for the mean thickness of the whole cortex, but this effect appeared to be somewhat of a lower magnitude, suggesting that the association between cortical thickness and anxiety is not homogenous throughout the brain and that key regions like the temporal cortex and the insula might have a stronger association with anxiety. Moreover, both environmental and genetic factors might account for this effect since cortical thickness is known to be influenced by both factors (Winkler et al., Reference Winkler2010). While specific genes remain to be identified for this association, a parsimonious hypothesis for environmental factors is that individuals with a higher trait anxiety in absence of mood disorders could show a particular lifestyle. For example, in these individuals, anxiety could favor behaviors oriented toward good health practices such as a good diet. High anxiety is generally not linked to that type of behavior, but since the participants originated from a population-based sample, the level of trait anxiety was not very high and the effects observed in our study may not be generalizable to individuals with very high trait anxiety, such as in pathological anxiety. Longitudinal studies with long term follow-up taking into account lifestyle aspects and personality trait like conscientiousness, which is related to good health-related behaviors (Bogg and Roberts, Reference Bogg and Roberts2004), will be needed to verify this hypothesis.
Anxiety with antecedents of depression
The present results suggest that anxiety has a different neurobiological signature whether it is encountered in presence or absence of past history of MDE. One possibility is that trait anxiety could reflect a vulnerability to stress and in individuals with this vulnerability, those who experienced depression have thinner cortical areas compare to those who did not develop depression. In these individuals, this cortical difference could reflect either symptoms of a depression or a vulnerability to develop depression. This finding also raises nosological issues and is in agreement with the view that comorbid anxiety and depression could be a distinct entity from “pure” anxiety and depression (Andreescu et al., Reference Andreescu, Wu, Butters, Figurski, Reynolds and Aizenstein2011; Andreescu and Lenze, Reference Andreescu and Lenze2012). This view is supported by data showing that anxious depression has poorer outcomes (Dew et al., Reference Dew1997; Flint and Rifat, Reference Flint and Rifat1997; Lenze et al., Reference Lenze2000; Alexopoulos et al., Reference Alexopoulos2005; Andreescu et al., Reference Andreescu2007; Fava et al., Reference Fava2008; Greenlee et al., Reference Greenlee, Karp, Dew, Houck, Andreescu and Reynolds2010) and distinct clinical (VanValkenburg et al., Reference VanValkenburg, Akiskal, Puzantian and Rosenthal1984; Fava et al., Reference Fava2004) and neurobiological (Andreescu et al., Reference Andreescu2009; Inkster et al., Reference Inkster2011; Ionescu et al., Reference Ionescu, Niciu, Mathews, Richards and Zarate2013) characteristics than depression without anxiety. While findings on the characteristics of anxiety in presence and absence of depression is relatively limited compared to findings on depression in presence and absence of anxiety, previous results suggested that risks factors for comorbid anxiety disorders and major depressive disorder (MDD) and anxiety disorders alone differ (Beekman et al., Reference Beekman, de Beurs, van Balkom, Deeg, van Dyck and van Tilburg2000). Comorbid anxiety disorders and MDD appeared more related to long-term vulnerability factors such as family history compared to pure anxiety disorders.
A structural imaging study showed that anxiety disorders, MDD, and comorbid anxiety disorders with MDD had many common gray matter characteristics, but few particularities (van Tol et al., Reference van Tol2010). The only specific characteristic of anxiety disorders reported was a reduction of a small portion of the right temporal pole volume compared to healthy individuals and this result was not observed in participants with comorbid anxiety disorders and MDD. This reduction of gray matter volume considerably differs from the increased cortical thickness in participants without MDE antecedents observed in the present study. However, in this study (van Tol et al., Reference van Tol2010), more than half of individuals with anxiety disorders without MDD at the time of interview had a previous history of MDD and the moderating effect of history of depression was not tested.
Strengths and limits
The present study is the first to examine gray matter characteristics associated with trait anxiety using a large community sample. One limit of clinical sample studies is that even when patients are matched to control participants on sociodemographic characteristics, these groups are likely to differ on many characteristics not assessed such as lifestyle and physical health conditions. In a random sample, groups are made after recruitment and variability in characteristics that are not measured are assumed to be equally distributed between groups. The findings need to be interpreted in light of some limitations. First, the level of current depressive symptoms was relatively low compared to a clinical sample of depressed individuals. Thus, it is possible that more severe current depressive symptoms also moderate the relationship between trait anxiety and cortical thickness. Second, the present findings relate to trait anxiety, a measure of anxiety-proneness. Although trait anxiety is a central component of anxiety disorders, further studies comparing the present findings with those from individuals with various anxiety disorders are needed to confirm whether pathological anxiety subtypes have a common pattern of gray matter characteristics and to determine the specific set of gray matter characteristics related to each subtype. Third, since the number of participants with past MDE was relatively small, the interaction between anxiety and past depression should be interpreted with caution and should be replicated in a different sample of older adults.
In conclusion, our results indicated that depending on the antecedents of depression, trait anxiety can be associated with thicker or thinner cortex in bilateral ACC, insula, OFC, and temporal cortex. This finding needs to be replicated. The negative effect of trait anxiety on cortical thickness could be part of a specific type of depression or represent a vulnerability to develop MDE. The present results also raise questions about whether specific treatment strategies should be used in individuals with anxiety according to their biological characteristics such as cortical thickness. Treatment studies assessing the morphometry of cerebral structures in anxious individuals with or without antecedents of depression could be a starting point for this field of research.
Conflict of interest declaration
None.
Description of authors’ roles
Potvin analyzed the data and wrote the manuscript. Study concept and design: Potvin, Bergua, Meillon, and Amieva. Acquisition and processing of data: Dartigues, Celsis, Catheline, Bernard, Allard, and Chauveau. Analysis and interpretation of data: Potvin, Catheline, Bernard, Bergua, Meillon, and Amieva. Critical revision of the manuscript for important intellectual content: Dartigues, Celsis, Catheline, Bernard, Allard, and Chauveau. Statistical analysis: Potvin and Meillon.
Acknowledgments
The 3C Study is conducted under a partnership agreement between the Institut National de la Santé et de la Recherche Médicale (INSERM), the Institut de Santé Publique et Développement of the Victor Segalen–Bordeaux 2 University, and Sanofi-Aventis. The 3C Study is also supported by the Caisse Nationale Maladie des Travailleurs Salariés, Direction Générale de la Santé, Mutuelle Générale de l'Education Nationale, Institut de la Longévité, Agence Française de Sécurité Sanitaire des Produits de Santé, the Regional Governments of Aquitaine, Bourgogne and Languedoc-Roussillon, Fondation de France, and the Ministry of Research-Inserm Programme “Cohorts and collection of biological material.” The Lille Génopôle received an unconditional grant from Eisai. The Fondation pour la Recherche Médicale funded the preparation and first phase of the study. Dr Potvin was supported by a Fellowship award from the Canadian Institutes of Health Research.
Supplementary material
To view supplementary material for this article, please visit http://dx.doi.org/10.1017/S1041610215000836.