


Introduction
The subsurface of rocks that are translucent and porous provide a habitat for microbial life in a variety of environments including both hot and cold deserts (Friedmann Reference Friedmann1982, Matthes et al. Reference Matthes, Turner and Larson2001, Cockell et al. Reference Cockell, Lee, Osinski, Horneck and Broady2002, Büdel et al. Reference Büdel, Weber, Kühl, Pfanz, Sültemeyer and Wessels2004). Phototrophic organisms live just below the surface and use sunlight that penetrates the rock. In this respect the endolithic habitat is analogous to the hypolithic habitat. In the latter the organisms live beneath non-porous translucent rocks. A similar system is represented by aquatic sediments in which phototrophs live below the surface of the sand. A key question in all three of these habitats is the quantity and quality of the light that penetrates the mineral phase.
There has been considerable study of the transmission of light in the photosynthetically active region (PAR, 700–400 nm) in endoliths (Nienow et al. Reference Nienow, McKay and Friedmann1988, Matthes et al. Reference Matthes, Turner and Larson2001, Hughes & Lawley Reference Hughes and Lawley2003, Horath et al. Reference Horath, Neu and Bachofen2006, Herrera et al. Reference Herrera, Cockell, Self, Blaxter, Reitner, Thorsteinsson, Arp, Dröse and Tindle2009), hypoliths (Berner & Evenari Reference Berner and Evenari1978, Cockell et al. Reference Cockell, Lee, Osinski, Horneck and Broady2002) and aquatic sediments (Haardt & Nielsen Reference Haardt and Nielsen1980, Jørgensen & DesMarais Reference Jørgensen and DesMarais1986, Kühl & Jørgensen Reference Kühl and Jørgensen1992, Reference Kühl and Jørgensen1994, Kühl et al. Reference Kühl, Lassen and Jørgensen1994, Reference Kühl, Lassen and Revsbech1997, Ichimi et al. Reference Ichimi, Tada and Montani2008). In all of these habitats photosynthetic organisms live below a layer of translucent mineral, be it soft sand sediments or hard rock. For a review of these cryptic habitats see Cockell et al. (Reference Cockell, Kaltenegger and Raven2009). A question common in all of these habitats is the quantity of light that penetrates the overlying mineral layer and the relative spectral absorption across the solar spectrum. Because many of these diverse habitats have quartz mineralogy with iron pigments present, it would not be surprising to find common properties in terms of light transmission.
The majority of light attenuation studies have focused on the characterization of the light penetration through rocks and minerals in the PAR (e.g. Berner & Evenari Reference Berner and Evenari1978, Nienow et al. Reference Nienow, McKay and Friedmann1988, Matthes et al. Reference Matthes, Turner and Larson2001, Cockell et al. Reference Cockell, Lee, Osinski, Horneck and Broady2002, Hughes & Lawley Reference Hughes and Lawley2003, Herrera et al. Reference Herrera, Cockell, Self, Blaxter, Reitner, Thorsteinsson, Arp, Dröse and Tindle2009). Some studies have considered the importance of UV screening by sand and mineral layers. The first study along these lines was by Sagan & Pollack (Reference Sagan and Pollack1974) who considered the differential absorption of UV on Mars compared to PAR. They concluded that a euphotic zone could exist ∼ 1 cm below the surface of sands on Mars where visible light is still intense enough for photosynthesis but the germicidal ultraviolet (down to 190 nm) would be absorbed. Hughes & Lawley (Reference Hughes and Lawley2003) considered the UV (down to 300 nm) protection provided by gypsum crusts in the maritime Antarctic. Phoenix et al. (Reference Phoenix, Konhauser, Adams and Bottrell2001) considered UV (254 nm) shielding capacity of iron-bearing silicate biominerals and found that they were effective shields and suggested they could have been important for life in the time before the development of free oxygen in the atmosphere. Phoenix et al. (Reference Phoenix, Bennet, Engel, Tyler and Ferris2006) extended this work with additional field and laboratory measurements of UV-A (320–400 nm) and UV-B (280–320 nm) and concluded that the UV was effectively removed compared to the PAR with shorter UV wavelengths more strongly absorbed. Cockell et al. (Reference Cockell, McKay, Warren-Rhodes and Horneck2008) conducted exposure experiments in the Atacama Desert and showed that UV radiation was an important biocidal factor on rock surfaces and that mineral layers provided effective UV shielding for endoliths. Herrera et al. (Reference Herrera, Cockell, Self, Blaxter, Reitner, Thorsteinsson, Arp, Dröse and Tindle2009) considered endoliths within silica-rich rhyolitic glass (obsidian) and also found effective screening of UV while PAR levels remained adequate for photosynthesis.
In this study we report measurements over a much broader range of wavelengths (2300–190 nm) than any previously considered. There are several reasons why it may be useful to characterize endolithic environments over the entire solar spectrum. Recently a new form of chlorophyll has been discovered with absorption features that are red-shifted compared to all other chlorophylls - its in vitro absorption and fluorescence maxima are 706 nm and 722 nm respectively (Chen et al. Reference Chen, Schliep, Willows, Cai, Neilan and Scheer2010). Furthermore, recent speculations have suggested the infrared light from hot deep sea vents might provide for photosynthesis (Van Dover et al. Reference Van Dover, Reynolds, Chave and Tyson1996, Beatty et al. Reference Beatty, Overmann, Lince, Manske, Lang, Blankenship, van Dover, Martinson and Plumley2005).
Measurement for high absorption is necessary as low light levels may be important for phototrophic growth. Littler et al. (Reference Littler, Littler, Blair and Norris1986) reported on growth of red macro-algae on deep seamounts at light levels of < 0.01 μmol m-2 s-1. Raven et al. (Reference Raven, Kübler and Beardall2000) have reviewed the minimum light levels for photosynthesis and also concluded that ∼ 0.01 μmol m-2 s-1 is needed. This corresponds to an absorption, with respect to typical full summer noon sunlight in the Antarctic (∼ 1000 μmol m-2 s-1), of 5.
Deeper UV radiation is also of interest to astrobiology. On other worlds, in particular Mars, the lack of O2 and O3 in the atmosphere would allow for UV down to 190 nm to reach the surface. This may also have been the case on the early Earth (e.g. Phoenix et al. Reference Phoenix, Bennet, Engel, Tyler and Ferris2006).
The penetration of solar infrared is of interest as photosynthetic capabilities at longer and longer wavelengths are considered. In addition, the far infrared is important to energy balance studies and the depth of deposition may effect thermal fluctuations in the endolithic habitat (McKay & Friedmann Reference McKay and Friedmann1985). Also, because of the strong water bands at 2000 nm and 1600 nm monitoring the solar infrared may be a method for monitoring water inside porous rocks.
Methods
A typical specimen of Beacon Sandstone (Fig. 1) was collected from Linnaeus Terrace (Asgard Range; 77°36′S, 161°05′E, elevation 1600–1650 m). The sample was ∼ 1.5 cm thick and a 1 cm diameter hole was drilled from the bottom to a depth of 2.27 ± 0.3 mm below the surface - a depth that corresponds to the middle of the colonized zone (Nienow et al. Reference Nienow, McKay and Friedmann1988, table 2). The relatively large uncertainty in the thickness is due to the unevenness of the surface and of the hole.
Image of Beacon Sandstone sample used in this study, from Linnaeus Terrace, Upper Wright Valley, Antarctica. Background grid is 0.5 cm squares.

As shown below, the absorption (a, defined such that the transmissivity = 10-a) of the sample is too high, up to 6 and above, to allow direct measurements with normal laboratory spectrometers. To accommodate these high absorptions the reference beam of the spectrometer was attenuated by 1% neutral density filters constructed out of metal screen, similar to the method of Nienow et al. (Reference Nienow, McKay and Friedmann1988). The absorption of the filters was directly tested and found to differ from 2.0 by less than 0.1 over the entire wavelength range considered. By use of the filters, the ratio of the transmissivity through the sample with respect to the reference beam was thus kept within the range of 0.0–2.0. While this allowed high absolute absorptions to be measured directly there was an inevitable increase in noise.
A Perkin-Elmer Model 552 Spectrometer with digital and graphical output was used in the wavelength range of 750–190 nm. This instrument is capable of measuring relative absorptions from -0.5 to 3.0. A tungsten-bromide lamp was used for wavelengths greater than 315 nm and deuterium lamp for shorter wavelengths. The slit was set at 4 nm and the wavelength range was scanned at 1 nm sec-1. Graphical output was recorded in the absorption range of 1.5–2.5 using a single filter, thus corresponding to an absolute absorption of 3.5–4.5. At this point a second filter was introduced into the reference beam allowing absolute absorptions from 4.5–6.0 to be measured. Values of absolute absorption larger than 6.4 could not be satisfactorily measured due to signal to noise problems.
A Cary Model 14 Recording Spectrometer was used in the wavelength range of 2400–600 nm. The Cary was also used to obtain data in the 600–300 nm for comparison to the Perkin-Elmer results. The slit width was under automatic control and the scan speed was 5 nm sec-1. It was only necessary to use one filter in the reference beam to obtain results over the range of 2400–600 nm.
Spectra were obtained with the dry rock in the sample beam. The rock was then wetted to field capacity with distilled water, without moving the rock from the sample beam. Spectra were then obtained with the wetted rock. The rock was then removed and weighted to determine the percent water.
Results
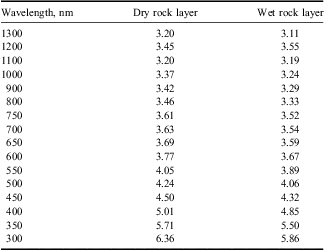
The absorption spectra of the dry rock obtained in the visible wavelength range is shown in Fig. 2 based on the graphical output of the Perkin-Elmer 552. The discontinuity in the spectrum at 450 nm is due to the change from a single filter to a double filter. The size of the discontinuity, 0.1, is indicative of the error introduced by the filters. The absorption increases markedly with wavelength dropping over two and a half decades in the photosynthetically active region (PAR). Below 350nm the absorption is too large to register on the graphical output. The spectra in the near infrared region, 2400–600nm, is shown in Fig. 3. The tracings of the graphical output of the Cary Spectrometer for both dry and wet rocks are shown. The ratio of wet to dry absorption was obtained in the visible by use of the digital output display of the model 552. The values for both the dry and wet absorption are listed as a function of wavelength in Table I from the digital output and the difference in absorption is plotted in Fig. 4.
Absorption (a, defined such that the transmissivity = 10-a) of the rock as function of wavelength. Based on the graphical output of a Perkin-Elmer model 552 spectrometer. The discontinuity in the spectrum at 450 nm is due to the change from a single compensating filter to a double compensating filter placed in the reference beam to allow for measurement of high values of absorption. The size of the discontinuity is indicative of the error introduced by the compensating filters.

Absorption in the infrared region, 2400–600 nm, from the graphical output of the Cary 14 Spectrometer for both dry and wet samples. Absorption features of water are visible at 2000 nm and 1600 nm. Outside these regions the absorption is reduced when the sample is wet.

Difference in absorption between the dry and wet samples as a function of wavelength from 700–300 nm. There is a sharp increase in the enhancement of the transparency due to water for wavelengths less than 350 nm.

Absorption in sandstone surface layer.
The spectra in the near infrared region, 2400–600 nm, is shown in Fig. 3. The tracings of the graphical output of the Cary Spectrometer for both dry and wet rocks are shown.
The mass of the rock sample was 160.94 g when dry and 166.12 g when saturated with water (field capacity). This corresponds to a 3.2% increase in mass. This level of water corresponds to the porosity of ∼ 10% (Nienow et al. Reference Nienow, McKay and Friedmann1988).
Discussion
Using the measured thickness of 2.27 mm we can compute values of the extinction coefficient, k, that range from 3.7 mm-1 at 700 nm to 5.1 at 400 nm. These values are larger than the PAR averaged values reported by Nienow et al. (Reference Nienow, McKay and Friedmann1988) of 1–3 mm-1. The reason for this difference is that the k value reported by Nienow et al. (Reference Nienow, McKay and Friedmann1988) is based on total PAR measured in the rock with a fibre optic probe. The probe is inserted into the rock and effectively measures the total downwelling radiation which consists of the attenuated direct beam plus the downwelling diffuse radiation. In the measurements reported here, the long straight path and the distance between the sample and the detector results in the measurement only of the attenuated direct beam. The ratio between the extinction of the direct beam, k, and the effective extinction coefficient of the total downwelling ratio, k eff, is given by (e.g. McKay et al. Reference McKay, Clow, Andersen and Wharton1994)

Where w is the single scattering albedo and g is the asymmetry factor for the scattered radiation. The single scattering albedo is the ratio of scattering to total extinction for a particle or volume element. For a purely scattering material, w = 1, and for a purely absorbing material w = 0. For clean quartz this would be quite high, 0.9 or above. For a quartz particle with iron coating as typical for the Beacon Sandstone w would be less, ∼0.6. The asymmetry factor refers to the fraction of the scattered radiation that is scattered in the forward direction. For g = -1 the scattering is backscattering, for g = 1 the scattering is forward scattering and g = 0 refers to isotropic scattering. Particles much larger than the wavelength of light preferentially scatter in the forward direction, g > 0.
For typical values of w = 0.6 and g = 0.6, the ratio of k eff/k is 0.53, which gives values for k eff from our data of 2–2.7 for 700 and 400 nm respectively, consistent with the results of Nienow et al. (Reference Nienow, McKay and Friedmann1988).
Nienow et al. (Reference Nienow, McKay and Friedmann1988) reported spectral absorption for 400–700 nm. Over this range they observed a difference in absorption of slightly more than 1. For our results this difference is 1.3, indicating a stronger reddening of the transmission possibly due to higher iron content. It is important to note that there is significant point-to-point variation in the optical properties of the Beacon Sandstone and an exact comparison between the Nienow et al. (Reference Nienow, McKay and Friedmann1988) results and the results presented here is not possible.
The spectrum of light several millimetres below the surface in the microbial zone is markedly different from the spectrum of light incident on the surface of rock. This was noted by Nienow et al. (Reference Nienow, McKay and Friedmann1988) and here we have extended this conclusion across the entire solar spectrum. Red wavelengths penetrate deeper and are thus brighter at a given depth than blue light. This certainly has important implications for the use of different pigments and the distribution of different phototrophic organisms with depth into the rock.
In most of the wavelength range considered here water does not have significant absorption and its effect on the optical properties results from the reduction in contrast in the index of refraction between the sand grains and the inter-grain spaces when these spaces are filled with water compared with air. Kühl & Jørgensen (Reference Kühl and Jørgensen1994) discuss this effect in detail. They show that water reduces the effective optical diameter of the grains and increases the forward scattering.
In the wavelength interval between 2400 and 1300 nm the presence of water has contrasting effects. Here the strong absorption bands of water causes a decrease in transmission in pronounced spectral features. However, it is interesting to note that at 1600 nm the effects of water on the transmissivity cancel but in the strong 2000 nm absorption band the presence of water produces a net reduction in transmissivity. The relative transparency of the rock at these wavelengths to incident solar radiation is a possible method of detecting water in the rock.
The strong absorption of UV light by the sandstone suggest that this habitat for life would be well protected when atmospheric absorption of UV is minimal, for example the present day Mars, or the early Earth before the rise of atmospheric oxygen.
The relative transmissivity of the sandstone in the infrared would suggest that this habitat would favour phototrophs with pigmentation that absorbs at long wavelengths. The deeper into the rock the more the enhancement of the infrared relative to the bluer wavelengths. Thus one might expect a zonation of photosynthetic organisms in the rock with layers deeper into the rock using pigments that absorb at longer wavelengths. However, the full biological implications of the spectral shift with depth will have to await a study of the biological structure of the layering in a diverse set of endolithic rocks.
Conclusions
We have measured the spectral transmissivity over the wavelength range from 2400–300 nm for the upper few millimetre layer of Beacon Sandstone corresponding to the approximate depth of colonization. Our results are broadly consistent with those previously reported by Nienow et al. (Reference Nienow, McKay and Friedmann1988) for the spectral region from 700–400 nm.
From our results and analysis we find that, consistent with the findings of previous work in the PAR, there is a strong differential absorption of sunlight into the sandstone with attenuation in the UV and blue being orders of magnitude larger than in the red and near infrared.
When water fills the pore spaces of the sandstone the optical properties are altered generally allowing increased transmissivity. As discussed by Nienow et al. (Reference Nienow, McKay and Friedmann1988) this is due to reduced scattering associated with the reduction in optical contrast between the scattering particles and the pore spaces.
In the infrared the difference between the wet rock and the dry rock is complicated by the presence of strong water absorption bands at 2000 and 1600 nm. In the absorption band the presence of water greatly reduces the transmissivity while outside the water absorption bands the presence of water increases the transmissivity. Monitoring the transmission at two wavelengths in the infrared (e.g. 2000 and 1800 nm) could provide a means of detecting the presence of water in the pore space of the sandstone.
Acknowledgements
Field support was provided by the US Antarctic Research Program. Laboratory work and analysis was supported by the NASA Astrobiology program. I thank two high school students, Lisa Lockyer and Terence Lung, for assistance with the measurements and analysis. I thank the two reviewers for their constructive comments. This paper is dedicated to the memory of Imre Friedmann, who recruited me to the study of endoliths and hypoliths.



