Introduction
The market for child care is subject to a large range of regulations that aim to guarantee high-quality, affordable and accessible child care for all. There are several rationales for government intervention in the child care market. One rationale arises due to the information asymmetry on quality between consumers and child care providers. Parents cannot fully assess the quality of care given to their children. Mocan (Reference Mocan2001), for instance, finds that parents tend to overrate quality compared to professional observers. As a consequence, child care providers may exploit the information asymmetry by shirking on quality in order to increase profits (Mocan, Reference Mocan2001; Morris and Helburn, Reference Morris and Helburn2000). Another rationale for government intervention is the externality created in the labour market, as the availability of child care may serve to enhance women's participation in the labour market and consequently increase the tax base.Footnote 1 Finally, distributional concerns often play a role in child care. The government may, for instance, want to guarantee a minimum provision of child care and affordable services for all.
Due to these public concerns, many governments have been hesitant to allow private for-profit (FP) provision of child care and have instead opted for public provision in an attempt to guarantee the highest possible level of control over quality, affordability and accessibility. In Denmark, France and Sweden, for instance, provision of child care is the exclusive domain of public organisations. Germany, Italy and Spain allow instead for private not-for-profit (NFP) provision of child care next to public provision. Since public provision may suffer from inefficiencies, another option is to leave the provision of child care to private child care centres and to guarantee quality and accessibility through generic regulations, in the form of minimum quality standards and target-group subsidies. This is the option chosen by most Anglo-Saxon countries, which allow private FP child care centres to operate next to public and NFP centres.
The Dutch market for child care stands out as one of the few countries without public provision of child care. Only private FP and NFP providers operate and compete in this market. In 2004, about 60 per cent of the 1,300 Dutch child care organisations had a FP status and 40 per cent a NFP one (van der Kemp and Kloosterman, Reference Van Der Kemp and Kloosterman2005). Most of the largest organisations – with more than ten centres – were NFP organisations. Traditionally, many local municipalities had favourable financial treatment for NFP child care organisations, as NFP providers were often chosen as contractors for child care places supplied by the municipality.
In January 2005, the Dutch government introduced the Child Care Act, which marked the end of the supply-financing of child care provision by local municipalities. The regulatory reform replaced the former financing system which had elements of both demand- and supply-financing by a market-driven system, in which parents directly pay fees to the child care provider of their choice. In the previous system, local municipalities used to purchase a fraction of child care places from child care providers and allocate them to parents based on social considerations. In contrast, under the new regime, all parents directly purchase their child care place from the child care provider, receiving government compensation through the tax system. This new financing system has had two main consequences. Firstly, municipalities have lost some of their control over the local provision of child care. Instead, the interplay of market forces now shapes the balance between the supply by child care providers and the demand from parents. Secondly, the 2005 Child Care Act levelled the playing field between FP and NFP providers. With the end of the supply-financing by local municipalities, both FP and NFP providers have to compete on equal terms to sell child care places to parents.
The objective of this article is to compare the factors affecting the local provision of child care centres in the Netherlands before and after the introduction of the Child Care Act and to study the implications of the new financing structure for the pattern of child care provision by for-profit and not-for-profit child care centres. In the remainder of this study, we look only at the provision by professional day care centres, and not at the provision in the form of informal day care or home-run day care.
The child care market in the Netherlands
The Dutch child care system: between the Swedish and the US solution
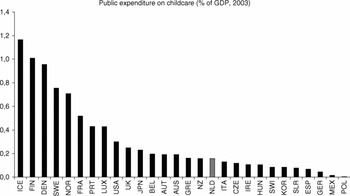
Welfare states vary widely in the way they provide support for family and early childhood services. Scandinavian countries (Denmark, Norway, Sweden and Finland) generally offer generous policy packages with public child care, extensive family leave policies and universal early childhood services. At the other extreme, public policy support for employed parents in liberal countries (USA and UK) is minimal. Paid family leave is often offered on a voluntary basis by employers, and child care services are left to the market. The Netherlands is generally classified in the group of corporatist/conservative European countries with an intermediate position (Esping-Andersen, Reference Esping-Andersen1990).Footnote 2 In these countries, support has been traditionally organised by family or religious institutions, and state intervention is generally limited to low occupational groups. Dobbelsteen et al. (Reference Dobbelsteen, Gustafsson and Wetzels2000: 3) qualify the Dutch system of child care provision as being ‘between the Swedish government solution and the US market solution’. In contrast to Sweden, Dutch child care is organised by private entrepreneurs, and day care personnel are privately employed. Yet costs of child care traditionally have been shared by the three interested parties: parents, employers and the government. In 2004, for instance, 64 per cent of child places were financed by firms, 24 per cent by parents and 12 per cent by local government. Today, parents' employers still pay a mandatory contribution to child care costs. Overall, parents generally pay about 25–30 per cent of total child care costs, against about 15 per cent in Scandinavian countries and up to full costs in the United States (OECD, 2006). Compared to many other countries, public expenditure on child care in the Netherlands is relatively low. In 2003, the Netherlands spent 0.2 per cent of GDP on child care (0–2 years) compared to 1 per cent of GDP for Finland and Denmark and 1.2 per cent for Iceland (see Figure 1). The level of Dutch total expenditures on pre-primary education (0–6 years) increased slightly over the years from 0.34 per cent of GDP in 1997 to 0.38 per cent of GDP in 2006 (OECD, 2006).
Public expenditures on child care (0–2 years), as % of GDP.
Source: OECD, Social Expenditure database, 2008 (www.oecd.org).

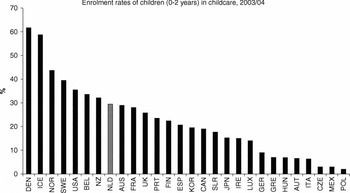
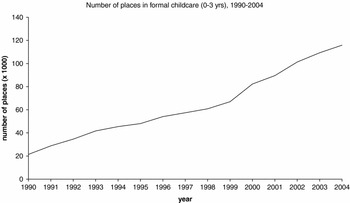
The use of formal child care in the Netherlands has long lagged behind the use of formal child care in other countries. This was mainly due to the low participation rate of women in the labour market, a traditional preference for informal day care, and taxation laws favouring single-earner households. Yet in the last few decades, enrolment in formal day care has increased considerably. While in 1990 only 2 per cent of children aged 0–13 used formal day care arrangements, this figure in creased to 12 per cent in 2004. Today, the use of formal child care in the Netherlands in the age group 0–2 years is, at approximately 30 per cent, slightly above the OECD average of 23 per cent. The highest levels of enrolment of children aged 0–2 are seen in the Nordic countries (Denmark, Iceland, Norway and Sweden) as shown in Figure 2. Several factors explain the remarkable increase in child care enrolment (Jongen, Reference Jongen2008). Firstly, the participation of women increased over the last few decades. While in 1992, 46 per cent of mothers with one child participated in the labour market, this share had increased to 70 per cent in 2005 (CPB, 2007). Secondly, costs of child care borne by parents have decreased as an important part of the costs was shifted to firms. Thirdly, the Dutch government took a large range of initiatives in the 1990s to professionalise and expand the capacity of the child care market. As a result, the child care sector experienced remarkable growth, and waiting lists for parents decreased. At the end of the 1990s, there were no longer concerns about shortages of child care places. The growth in formal child care places was 9 per cent per year over the 1994–2004 period, and about 10–12 per cent per year after 2005. This can be seen in Figure 3. Finally, the increasing enrolment in child care is also explained by a favourable change in parents' attitude towards formal child care.
Percentage of children aged 0–2 enrolled in child care.
Source: OECD, Family database – Enrolment, 2008 (www.oecd.org).


The introduction of demand-financing: the 2005 Child Care Act
A major reform of the Dutch child care market took place in January 2005 with the introduction of the Child Care Act. The Act safeguards the quality of child care and regulates the way it is funded. Under the Child Care Act, the new funding system is fully demand-driven as parents sign a contract directly with the child care centre of their choice. Depending on their income, they may qualify for government reimbursement of part of their child care costs. In 2007, an amendment to the Child Care Act also made it mandatory for parents' employers to contribute to child care costs.
The main reason advanced for the introduction of the 2005 Child Care Act was to give parents greater choice. By increasing parental choice, competition between child care centres would ensure that high-quality services were produced at lower cost. More competition was also expected to provide more innovative services better suited to parental needs. The introduction of market forces was expected to influence the provision of child care as ‘entrepreneurs would better anticipate the demand of parents’ and result in a ‘better balance between demand and supply’.Footnote 3
The main consequence of the 2005 Child Care Act is that it has changed the financing structure to a fully demand-driven funding system. Prior to 2005, three types of child care places existed: places purchased by local municipalities (so-called subsidised places); places purchased by firms; and places purchased by parents. With subsidised places, the local municipality acted as an intermediary by purchasing the child care place from the child care provider and subsequently making it available to parents. Parents who had access to child care through these subsidised places paid an income-related fee, according to a recommended national fee scale. The remainder of the child care costs was then borne by the local community. Subsidised places were prevalent: Bressers et al. (Reference Bressers, Raab and Vermeulen2006) estimate that in 2004 approximately 70 per cent of all child care organisations offered some subsidised places.Footnote 4 Child care costs borne by firms were subsidised by the state as firms were allowed to subtract 30 per cent of their costs from payroll taxes. Parents who purchased places directly from the child care provider could also deduct a part of their child care costs from their taxable income. In the new financing structure, after the implementation of the 2005 Child Care Act, there is no longer a distinction between the three types of child care places. The main implication of the end of supply-financing by municipalities is that the provision of child care in the Netherlands is now fully governed by market forces. Nevertheless, the government still retains an active role by subsidising demand. By granting larger subsidies to low-income groups, the government aims to guarantee financial accessibility to child care. Quality also remains highly regulated through strict minimum quality standards.
Another consequence of the Child Care Act is that it modified the role of local communities in the child care market. Prior to the introduction of the Child Care Act, municipalities played an important role in shaping the local child care provision through the purchase of subsidised places as they could decide with which child care provider to contract and could fix the requirements for granting subsidies.Footnote 5 There is evidence that, in practice, NFP ‘welfare’ organisations were favoured in the contracting process with local municipalities, although this did not occur systematically.Footnote 6 One of the motives behind the preference was the belief that NFP organisations offer more guarantees that the subsidy will be spent on welfare-related issues. For instance, the decree on subsidy funding of the municipality of Hengelo stated that ‘not-for-profit organisations present by definition a guarantee that the subsidy funds would be spent to pursue the objective for which they were issued’.Footnote 7 This type of preference might have been especially common in small municipalities. By removing these subsidy relationships, an important consequence of the 2005 Child Care Act would thus be a levelling of the playing field between FP and NFP organisations as NFP centres now have to compete on equal terms with FP child care centres.
Before its introduction, the law met with some criticism in Dutch early childhood circles. In particular, there were concerns that the 2005 Child Care Act would lead to lower standards of quality. This was mainly due to the first law proposal in which quality was left to self-regulation. In the last version of the law, quality is set through a covenant with the child care sector, but municipalities have the task to monitor quality. In addition, there were some concerns in the run-up to the introduction of the 2005 Child Care Act about the effect of the new system on the accessibility of child care. For example, one commentator noted that:
The financing system of the Basic Child care Provisions Act is oriented to enabling parents with little spending power also to be able to make use of day care for children . . . Theoretically, this is actually how the financing system is structured, and, indeed parents with less income receive a higher financial contribution from the government to fund their day care for children. Nonetheless, it would appear less than probable that entrepreneurs in day care for children will feel inspired to set up business in the poorer neighbourhoods or in country areas, where they will be less assured of a flow of customers (idealists excepted). Offering services in a wealthy neighbourhood with two-income households is safer for an entrepreneur, and the market there is far from saturated.Footnote 8
The main concern was therefore that the provision of child care would move away from poor rural neighbourhoods towards wealthy urbanised neighbourhoods where the demand for child care is high and the market is profitable. This may in turn have consequences for social policies as availability of child care may become scarcer in less wealthy neighbourhoods.
Factors affecting the local provision of child care: conceptual framework
In this article, we investigate the factors predicting the patterns of local child care provision. Based on theoretical and empirical results of the literature, we can divide the main factors affecting the provision of child care in a local market between demand-side and supply-side factors. There is an obvious interplay between these two types of factors. On one side, the demand for child care by parents might be constrained by the available capacity of child care centres in the market. On the other side, the quantity of child care provided by private firms depends on the profitability of the market and thus on the level of demand.
The local demand for child care
The demand for child care is the result of households' decisions on work and child care arrangements. At the level of a local market, the total demand for child care depends on several factors. Firstly, the demand for child care is positively related to the number of pre-school children in the market and the level of women's participation in the labour market (Gonzalez and Vidal, Reference Gonzalez and Vidal2006; Kjulin, Reference Kjulin1995).Footnote 9 Secondly, socio-economic characteristics also affect the local demand for child care. There is evidence that higher socio-economic groups tend to use professional day care services more than lower socio-economic groups (Blau and Robins, Reference Blau and Robins1988; Rose-Ackerman, Reference Rose-Ackerman1986). In the Netherlands, for instance, 50 per cent of highly qualified women use professional child care centres compared to 19 per cent for less qualified mothers, who in general show a preference for home care by mothers and informal care by family members and relatives (Statistics Netherlands, 2002). Next to parents' preferences, higher demand by high socio-economic group can also be explained by an income effect, as wealthy households can more easily afford formal paid care than less wealthy households. Thirdly, the demand for child care also varies with the level of urbanisation. Urban markets exhibit a higher demand for formal paid care than rural markets. In the Netherlands, 20 per cent of children aged 0–12 living in highly urbanised areas attend professional day care against fewer than 10 per cent in rural areas (Statistics Netherlands, 2002). This can be explained by the fact that better infrastructure in urban markets improves the accessibility of child care services. Also, women in urban areas tend to be better qualified than women in rural areas and therefore tend to participate more in the labour market.
Finally, the demand for child care is also related to the quality of services. Since in the Netherlands quality standards are set nationally, the effects of quality differences across markets are likely to be negligible. Nevertheless, the demand for formal child care might be affected by how parents perceive the quality of informal provision of child care (Walker, Reference Walker1992). In the Netherlands, mothers living in rural areas tend to have more trust in the quality of informal day care over professional day care (SCP, 2006).
In order to move from this general framework to a testable model, we must make a number of simplifying assumptions which reflect the limitations of the data. First of all, unfortunately data on female activity at the local level are not available. Since there is a correlation between female activity and socio-economic characteristics and urbanisation, we can assume that the effect of female activity is captured by these factors. Secondly, we do not have data on the number of pre-school children but only on the number of families and on the proportion of children aged 0–15. Finally, data on how parents perceive the quality of informal child care are also not available. As a result, we will consider the following factors as explaining the level of demand in a local market: average income per capita (reflecting socio-economic background), number of families, percentage of children aged 0–15 and the degree of urbanisation.
The end of local supply by municipalities
The supply of child care in the Netherlands is in the hands of private entrepreneurs. On the supply-side, market profitability plays a central role in determining the quantity of child care provided by child care centres, as providers are more likely to enter markets with high potential demand for child care. Before 2005, however, only part of the provision of child care was affected by demand factors, notably through parents directly buying private places. Another part was determined by political factors. Before the Child Care Act, the local council of each municipality was in charge of deciding how much to invest in the purchase of subsidised child care places. Local council members are elected through local elections and are thus governed by the desire to fulfil the expectations of their voters in order to be re-elected (Maskin and Tirole, Reference Maskin and Tirole2004). If voters express a high demand for child care facilities, local council members will therefore try to improve the availability of these facilities within their budget constraints.Footnote 10 Council members might also do so for ideological motives. Left-wing council members generally show the strongest support for increasing the provision of child care. Van Dijk et al. (Reference Van Dijk, Koot-du Buy and Siegers1993) estimate the factors affecting the supply of child care by Dutch municipalities in 1993. They find that the decision to invest in child care provision was positively affected by the percentage of left-wing council members as well as by the proportion of women in the council. Similar results were found in other countries such as Sweden (Gustafsson and Stafford, Reference Gustafsson and Stafford1992) where provision was entirely determined by public officials. The conclusion of van Dijk et al. (Reference Van Dijk, Koot-du Buy and Siegers1993) is that although demand factors – such as income and the number of pre-school children in the market – played a role, political factors matter as well.
Since 2005, however, local council members can no longer influence the supply of child care. The Child Care Act created a shift in incentives for child care centres. While child care centres formerly had incentives to establish new centres in markets where public officials were especially willing to invest in child care by buying large amounts of subsidised places, this is no longer the case under the new regime. Now, child care organisations have incentives to open facilities in markets which are financially profitable: that is, where demand from parents is high. Therefore, we expect that after 2005 demand factors play a greater role in determining the local provision of child care. In our empirical analysis, we will therefore test the hypothesis that the impact of demand factors on the local provision of child care has increased after the introduction of the Child Care Act.
Provision by for-profits and not-for-profit centres
Another implication of the 2005 Child Care Act is that it ended the subsidy relationships between municipalities and child care providers. As such, it altered the playing field of FP and NFP child care providers. This is likely to have significantly modified the provision of child care by FP and NFP providers, as NFP no longer receive preferential financial treatment. A main question in our conceptual framework is whether FPs and NFPs respond in the same way to the shifts in incentives created by the 2005 Child Care Act. While FPs generally aim to maximise their profits, NFPs may have other goals such as maximising quality or serving other specific market segments.
According to economic theory, NFPs may be better able to defend public concerns than FPs. This gives support to the status of NFP providers as preferential contractors by local municipalities. One of the main arguments is that, even in the absence of favourable subsidy treatment, NFPs can ‘make a difference’: that is, outperform FPs on several important aspects, notably quality and accessibility. This occurs because employees of NFP are willing to provide effort beyond the level explicitly contracted, because they know that their efforts will be spent on the organisation's mission and not redistributed as profits to shareholders. In other words, because they can attract ‘donated labour’ (Grout and Yong, Reference Grout and Yong2003; Hansmann, Reference Hansmann1980), NFP organisations may therefore be able to produce services at lower costs than FP organisations (Lakdawalla and Philipson, Reference Lakdawalla and Philipson2006). This cost advantage could allow them in turn to provide higher quality or to be present in market segments that are not profitable for FP organisations. If these theoretical considerations hold, this would imply that despite the end of supply-financing by municipalities, Dutch NFP organisations might still be able to survive in less profitable market segments.
Empirical evidence on whether NFPs actually ‘make a difference’ in the child care sector is rather mixed. While some Canadian studies do find that NFPs provide higher quality than FPs (Cleveland and Krashinsky, Reference Cleveland and Krashinsky2004; Japel et al., Reference Japel, Tremblay and Côté2005), many other USA studies do not (Morris and Helburn, Reference Morris and Helburn2000; Blau and Mocan, Reference Blau and Mocan2002). The same mixed evidence holds for studies looking at whether NFPs are better able to guarantee accessibility to special target groups (Cleveland and Krashinsky, Reference Cleveland and Krashinsky2005; Morris and Helburn, Reference Morris and Helburn2000; Blau and Mocan, Reference Blau and Mocan2002; Whitebook et al., Reference Whitebook, Howes and Phillips1990). One of the reasons why NFPs may not make a difference is that they may suffer from inefficiencies, such as an unclear mission, high wages, a lack of solid financial management and so on. The Canadian and USA evidence in the child care market shows that NFPs tend to offer higher wages than FPs (Mocan, Reference Mocan1995; Mocan and Terkin, Reference Mocan and Terkin2000; Blau and Mocan, Reference Blau and Mocan2002; Cleveland and Krashinsky, Reference Cleveland and Krashinsky2004). Mocan (Reference Mocan1995) and Blau and Mocan (Reference Blau and Mocan2002) find no cost or efficiency differences between FPs and NFPs in the child care sector.
Anecdotal evidence in the Dutch child care market suggests that NFPs may experience more difficulties surviving in the new market conditions created by the 2005 Child Care Act. A study by PriceWaterhouseCoopers (2005) suggests that the introduction of market forces over the 1990s has had a larger impact on child care organisations with a welfare tradition than on the ones which already had a market orientation. Indeed, financial analysis of welfare child care organisations shows that they were often not profitable without subsidies, lacked solid financial controls and the capacity to raise capital. In that case, we should find in our empirical analysis that NFPs may not be able to survive without subsidies from municipalities and may therefore exit the market or shift towards more profitable markets.
Data and methodology
The empirical analysis uses data from the General Firm Registry on the location and legal status of child care facilities for the years 1999–2001 and 2006.Footnote 11 This dataset contains a sizeable portion of the total population of child care facilities in the Netherlands as registered at the Chamber of Commerce.Footnote 12 The unit of analysis is a local market for child care provision, defined as a four-digit postal code area, as parents in general do not want to take their children to a facility that is located too far from their home. After excluding markets with no child care facility both in 1999–2001 and in 2006, and markets with fewer than 100 inhabitants as they are too small to sustain any child care provider, the sample is reduced to 2,468 local child care markets.Footnote 13 These data are matched with demographic data at the postal code area level for the year 1999 obtained from Statistics Netherlands.Footnote 14 This dataset contains a number of variables that capture the characteristics of the market, such as population, average income per capita, average property values, the percentage of low-income people, the percentage of families with children, the percentage of persons under the age of 15, average family size, level of urbanisation and so on.
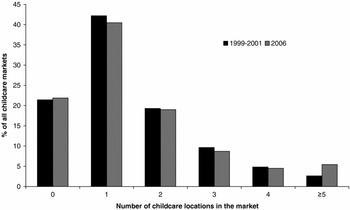
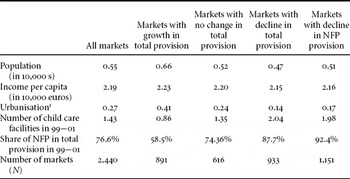
Most of the local markets for child care have only one child care facility as shown in Figure 4. Only 3 to 6 per cent of the markets have five or more child care centres. The number of child care facilities in our sample has increased over the period from approximately 3,550 in the period 1999–2001 to around 3,900 in 2006: an increase of approximately 10 per cent. On average, there were 1.4 child care facilities per market in the period 1999–2001 against 1.6 in 2006. Yet the growth is not evenly spread over the local markets. Table 1 shows that growth in child care provision has predominantly occurred in markets with above-average population, income and level of urbanisation. In other words, it seems that most of the markets in which a drop (an increase) in child care provision took place were relatively poor rural (wealthy urbanised) areas.
The distribution of child care provision over the local markets for child care in the Netherlands.
Source: Own computations.

Average sample statistics of markets with a decline, growth or no change in child care provision

Note: 1Urbanisation is a dummy variable which takes value 1 for a high to very high degree of urbanisation and 0o otherwise. It is calculated on the basis of the surrounding address density. A value of 1 stands for ≥1,500 surrounding addresses per km2.
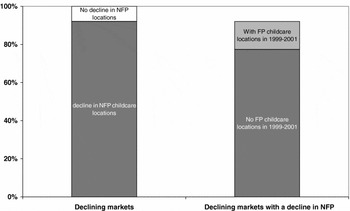
Another important trend in the data is the important decline in the share of facilities that are run on a NFP basis. While in the period 1999–2001 approximately 80 per cent of all locations were run on a NFP basis, this number fell to just short of 50 per cent in 2006. Similarly, the fall in the number of NFP child care facilities has not been spread evenly over the different markets. Table 1 shows that markets that experienced a decline in NFP provision have lower-than-average income and population and that they are located in areas with a lower-than-average degree of urbanisation. Figure 5 indicates that the bulk (92 per cent) of the markets in which the number of child care facilities decreased is characterised by an exit of NFP facilities. In addition, in 77 per cent of the cases the exit of NFPs organisations takes place in markets where FP providers were always absent. Apparently, NFPs are withdrawing their activities from markets in which FP child care providers were not active.
Declining markets and FP–NFP provision.
Source: Own computations.

The objectives of the empirical analysis in this article are to examine how the factors explaining the provision of child care changed in 2006 compared to the period 1999–2001, and how the pattern of the provision by FP and NFP child care centres varied between these two periods. To answer these questions, two types of models are estimated. The first is an ordinary least squares (OLS) model which looks at the factors explaining the level of child care provision in both time periods. Comparing the coefficients between both years gives insights on which factors affecting provision have become more or less important over the period. The second model estimated is a probit model which looks at the factors explaining the growth (or decline) in child care provision in the local markets. In the latter model, the dependent variable takes the value one if there has been growth (decline) in the market and zero otherwise. The dependent variable is then the probability that the market has experienced growth (decline) over the period.
Due to their simple nature, the models explain only a small proportion of the overall variation. More sophisticated models with more explanatory variables (such as the degree of female labour participation, for instance) would increase their explanatory power. Unfortunately, data on the female labour participation were not available at the postal code area level. Nevertheless, these simple models capture the main trends and provide useful insights on the dynamics at play in the Dutch child care market. The preferred specification includes the following factors as explanatory variables: average per capita income, the percentage of families with children and a dummy variable for the level of urbanisation.Footnote 15 The results are robust to various specifications with different proxies for purchasing power, namely average property value or the percentage of low-income households, and different demographic variables, such as the percentage of persons under the age of 15 and average family size.
The results of the analysis must be interpreted with care as the methodology only allows for a comparison of child care provision before and after the regulatory reform and not for an evaluation of the exact effects of the Child Care Act on the child care market. Indeed, other unobserved factors (such as a change in technology or preferences, for instance), may also have affected the market in the same period. Although there is no evidence of other important shifts in the market beside the policy reform, this possibility cannot be fully excluded. In addition, the reform is of a very recent date. Supply and demand may not have fully adjusted to the regulatory framework yet.
Results
Demand factors affecting child care provision
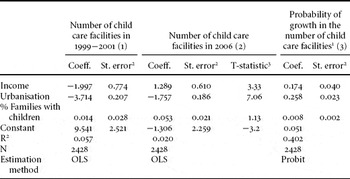
The first empirical question this article aims to address is: How did the factors that explain the provision of child care in a market in 2006 change compared to the period 1999–2001? The provision of child care is defined as the number of child care facilities per 10,000 inhabitants. Data on the number of child care places per provider were not available. The estimation results of the OLS model are given in columns (1) and (2) in Table 2. The model is estimated separately for the period 1999–2001 and the year 2006. The estimation results of the growth (probit) model are given in column (3) in Table 2.
Factors explaining the provision of child care facilities in a market

Notes: 1The probit model takes as the independent variable a binary variable that takes on the value 1 if there has been growth in the total number of locations in a market. The coefficients reported gives marginal effects at the mean.
2Standard errors were calculated using the Huber–White sandwich estimator of variance. All coefficients are significant at 5%, except for the percentage families with children in 1999.
3The t–statistic reports on the test for equality of the coefficients for 1999–2001 and 2006. The difference between the coefficients for the period 1999–2001 and 2006 are significant at 1%, except for the coefficient for the percentage of families with children.
The results in columns (1) and (2) indicate that in 2006 the provision of child care is more responsive to income and urbanisation than in 1999–2001. A market's purchasing power has become a more important factor in determining the type of market child care providers locate. In fact, the sign of the coefficient has even reversed. In addition, there are relatively more child care locations located in a city in 2006 compared to the period 1999–2001. Although other dynamics may have been at play, this is consistent with the intuition that the introduction of demand-financing would provide stronger incentives for child care providers to locate in markets with higher levels of purchasing power and in more urbanised neighbourhoods. These results mirror the descriptive statistics given in the previous section, where Table 1 showed that most of the growth in child care provision took place in neighbourhoods with above-average levels of income and urbanisation. Another illustrative statistic is the partial correlation between the number of locations in a market and population size: for the period 1999–2001 it equalled only 0.24, whereas it equalled 0.47 for 2006. Overall, it seems that the provision of child care is more responsive to factors driving the demand of child care in 2006 as compared to the period 1999–2001.
The growth estimation presented in column (3) in Table 2 confirms the previous results. The probability that a market has experienced growth in the number of child care facilities has been higher in areas with a higher level of purchasing power and a larger percentage of families with children. In addition, the probability of experiencing growth has been higher in markets that were located in a city or, more generally, in more highly urbanised areas. Economically, the most significant coefficients are those for income and the degree of urbanisation of a market as they have the largest effect on the probability of a market experiencing growth in the level of child care provision. For example, the probability of a market experiencing growth in the number of child care facilities is about 25 per cent higher if that market is located in a city.
Yet there might be alternative explanations to these trends beside the influence of the 2005 Child Care Act. For instance, the growth in child care provision in wealthy urbanised areas could also have been caused by a significant increase in the demand for child care in these markets compared to less wealthy rural areas. Nevertheless, there is no evidence of differential variations in demand across markets. Demographic characteristics of markets have not changed much between 1999–2001 and 2006, and in particular relative differences in population and incomes across municipalities show little variation in this period. Also, there is no evidence of differential increases in women's participation in the labour market between urban and rural areas. While in 1999, 52 per cent of women in rural areas participated in the labour market against 55 per cent in urban areas; these figures were 56 per cent and 60 per cent respectively in 2006.Footnote 16 This seems to suggest that demand for child care has increased in equal proportions across heterogeneous markets. Therefore, the more likely explanation for the observed shift in local provision towards wealthy urbanised areas is that the end of supply financing increased the incentives for private providers to locate into high-demand markets.
The story that child care provision is more attuned to factors driving the demand for child care has both a positive and a negative connotation. On the upside, the market seems to be working more efficiently, allocating funds in a way that more appropriately fits the needs of consumers. On the downside, the phenomenon that child care providers focus more on richer and more urbanised markets may have negative effects on the accessibility of child care and may therefore raise distributional and social concerns.Footnote 17 It is important to note that the changes in the regulatory framework are very recent and that the market may still be in transition. Possibly, parents in low-income markets have not become fully aware of the new possibilities for financial support and have accordingly not adjusted their demand. On the supply side too, a further adjustment may be expected. Intuitively, child care providers may have first targeted areas with slightly higher purchasing power, where they may be able to offer a richer range of services at slightly higher prices. In the future, child care providers may well ‘rediscover’ areas with lower purchasing power as viable markets for their services. Once they do, child care provision may again experience a shift as demand and supply realign in areas with lower purchasing power.
Market dynamics of FP and NFP child care provision
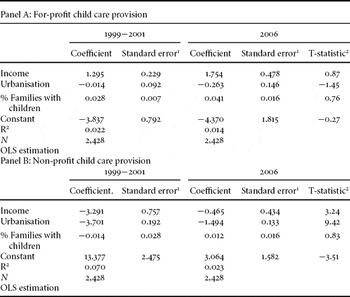
The second question this paper aims to address is: How did the pattern of FP and NFP child care provision change in 2006 compared to 1999–2001? As shown in the previous section, the share and number of NFP providers has fallen quite dramatically during this period and this drop has been especially pronounced in markets with no FP provision, suggesting that NFPs tend to exit markets that are unattractive to FPs. The provision of FP (respectively NFP) providers is here defined as the number of FP (respectively NFP) child care facilities per 10,000 persons in a market. The OLS estimation results for the provision of FP (Panel A) and NFP (Panel B) child care providers in 1999–2001 and 2006 are given in Table 3.
Factors explaining the provision of FP and NFP child care facilities in a market

Notes: 1Standard errors were calculated using the Huber–White sandwich estimator of variance.
2The t-statistic reports on the test for equality of the coefficients for 1999–2001 and 2006.
For both types of child care providers, demand factors seem to have grown more important, but only for NFP providers has this change been significant. For example, income has become a more important determinant. The difference is, however, statistically significant only for NFP provision. In addition, there has been a shift in child care provision away from rural markets towards highly urbanised areas, which was significant only for NFP providers. The exit of NFP organisations from rural neighbourhoods is striking: whereas, for the period 1999–2001, being located outside of a city meant that a market had about 3.5 locations more per 10,000 inhabitants, this difference has been reduced to 1.5 for 2006. The presence of families with children has not become significantly more important to either type of child care provider. The biggest change therefore has occurred in the child care provision by NFP facilities that are still active in 2006. This provision seems to have become significantly more responsive to factors driving the demand for child care, specifically income and urbanisation.
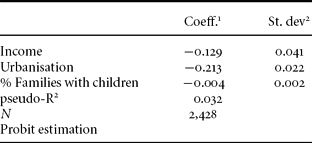
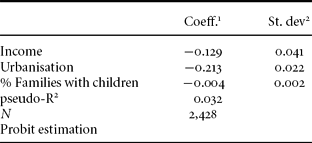
Table 4 shows the results of the probit estimation looking at the factors explaining the decline in NFP provision. The table shows that the probability of a market experiencing a decline in the number of NFP child care facilities is higher for areas with lower income, a lower percentage of families with children and a lower degree of urbanisation. In urbanised markets, for example, the probability of having experienced a decline in the number of NFP child care providers is 20 per cent lower than in rural markets.
Factors explaining the probability that the provision of NFP child care facilities has decreased in a market
Notes: 1Marginal effect at the mean. For coefficient urbanisation: discrete change in probability.
2Standard errors were calculated using the Huber–White sandwich estimator of variance.
The results confirm that NFP child care providers have mostly exited markets where demand factors were less favourable; that is, markets with lower average income and less urbanised markets. Again, although other factors may have contributed to this development, a possible explanation is that in as far as NFP child care facilities were the favoured recipients of municipal subsidies, they lost an important source of income when these subsidies were removed in the 2005 Child Care Act. Having now to rely solely on income generated from their contracts with parents rather than a steady stream of municipal subsidies, they tend to leave markets where demand is not sufficiently high. On a level playing field (that is, in the absence of municipal subsidies), neither type of child care provider appears to be able to sustain operation in these markets. These results also suggest that NFPs are not able to survive in non-profitable markets as the theoretical argument of donated labour would predict. Instead, the results are more in line with the empirical literature that finds no intrinsic difference in the behaviour of FP and NFPs organisations. An in-depth analysis of the differences between FPs and NFPs organisations in the Dutch child care market would, however, require consideration of aspects of quality and prices for which data were not yet publicly available.
Conclusion
The market for child care in the Netherlands has proven to be very dynamic over the last decade. Most importantly, the legislative environment of the Dutch child care market changed significantly with the introduction of the 2005 Child Care Act. This Act attributed greater importance to the demand for child care from parents by introducing a fully demand-financed system.
This article compares the provision of child care under the old regime (in the period 1999–2001) and after the introduction of the 2005 Child Care Act (in 2006). The results indicate that the provision of child care has become more responsive to demand factors, specifically income and urbanisation, after the introduction of the 2005 Child Care Act. Compared to the period 1999–2001, the provision of child care in 2006 has shifted towards wealthy urbanised areas where there is high purchasing power and a high demand for child care. This shift came at the detriment of poorer rural areas from which child care facilities withdrew their activities. On the one hand, this finding suggests that there is a more efficient interplay between supply and demand in the Dutch market for child care. On the other hand, however, this finding seems to substantiate concerns that existed prior to the introduction of the Act that the new financing system might cause child care providers to focus on high-income and more urban markets. This might endanger accessibility of child care in poor rural areas. Although financial access is still guaranteed in these markets in the form of target-group subsidies, parents may have to travel further away to find a child care provider.
This article also provides an analysis of changes in the provision of child care by NFP and FP child care providers over the same time period. The empirical evidence shows that FPs account for a larger share of all child care facilities in 2006 and that there has been an important drop in provision of child care by NFP facilities, especially pronounced in low-demand markets where FP providers were not active. A possible explanation for these results is that, before the introduction of the 2005 Child Care Act, NFP providers were frequently granted municipal subsidies and were thus able to maintain their activities in non-profitable markets. The removal of these subsidies under the 2005 Child Care Act levelled the playing field between FP and NFP providers. In the absence of subsidies, FP and NFP providers tend to exhibit the same market behaviour and to focus on the same market segments. In this case, generic policies appear more appropriate than policy instruments specifically targeted at NFP organisations. If the Dutch government considers that provision and accessibility of child care should be guaranteed even in poor rural areas deserted by NFP organisations, an option is to implement location subsidies to give incentives to providers – without distinction between FP and NFP providers – to enter these markets. Future work should focus on examining further the differences between the two types of providers, particularly on aspects of quality and prices.
Acknowledgement
We are very thankful to Paul Grout, Pierre Koning, Raymond Gradus and anonymous referees for valuable comments.