





Introduction
Climate change is projected to increase both mean temperatures and temperature variability across North America (USGCRP 2017). These trends are expected to affect weed–crop competition and weed management options through several mechanisms, including the direct effects of temperature on the fitness of both weeds and crops (Korres et al. Reference Korres, Norsworthy, Tehranchian, Gitsopoulos, Loka, Oosterhuis, Gealy, Moss, Burgos, Miller and Palhano2016; Peters et al. Reference Peters, Breitsameter and Gerowitt2014; Ramesh et al. Reference Ramesh, Matloob, Aslam, Florentine and Chauhan2017). Plant species differ in their thermal optima. Increasing temperatures may enhance growth and fitness up to a species-specific threshold, beyond which thermal stress reduces performance. Both interspecific and intraspecific variation in temperature responses are influenced by multiple factors, such as photosynthetic pathway (C3 vs. C4) and the availability of proteins that promote heat resistance (Sage and Kubien Reference Sage and Kubien2007; Wahid et al. Reference Wahid, Gelani, Ashraf and Foolad2007). When temperature increases affect weeds and crops differently, these environmental changes may alter the direction or magnitude of weed–crop competition.
In addition to exerting direct effects on weeds and crops, temperature may also alter the efficacy of weed control tactics. In the case of chemical weed control, elevated temperatures can reduce herbicide efficacy and increase the risk of herbicide resistance (Jugulam et al. Reference Jugulam, Varanasi, Varanasi, Prasad, Yadav, Redden, Hatfield, Ebert and Hunter2018; Varanasi et al. Reference Varanasi, Prasad and Jugulam2016). Reduced herbicide efficacy under elevated temperatures is especially concerning considering that herbicides are the primary method of weed management in the United States (Varanasi et al. Reference Varanasi, Prasad and Jugulam2016; Ziska Reference Ziska2020). Glyphosate, the most widely used herbicide both in the United States and globally (Duke Reference Duke2018), can exhibit variable performance under different temperature conditions, as air temperature influences weed growth and glyphosate sensitivity (e.g., due to altered translocation) among species and, in some cases, among populations (Matzrafi Reference Matzrafi2019).
Palmer amaranth (Amaranthus palmeri S. Watson) is among the most economically damaging weeds in the United States and globally (Roberts and Florentine Reference Roberts and Florentine2022; Ward et al. Reference Ward, Webster and Steckel2013). This fast-growing, dioecious C4 species is a strong competitor across many cropping systems and environments. Amaranthus palmeri has been reported in more than 30 U.S. states and 45 countries (Roberts and Florentine Reference Roberts and Florentine2022; USDA-NRCS 2026). This species is native to the Sonoran Desert and has been expanding its range northward in the United States (Oliveira et al. Reference Oliveira, Jhala, Bernards, Proctor, Stepanovic and Werle2022), including expansion into several New York counties (LMS, personal observation). Increasing temperatures are expected to enhance the growth of A. palmeri and enable poleward range expansion (Guo and Al-Khatib Reference Guo and Al-Khatib2003; Kistner and Hatfield Reference Kistner and Hatfield2018).
Management of A. palmeri is further complicated by widespread herbicide resistance. In the United States, A. palmeri biotypes have evolved resistance to herbicides in WSSA Groups 2, 3, 4, 5, 6, 9, 10, 14, 15, and 27 (Heap Reference Heap2026). Glyphosate-resistant (GR) populations of A. palmeri were first detected in Georgia in 2006 (Culpepper et al. Reference Culpepper, Grey, Vencill, Kichler, Webster, Brown, York, Davis and Hanna2006) and have since been documented across the United States and in Argentina, Brazil, Mexico, South Africa, Spain, and Uruguay (Heap Reference Heap2026; Küpper et al. Reference Küpper, Manmathan, Giacomini, Patterson, McCloskey and Gaines2018; Molin et al. Reference Molin, Patterson and Saski2020). Several previous studies reported that high temperatures exceeding 30 C favor photosynthesis and growth of A. palmeri (Ehleringer Reference Ehleringer1983; Guo and Al-Khatib Reference Guo and Al-Khatib2003; Wright et al. Reference Wright, Coble, Raper and Rufty1999). However, a more recent study evaluating temperature and carbon dioxide effects on GR and glyphosate-susceptible (GS) A. palmeri biotypes found that plant growth varied with biotype and carbon dioxide concentration but showed little response to temperature (33/23 C vs. 36/26 C day/night) (de Souza Rodrigues et al. Reference Souza Rodrigues, Shilling, Tishchenko, Bowen, Deng, Hall and Grey2023).
This study evaluates the degree to which increasing temperatures may increase the risk posed by two A. palmeri biotypes in corn (Zea mays L.) cropping systems. We assessed three dimensions of weed risk: early growth rate, glyphosate sensitivity, and ability to reduce corn biomass. Two experiments were conducted using GR and GS A. palmeri biotypes. The first experiment was a glyphosate dose–response study using application rates of 27.2, 54.4, 108.8, 217.5, 435, 870 (label-recommended rate), 1,740, and 3,480 g ae ha⁻1. This experiment was conducted under low (25/15 C), medium (30/20 C), and high (35/25 C) day/night temperature regimes. We hypothesized that elevated temperatures would increase early plant growth and reduce glyphosate sensitivity in the GR biotype, but would not affect glyphosate sensitivity in the GS biotype. The second experiment evaluated weed–crop competition using an additive design in which one corn plant was grown alone or with one, two, or four GR or GS A. palmeri plants. As in the first experiment, plants were grown under low (25/15 C), medium (30/20 C), and high (35/25 C) day/night temperature regimes. We hypothesized that corn biomass reductions caused by A. palmeri competition would increase with temperature, particularly when competing with the GS biotype.
Materials and Methods
Plant Material
Two geographically distinct A. palmeri biotypes were used in this study. In 2020, a suspected GR A. palmeri biotype was identified from a soybean [Glycine max (L.) Merr.] field near Howard, Steuben County, NY, USA (42.36°N, 77.51°W), hereafter referred to as “GR.” Most fields within this operation were in a corn–soybean–alfalfa (Medicago sativa L.) rotation. Seed head samples were collected from 20 female A. palmeri plants found within the main production field that received in-crop glyphosate applications during the growing season. Field edges were avoided during sampling. After in situ collection, the seed heads were threshed. The resulting seeds were cleaned and stored at 4 C until the start of the experiment. Butler-Jones et al. (Reference Butler-Jones, Maloney, McClements, Kramer, Morran, Gaines, Besançon and Sosnoskie2024) confirmed glyphosate resistance in this biotype. A GS biotype collected from Keith County, NE, USA, in 2017 was used in this experiment (Oliveira et al. Reference Oliveira, Giacomini, Arsenijevic, Vieira, Tranel and Werle2021). Susceptibility of this biotype to glyphosate was confirmed by Oliveira et al. (Reference Oliveira, Giacomini, Arsenijevic, Vieira, Tranel and Werle2021). Seed from the GS biotype was donated by Rodrigo Werle from the University of Wisconsin–Madison. Complete herbicide and management records were not available for both biotypes. The Nebraska GS biotype was included in the study because a GS A. palmeri biotype has not yet been identified in New York State, making it impossible to control for genetic background. Considering their geographically distinct origins, the GS and GR biotypes used in this study may have experienced very different selection pressures. No further selection of either A. palmeri biotype was executed before the start of the experiment. The seed lots were not genetically homogeneous; however, the resistance phenotypes (GR or GS) were known to be relatively consistent within these seed lots based on previous research.
Dose–Response Study
In 2023 and 2024, growth chamber dose–response studies were conducted at Cornell AgriTech in Geneva, NY, USA (42.86°N, 76.98°W) to evaluate the responses of the GR and GS A. palmeri biotypes to temperature and glyphosate. Plants were grown in Conviron PGR15 growth chambers (Controlled Environments, Winnipeg, MB, Canada). The study was arranged as a completely randomized design (CRD) with 10 replications per treatment and repeated. Five to 10 A. palmeri seeds were planted in 7.6-cm-diameter pots filled with Lambert LM-111 potting mix (80% to 90% coarse Canadian sphagnum peat moss with perlite, calcitic and dolomitic limestone, wetting agent, and starter fertilizer charge; Lambert, Rivière-Ouelle, QC, Canada). Growth chambers were set to a 16-h photoperiod, 60% relative humidity, and one of three temperature regimes: low (25/15 C, day/night), intermediate (30/20 C, day/night), or high (35/25 C, day/night). The low-temperature regime approximates current average summer temperatures in New York State (Kunkel et al. Reference Kunkel, Frankson, Runkle, Champion, Stevens, Easterling, Stewart, McCarrick and Lemery2022), whereas the high-temperature regime is expected to be near optimal for A. palmeri growth (Godar et al. Reference Godar, Varanasi, Nakka, Prasad, Thompson and Mithila2015; Guo and Al-Khatib Reference Guo and Al-Khatib2003). Growing media moisture was maintained for the duration of the experiment through daily irrigation. Seedlings were thinned to one plant per pot and treated with glyphosate when plants within each temperature regime reached the 2- to 4-leaf stage and the majority of plants were at the 3-leaf stage.
Glyphosate was applied at 27.2, 54.4, 108.8, 217.5, 435, 870 (label recommended rate for corn), 1,740, and 3,480 g ha−1 (RoundUp PowerMax®, Bayer Crop Science, St Louis, MO, USA). Additionally, 10 replicate plants of each biotype per run were left unsprayed to serve as a nontreated control (NTC). Applications were made using a single-nozzle cabinet sprayer (86956 MN-251, DeVries Manufacturing, Hollandale, MN, USA) equipped with a TeeJet® 8002VS nozzle (TeeJet® Technologies, Spraying Systems, Glendale Heights, IL, USA). The sprayer was calibrated to deliver a spray volume of 187 L ha−1 at 276 kPa. At 14 d after treatment (DAT), aboveground biomass was collected, dried at 60 C for 7 d, and weighed. Dry biomass was converted to percent biomass relative to the NTC using Equation 1:
 ${\rm{Percent}}\;{\rm{biomass}} = {{{\rm{DBEU}}} \over {\underline {{\rm{DBNTC}}} }} \times 100$
with DBEU representing the biomass of the experimental unit and DBNTC corresponding to the mean biomass of the NTC for each biotype.
Competition Study
To evaluate the impact of temperature and biotype on competition between A. palmeri and corn, a repeated growth chamber experiment was conducted in 2023 and 2024 at Cornell University, Ithaca, NY, USA. Field experiments were not conducted because of the risk of introducing additional A. palmeri plants to this recently invaded region of New York State.
The three temperature treatments were the same as those used for the dose–response experiment. To account for potential differences among chambers, temperature treatments were reassigned to different chambers between the first and second experimental runs. All chambers were maintained at a 14-h photoperiod for both runs of the experiment. The 14-h photoperiod was preferred over the 16-h photoperiod used for the dose–response study because the competition study was longer and the 14-h photoperiod reduced the risk that corn plants would reach the height of the chamber ceiling. Relative humidity was high (up to 99%) due to the frequent watering. The plants were watered as needed, up to once per day as seedlings and up to twice per day as water demands increased. This flexible watering schedule reduced confounding between effects of temperature and water stress. Soil moisture was not quantified, and it is possible that vapor pressure deficit varied among chambers. No insect pest or disease issues were observed.
Each of the three growth chambers contained sixty-three 3.8-L pots per run, corresponding to nine replicates of seven treatments arranged in a CRD. All pots were filled with potting mix containing a high rate of starter fertilizer (0.2 m3 of peat, 0.2 m3 of vermiculite, and 0.1 m3 of perlite plus 1.8 kg of CaSO4, 1.8 kg of 10-5-10 N-P-K, and 2.3 kg of lime). Additional fertilizer was not applied during the 6-wk duration of each experimental run because there were no visible symptoms of nutrient deficiency, and we did not want plants to reach the chamber ceiling. The 6-wk duration was chosen because the critical weed-free period can end around this time in corn, although it depends on environmental and management conditions. Pots were re-randomized within chambers approximately once per week to minimize potential effects of environmental gradients within the chambers.
Treatments included one corn plant grown alone or one corn plant grown with one, two, or four GR or GS A. palmeri plants. This additive design was used to mimic weed–crop competition under field conditions and quantify the impact of A. palmeri on corn without confounding interspecific and intraspecific competition (Gibson et al. Reference Gibson, Connolly, Hartnett and Weidenhamer1999; Snaydon Reference Snaydon1991); a replacement design would be better suited for comparing the relative strength of these competitive interactions (Hamilton Reference Hamilton1994).
The corn variety was ‘DKC44-80RIB’ (Bayer Crop Science). Seeds were sown on the soil surface and covered with approximately 2 mm of soil. To account for potential germination failure, seeds were planted at higher than required densities and later thinned or transplanted (within chamber and biotype) to achieve the desired densities. Most thinning and transplanting occurred when corn had one true leaf. For the first run of the study, all transplanting occurred 12 d after planting; this information is not available for the second run of the study, but the timing would have been similar. There were no obvious differences between data from transplanted versus non-transplanted pots or plants.
At 6 wk after planting, all plants were counted and cut at the soil surface. For each pot, corn aboveground biomass was placed in one paper bag and A. palmeri aboveground biomass was placed in a second bag. Biomass was dried at 55 C for at least 72 h and weighed.
Statistical Analysis
Data were analyzed in R v. 4.3.1 (R Core Team 2023). For the dose–response experiment, ANOVA confirmed no significant differences in percent biomass between the experimental runs, and data were pooled. A three-parameter symmetrical log-logistic model was fit using the drc package v. 3.0-1 (Ritz et al. Reference Ritz, Baty, Streibig and Gerhard2015). The following functions related to dose–response analysis were included with the drc package. Because models could not be fit to the GS biotype due to its high sensitivity to glyphosate, only data from the GR biotype were used in this analysis. This model was confirmed to fit the data using the modelFit function. The mselect function was used to compare the three-parameter log-logistic model with the four-parameter symmetrical log-logistic, four-parameter Weibull, and five-parameter Brain-Cousens (hormesis) models and their Akaike information criterion (AIC) values were compared. Because it had the lowest AIC, the three-parameter symmetrical log-logistic model was chosen. The three-parameter model was used to determine the dose of glyphosate needed to reduce the biomass of the GR A. palmeri biotypes by 50% (ED50) relative to the NTC using Equation 2 (Knezevic et al. Reference Knezevic, Streibig and Ritz2007):
 $Y = \;{d \over {1 \!+\! {\rm{exp}}\left[ {b\left( {{\rm{log}}\; x \!-\! {\rm{log}}\; e} \right)} \right]}}\;$
where Y is the aboveground dry biomass described as a percentage of the mean biomass of the NTC and x is the dose of glyphosate. Parameters d and e are the upper limit of the log-logistic curve and ED50, respectively. Parameter b is the relative slope around parameter e.
The complete dataset was used to fit a linear mixed model to determine the effect of temperature and biotype on the nontreated A. palmeri biomass using the lme4 package v. 1.1-32 (Bates et al. Reference Bates, Mächler, Bolker and Walker2015) with the Satterthwaite approximation for degrees of freedom (Kuznetsova et al. Reference Kuznetsova, Brockhoff and Christensen2017). Temperature and biotype were treated as fixed effects, while experimental run was treated as a random effect. Square-root transformation was performed on the NTC A. palmeri biomass to meet the normality assumption. ANOVA was performed followed by Tukey’s pairwise comparisons (α = 0.05) using the emmeans package v. 1.8.8 (Lenth Reference Lenth2023) to determine whether there were significant differences in A. palmeri biomass based on temperature within each biotype.
For the competition study, robust estimation of linear mixed-effects models were fit to determine the effects of temperature, biotype, and density on corn and A. palmeri biomass using the robustlmm package v. 3.3.1 (Koller Reference Koller2016). For corn, the response variable was biomass per pot (equivalent to biomass per plant, because there was one plant per pot). For A. palmeri, the response variables were total biomass per pot or biomass per plant (i.e., total biomass divided by the number of A. palmeri plants in the pot). For all models, temperature, biotype, density, and their interactions were treated as fixed effects, while run of the experiment was treated as a random effect. We did not include growth chamber explicitly as a random effect (chambers were reassigned to different temperature treatments for the second run). The usefulness of run as a random effect was evaluated using VarCorr (lme4) and ranova (lmerTest package v. 3.1.3; Kuznetsova et al. Reference Kuznetsova, Brockhoff and Christensen2017) on the analogous linear mixed-effects models. Log transformations were performed on the A. palmeri data to meet the normality assumption. Post hoc comparisons were performed using estimated marginal means with Tukey P-value adjustment. Figures showing means and standard errors of raw data were created using ggplot2 package v. 3.5.1 (Wickham Reference Wickham2016) and ggpubr package v. 0.6.0. (Kassambara Reference Kassambara2023).
Results and Discussion
Early Responses of Amaranthus palmeri to Temperature and Glyphosate Exposure
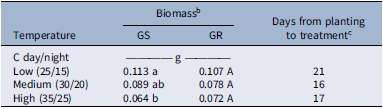
The GS and GR A. palmeri biotypes exhibited similar early development, reaching the 2- to 4-leaf stage at 16 to 21 days after planting. Biomass at this stage ranged from 0.064 to 0.113 g for the GS biotype and from 0.072 to 0.107 g for the GR biotype (Table 1).
Mean biomass of untreated glyphosate-susceptible (GS) and glyphosate-resistant (GR) Amaranthus palmeri biotypes at 14 d after treatment under different temperature regimes a

Table 1. Long description
A table comparing biomass of glyphosate-susceptible and glyphosate-resistant Amaranthus palmeri biotypes under different temperature regimes. The table has four rows and three columns. The columns are labeled Temperature, Biomass, and Days from planting to treatment. The Temperature column lists three temperature regimes: Low (25/15), Medium (30/20), and High (35/25). The Biomass column is further divided into GS and GR biotypes. The Days from planting to treatment column lists the number of days it took for the biotypes to reach the 2- to 4-leaf stage. Row 1: Low (25/15), GS: 0.113, GR: 0.107, 21 days. Row 2: Medium (30/20), GS: 0.089, GR: 0.078, 16 days. Row 3: High (35/25), GS: 0.064, GR: 0.072, 17 days.
a Abbreviations: GS, glyphosate-susceptible biotype from Keith County, NE; GR, glyphosate-resistant biotype from Steuben County, NY.
b Means within A. palmeri biotypes. Different letters indicate significantly different biomass (P < 0.05) based on Tukey’s post hoc analysis of a linear mixed model.
c Treatment occurred when plants reached the 2- to 4-leaf stage; however, data in the table are from the treatment level that did not receive a glyphosate application (nontreated control).
Temperature effects on nontreated plants (no glyphosate application) were generally modest. Biomass of the nontreated GR biotype did not differ significantly among temperature regimes, although a trend toward reduced biomass with increasing temperature was observed. Similarly, the nontreated GS biotype produced greater biomass under the lowest temperature regime (25/15 C) than the highest temperature regime (35/25 C). At 14 DAT, GS plants grown at 35/25 C accumulated 56% less biomass than those grown at 25/15 C (Table 1).
Overall, these results do not support our hypothesis that increased temperature enhances the early growth of these A. palmeri biotypes. Our results contrast with several earlier studies reporting increased A. palmeri growth and performance under warmer conditions. For example, Ehleringer (Reference Ehleringer1983) showed that A. palmeri reached peak photosynthetic capacity at leaf temperatures near 42 C, while Wright et al. (Reference Wright, Coble, Raper and Rufty1999) reported more than a 400% increase in biomass 14 DAT when temperatures increased from 26/22 C to 34/30 C. Similarly, Guo and Al-Khatib (Reference Guo and Al-Khatib2003) observed significantly greater biomass accumulation at 35/30 C and 25/20 C compared with 15/10 C. In contrast, de Souza Rodrigues et al. (Reference Souza Rodrigues, Shilling, Tishchenko, Bowen, Deng, Hall and Grey2023) found that temperature did not significantly affect early A. palmeri growth regardless of glyphosate-resistance status, which aligns more closely with our findings.
The reduced biomass observed at higher temperatures in the present study is unrelated to herbicide treatments, because this finding was observed among nontreated plants. It is also unlikely to be explained by drought stress, given frequent irrigation (once to twice daily), although soil moisture was not directly monitored. Amaranthus palmeri is generally well adapted to drought conditions (Ehleringer Reference Ehleringer1983; Ward et al. Reference Ward, Webster and Steckel2013). It is possible that plants were nutrient limited, yet visible symptoms of nutrient limitation were not observed in any temperature treatment. An alternative explanation is population-specific thermal adaptation. Because the GS biotype originated from Nebraska, it may possess a lower optimal temperature than populations from the southern United States, where A. palmeri is most problematic and from which plant material was sourced in previous studies (Utah, North Carolina, Kansas, and Georgia). We do not know how long the GS population had been present in Nebraska before seed collection for this study or how long the GR population had been present in New York. We also do not know what conditions the mother plants experienced, which could impact seedling vigor through maternal effects (Matzrafi et al. Reference Matzrafi, Osipitan, Ohadi and Mesgaran2021).
Across temperatures, biomass of nontreated A. palmeri did not differ between GR and GS biotypes at 14 DAT (P = 0.744). This result is consistent with prior reports indicating minimal or no fitness penalty associated with EPSPS amplification, the mechanism for glyphosate resistance in U.S. A. palmeri biotypes (Giacomini et al. Reference Giacomini, Westra and Ward2014; Vila-Aiub et al. Reference Vila-Aiub, Goh, Gaines, Han, Busi, Yu and Powles2014). In some cases, apparent differences between GR and GS biotypes may be explained by differences in the selection pressures imposed upon these biotypes or differences in the cropping systems in which these biotypes occur, rather than direct consequences of the evolution of glyphosate resistance (Bravo et al. Reference Bravo, Leon, Ferrell, Mulvaney and Wood2017). However, contrasting evidence from a field study in cotton (Gossypium hirsutum L.) showed reduced biomass and seed production in GR plants compared with GS plants (Cahoon et al. Reference Cahoon, Jordan, Tranel, York, Riggins, Seagroves, Inman, Everman and Leon2022). We emphasize that our study did not directly test for a fitness cost. Such studies require careful control of genetic background (Giacomini et al. Reference Giacomini, Westra and Ward2014; Vila-Aiub et al. Reference Vila-Aiub, Neve and Powles2009, Reference Vila-Aiub, Neve and Roux2011), which was not possible here, because GS A. palmeri biotypes had not been identified in New York State at the time of the study. Our study is a comparison of two geographically distinct biotypes under controlled conditions as opposed to a direct test of resistance-associated biological differences between the tested biotypes.
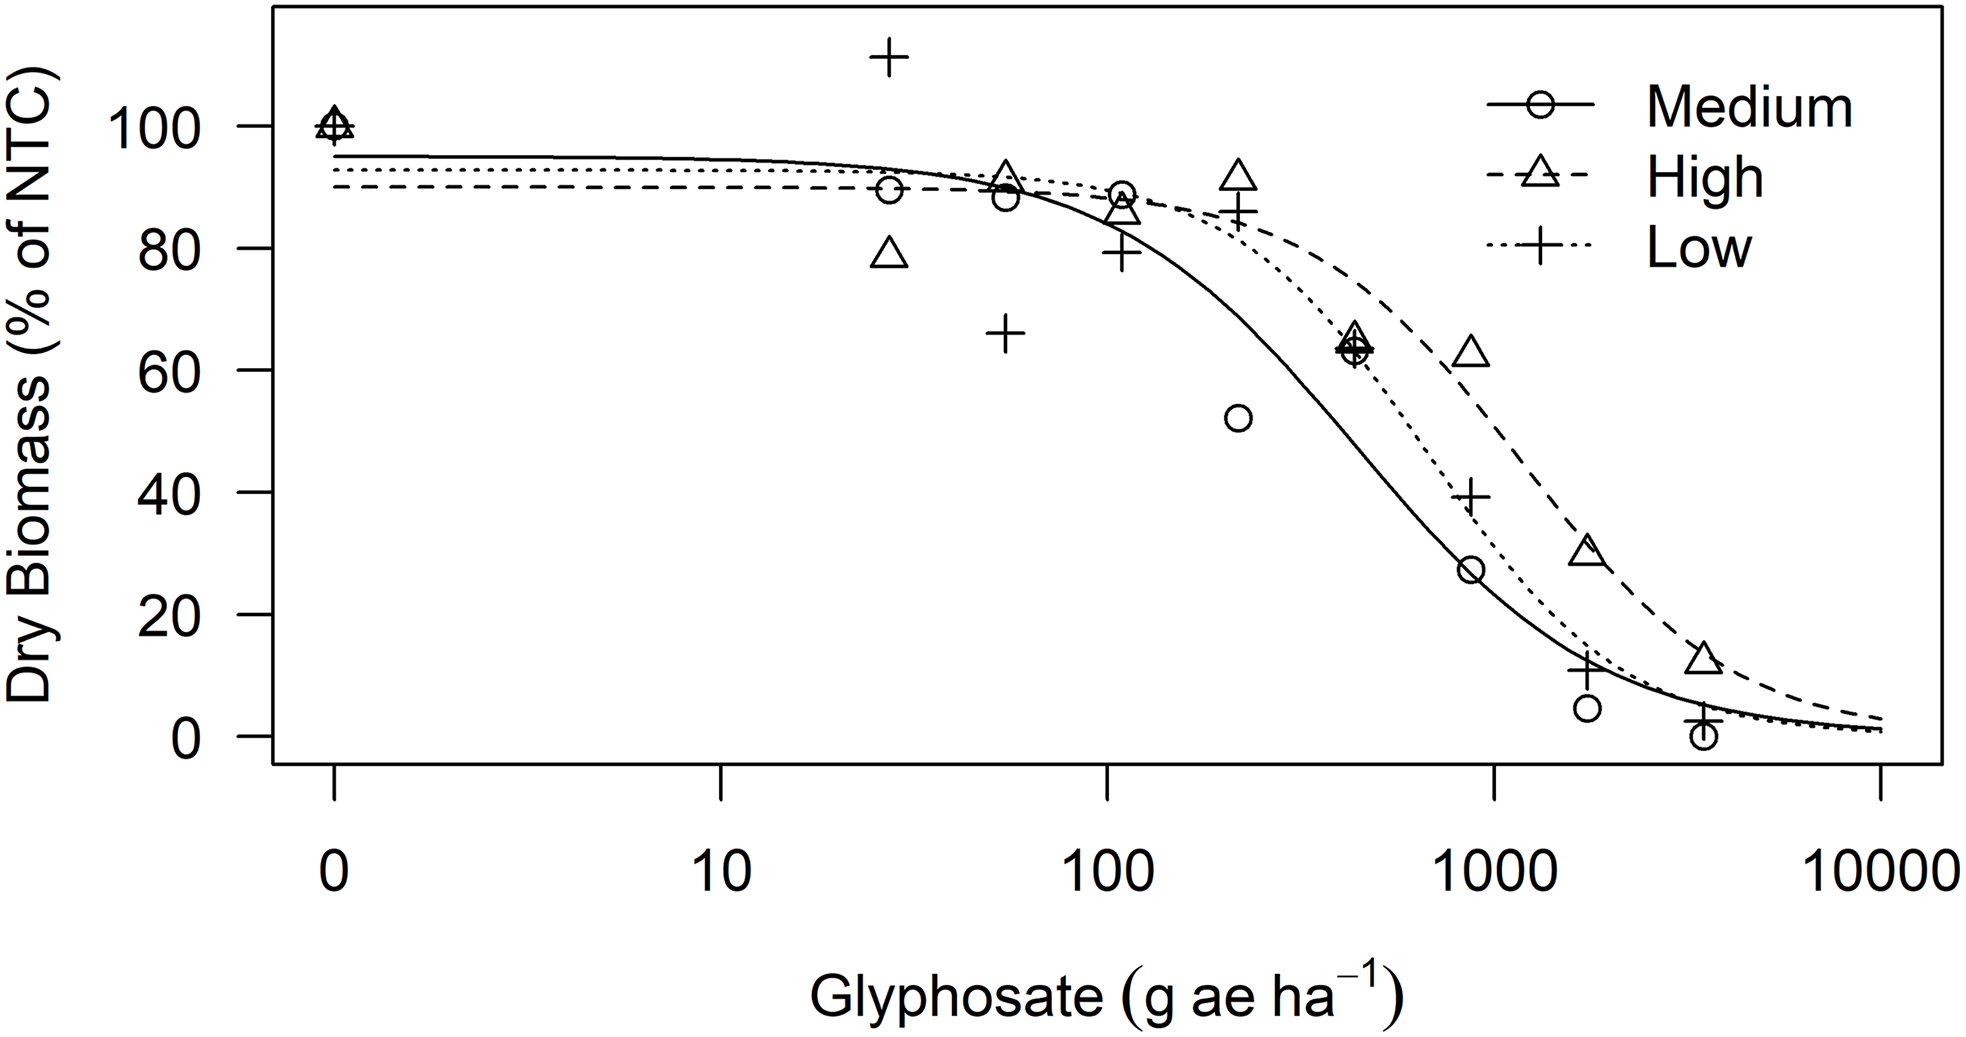
Dose–response curves could not be fit to the GS data due to this biotype’s high sensitivity to glyphosate. Application of glyphosate at 27.2 g ha⁻1 (1/32 of the field-recommended rate of 870 g ha⁻1) resulted in 100% biomass reduction at 14 DAT (data not shown). At the 870 g ha−1 rate, plant biomass from the GR biotype was reduced by 61% to 73% compared with the NTC, depending on the chamber temperature (Figure 1). The dose of glyphosate required to reduce the aboveground biomass of the GR biotype by 50% (ED50) was 673 g ha−1 at 25/15 C, 439 g ha−1 at 30/20 C, and 1,178 g ha−1 at 35/25 C (Table 2). The ED50 value of the medium-temperature treatment (439 g ha−1) was significantly lower than that of the high-temperature treatment (1,178 g ha−1); however, no other contrasts were significantly different. Although applications were standardized by leaf stage, there may have been slight differences in plant size at application among temperature treatments, which could have contributed to variability in plant response to glyphosate.
Dose–response curves of a glyphosate-resistant New York Amaranthus palmeri biotype under different temperature regimes (low, 25/15 C; medium, 30/20 C; high, 35/25 C) showing percent biomass at 14 d after treatment (DAT). Percent biomass was calculated with the following equation:
 ${\rm{Percent}}\;{\rm{biomass}} = {{{\rm{DBEU}}} \over {\underline {{\rm{DBNTC}}} }} \times \;100$
, where DBEU represents the biomass of the experimental unit and DBNTC represents the mean biomass of 10 nontreated control replicates (NTC, no herbicide application). The glyphosate-susceptible Nebraska A. palmeri population was completely killed at the lowest dose tested.

Estimation of regression parameters and glyphosate dose required for 50% (ED50) and 90% (ED90) reduction in the biomass of the glyphosate-resistant (GR) Amaranthus palmeri biotype 14 d after treatment under different temperature regimes a

Table 2. Long description
A table comparing glyphosate dose and temperature effects on biomass reduction in Amaranthus palmeri. The table has four rows and five columns. The columns are labeled Temperature, Regression parameters b, Regression parameters d, ED50, and ED90. The row labels are Low (25/15), Medium (30/20), and High (35/25). The values in the table are as follows: Row 1: Low (25/15), 1.74, 2,388.48, 92.80 (±6.62), 673.34 (±150.81). Row 2: Medium (30/20), 1.37 (±0.39), 95.02 (±7.69), 439.39 (±121.55), 2,182.54 (±849.05). Row 3: High (35/25), 1.58 (±0.53), 4,712.49, 89.99 (±5.75), 1,178.28 (±263.15). The table shows the regression parameters and the glyphosate dose required for 50% (ED50) and 90% (ED90) reduction in the biomass of the glyphosate-resistant (GR) Amaranthus palmeri biotype 14 days after treatment under different temperature regimes.
a Abbreviations: ED50, the effective dose of glyphosate required to reduce biomass relative to the nontreated control (NTC) by 50%; ED90, the effective dose of glyphosate required to reduce biomass relative to the NTC by 90%.
b
Regression parameters were estimated using a three-parameter log-logistic model,
 $Y = \;{d \over {1 + {\rm{exp}}\;\left[ {b\left( {{\rm{log}}\; x - {\rm{log}}\; e} \right)} \right]}}$
, where b represents the slope of the curve at the inflection point, d represents the upper limit, and e represents the dose of glyphosate needed to cause 50% biomass reduction (ED50) compared with the NTC without herbicide application.
Although temperature has been shown to affect glyphosate sensitivity in other weed species, the resistance of those weed species is typically due to non–target site resistance mechanisms (NTSR) rather than the target-site mechanism found in our GR biotype (Guo et al. Reference Guo, Zhang, Wang, Zhang and Tian2023; Nguyen et al. Reference Nguyen, Malone, Boutsalis, Shirley and Preston2016). In slim amaranth (Amaranthus patulus Bertol.; syn.: Amaranthus hybridus L.), glyphosate provided more control at a constant temperature of 25 C or 35 C compared with 30 C (Park et al. Reference Park, Lee and Kuk2021); however, the authors did not discuss the mechanism of resistance for this species. Kaundun et al. (Reference Kaundun, Jackson, Hutchings, Galloway, Marchegiani, Howell, Carlin, Mcindoe, Tuesca and Moreno2019) found that more GR A. palmeri plants from Argentina survived exposure to glyphosate when grown at 30/26 C compared with 20/16 C. In this case, glyphosate resistance was conferred by a Pro-106-Ser target-site mutation in addition to EPSPS overexpression, two target-site resistance mechanisms (Kaundun et al. Reference Kaundun, Jackson, Hutchings, Galloway, Marchegiani, Howell, Carlin, Mcindoe, Tuesca and Moreno2019). For U.S. A. palmeri biotypes treated with herbicides other than glyphosate, temperature can impact herbicide efficacy, although the effects seem limited to NTSR mechanisms. Examples include A. palmeri treated with mesotrione (WSSA Group 27) or 2,4-D (WSSA Group 4) (Godar et al. Reference Godar, Varanasi, Nakka, Prasad, Thompson and Mithila2015; Rudell et al. Reference Rudell, Aarthy, Shyam, Borgato, Kaur and Jugulam2023).
Impact of Amaranthus palmeri Biotype and Temperature on Weed–Crop Competition
Temperature, weed biotype, weed density, and their interactions did not significantly affect corn biomass (Figure 2). The aboveground biomass of corn grown in the absence of A. palmeri ranged from 22.1 ± 1.6 g (Run 2 at 35/25 C) to 45.8 ± 6.4 g (Run 2 at 30/20 C). The aboveground biomass of corn grown in competition with A. palmeri ranged from 18.2 ± 1.5 g (Run 1 at 30/20 C, 4 GR A. palmeri) to 45.5 ± 3.5 g (Run 2 at 30/20 C, 1 GS A. palmeri).
Effects of growth chamber temperature, Amaranthus palmeri biotype (R, glyphosate resistant; S, glyphosate susceptible), and number of A. palmeri plants (1, 2, or 4) on corn biomass per pot after 6 wk. One corn plant was grown in each pot. NTC (nontreated control) indicates corn grown without A. palmeri. Variability between runs contributed to the lack of statistical significance. n = 9.

Figure 2. Long description
Panel A: A bar graph showing the effects of growth chamber temperature, Amaranthus palmeri biotype, and number of A. palmeri plants on corn biomass per pot after 6 weeks for Run 1. The horizontal axis represents different treatments: NTC, 1PR, 1PS, 2PR, 2PS, 4PR, and 4PS. The vertical axis represents the mean corn biomass per pot in grams, ranging from 0 to 50. The graph is grouped into three temperature conditions: 25/15 C, 30/20 C, and 35/25 C. Each treatment is represented by a different color: gray for NTC, orange for 1PR, blue for 1PS, green for 2PR, yellow for 2PS, teal for 4PR, and red for 4PS. The bars show the mean corn biomass per pot with error bars indicating variability. Panel B: A bar graph showing the effects of growth chamber temperature, Amaranthus palmeri biotype, and number of A. palmeri plants on corn biomass per pot after 6 weeks for Run 2. The horizontal axis represents different treatments: NTC, 1PR, 1PS, 2PR, 2PS, 4PR, and 4PS. The vertical axis represents the mean corn biomass per pot in grams, ranging from 0 to 50. The graph is grouped into three temperature conditions: 25/15 C, 30/20 C, and 35/25 C. Each treatment is represented by a different color: gray for NTC, orange for 1PR, blue for 1PS, green for 2PR, yellow for 2PS, teal for 4PR, and red for 4PS. The bars show the mean corn biomass per pot with error bars indicating variability.
Contrary to our hypothesis, we found no evidence that the tested A. palmeri biotypes had more deleterious effects on corn under elevated temperatures. In fact, the numerical trend was the opposite. Our expectation that increasing densities of A. palmeri would reduce corn biomass was also not supported (Figure 2). The lack of a significant relationship here may reflect variability in corn biomass between runs. Multiple factors could contribute to this variability, including small differences in chamber microclimate (e.g., chamber opening frequency or vapor-pressure deficit), corn seed vigor (e.g., emergence timing), soil characteristics (e.g., soil packing density or nutrient leaching rate), or watering (e.g., slight differences in watering timing or edge effects for watering rate). Because corn responds strongly to minor variation in resource availability and exhibits strong and asymmetric intraspecific competition when grown at high density in growth chambers, these factors might have had a greater impact on the corn plants than the tested A. palmeri biotypes.
Amaranthus palmeri density had highly significant impacts on corn biomass when the 25/15 C regime was considered alone or when temperature was excluded as a fixed effect from the overall model (statistical analysis not shown because this comparison was not preplanned). This observation suggests some weed–crop competition for resources, consistent with existing evidence that A. palmeri competition threatens corn cropping systems under current and future climates (Kistner and Hatfield Reference Kistner and Hatfield2018; Massinga et al. Reference Massinga, Currie, Horak and Boyer2001; Ward et al. Reference Ward, Webster and Steckel2013). For example, A. palmeri densities from 0.5 to 8 plants m–1 of row reduced corn yield by 11% to 91% (Massinga et al. Reference Massinga, Currie, Horak and Boyer2001).
The total aboveground biomass of A. palmeri per pot ranged from 0.15 ± 0.06 g (Run 1 at 35/25 C, 1 GR A. palmeri) to 4.6 ± 0.5 g (Run 1 at 25/15 C, 4 GS A. palmeri). Increasing temperature reduced A. palmeri biomass (P < 0.001). Total biomass per pot was greater than 1.0 g for all 25/15 C treatments and less than 1.2 g for all 35/25 C treatments (Figure 3). The GS biotype had somewhat higher biomass (mean 1.4 ± 0.1 compared with 1.05 ± 0.07, P = 0.05). There were no impacts of weed density or interactions on total A. palmeri biomass per pot.
Effects of growth chamber temperature, Amaranthus palmeri biotype (R, glyphosate-resistant; S, glyphosate-susceptible), and number of A. palmeri plants (1, 2, or 4) on total A. palmeri biomass per pot after 6 wk. n = 9.

Figure 3 Long description
Panel A: A bar graph showing the effects of growth chamber temperature, Amaranthus palmeri biotype, and number of plants on total biomass per pot after 6 weeks for Run 1. The horizontal axis represents the treatment with labels 1PR, 1PS, 2PR, 2PS, 4PR, and 4PS. The vertical axis represents the mean Amaranthus palmeri biomass per pot in grams. The graph is divided into three temperature conditions: 25/15 C, 30/20 C, and 35/25 C. Each treatment is represented by a different color: yellow for 1PR, light blue for 1PS, green for 2PR, light green for 2PS, dark blue for 4PR, and orange for 4PS. The bars show the mean biomass with error bars indicating variability. Notable trends include higher biomass at 25/15 C for treatments 1PS, 2PR, 2PS, and 4PS, with the highest biomass observed in the 4PS treatment. At 30/20 C and 35/25 C, the biomass is generally lower across all treatments. Panel B: A bar graph showing the effects of growth chamber temperature, Amaranthus palmeri biotype, and number of plants on total biomass per pot after 6 weeks for Run 2. The horizontal axis represents the treatment with labels 1PR, 1PS, 2PR, 2PS, 4PR, and 4PS. The vertical axis represents the mean Amaranthus palmeri biomass per pot in grams. The graph is divided into three temperature conditions: 25/15 C, 30/20 C, and 35/25 C. Each treatment is represented by a different color: yellow for 1PR, light blue for 1PS, green for 2PR, light green for 2PS, dark blue for 4PR, and orange for 4PS. The bars show the mean biomass with error bars indicating variability. Notable trends include higher biomass at 25/15 C for treatments 1PS, 2PR, 2PS, and 4PS, with the highest biomass observed in the 4PS treatment. At 30/20 C and 35/25 C, the biomass is generally lower across all treatments.
The mean biomass of individual A. palmeri plants ranged from 0.15 ± 0.06 g (Run 1 at 35/25 C, 1 GR A. palmeri) to 3.1 ± 0.2 g (Run 1 at 25/15 C, 1 GS A. palmeri). Individual plant biomass depended on temperature (P < 0.001), biotype (P = 0.02), and the interaction between temperature and biotype (P = 0.04). Individual A. palmeri biomass decreased with increasing temperature (Figure 4); however, it was higher with the GS biotype, especially at lower temperatures (25/15 C). Again, there was no significant impact of weed density or interactions with density.
Effects of growth chamber temperature, Amaranthus palmeri biotype (R, glyphosate-resistant; S, glyphosate-susceptible), and number of A. palmeri plants (1, 2, or 4) on mean biomass of individual A. palmeri plants after 6 wk. n = 9.

Figure 4. Long description
Panel A: A bar graph showing the effects of growth chamber temperature, Amaranthus palmeri biotype, and number of plants on mean biomass of individual plants after 6 weeks for Run 1. The horizontal axis represents the treatment with labels 1PR, 1PS, 2PR, 2PS, 4PR, and 4PS. The vertical axis represents the mean Palmer Amaranth biomass per plant in grams. The graph is divided into three temperature conditions: 25/15 C, 30/20 C, and 35/25 C. Each treatment is represented by a different color: yellow for 1PR, blue for 1PS, green for 2PR, light green for 2PS, dark blue for 4PR, and orange for 4PS. The bars show the mean biomass with error bars indicating variability. The highest biomass is observed in the 1PS treatment at 25/15 C, while the lowest biomass is observed in the 4PS treatment at 35/25 C. Panel B: A bar graph showing the effects of growth chamber temperature, Amaranthus palmeri biotype, and number of plants on mean biomass of individual plants after 6 weeks for Run 2. The horizontal axis represents the treatment with labels 1PR, 1PS, 2PR, 2PS, 4PR, and 4PS. The vertical axis represents the mean Palmer Amaranth biomass per plant in grams. The graph is divided into three temperature conditions: 25/15 C, 30/20 C, and 35/25 C. Each treatment is represented by a different color: yellow for 1PR, blue for 1PS, green for 2PR, light green for 2PS, dark blue for 4PR, and orange for 4PS. The bars show the mean biomass with error bars indicating variability. The highest biomass is observed in the 1PS treatment at 25/15 C, while the lowest biomass is observed in the 4PS treatment at 35/25 C.
Based on these findings, our hypothesis that elevated temperatures would increase A. palmeri biomass was not supported. In fact, the biomass of the tested biotypes was highest at lower temperatures (25/15 C). This finding is consistent with our observations from the dose–response study, in which we also found decreasing performance of these A. palmeri biotypes with increasing temperatures. As we suggested earlier, the tested A. palmeri biotypes from Nebraska and New York State could have lower temperature optima than biotypes from the southern United States in which this weed is most troublesome and best characterized.
Unlike the dose–response study, the competition study suggested that the GS biotype outperformed the GR biotype, especially at 25/15 C. The difference between the two studies likely reflects the longer time frame of the competition study. As discussed earlier, we cannot attribute the difference between biotypes to a fitness difference, because we did not control for genetic background or maternal effects. Differences in biomass production between the GR and GS biotypes may be due to factors including seed origin, maternal effects, or other selection pressures as opposed to EPSPS copy number.
Management Implications
This study found that A. palmeri biotypes from Nebraska (GS) and New York State (GR) did not become larger or become more competitive with corn under elevated temperatures in controlled growth chamber environments. Under these conditions, the tested A. palmeri biotypes are able to achieve rapid growth in the presence of corn under a temperature regime similar to current New York State summer temperatures (25/15 C). In recently invaded areas, early detection and rapid response (EDRR) efforts may still help limit its spread.
Previous work has shown that, regardless of resistance status, A. palmeri can be highly competitive under current and projected future climates (Kistner and Hatfield Reference Kistner and Hatfield2018; Massinga et al. Reference Massinga, Currie, Horak and Boyer2001; Ward et al. Reference Ward, Webster and Steckel2013). Growers may need to diversify and intensify their weed management programs to optimize control and minimize severe weed–crop competition. Robust integrated weed management programs, ideally those that emphasize preventative management to minimize introductions and subsequent seedbank contributions, will be crucial for minimizing long-term risk from this troublesome annual weed.
Acknowledgments
We thank Amy Soriano and Nick Van Eck for assistance with growth chambers and Rosa Xia, Ryleigh Coffey, Sky Xu, Letiunasema Nuusila, Matthew Shefter, and Devin Chen for experimental assistance.
Funding statement
This research was funded in part by a Schmittau-Novak Grant from the School of Integrative Plant Science, Cornell University.
Competing interests
The authors declare no conflicts of interest.
 Percentbiomass=DBEUDBNTC_×100



 Open access

