Introduction
In the last decade, the demand to reduce the volume of samples and reagents used in chemical reactions, biological analysis, and medical tests has increased significantly due to the need to reduce reagent consumption, waste production, analysis time, and labor costs. To achieve this, the use of microchips such as microreactors, lab-on-a-chip (LOC) devices, micro-total analysis systems (μ-TAS), and optofluidics has been proposed.Reference Burns, Johnson, Brahmasandra, Handique, Webster, Krishnan, Sammarco, Man, Jones, Heldsinger, Mastrangelo and Burke1, Reference Dittrich, Tachikawa and Manz2 Palm-sized microchips into which an entire room of laboratory equipment can be shrunk and packed into a small space are capable of satisfying this demand. In addition, in order to achieve high efficiency, high accuracy, and high sensitivity analysis, increasingly complex microchips are being fabricated in which microfluidic-based systems are integrated with electrical, mechanical, and optical microcomponents in a single chip.
Currently, the most common technique for fabricating microfluidics is soft lithography, a technique that uses polydimethylsiloxane (PDMS) molds for replicating microstructures.Reference McDonald and Whitesides3 Although soft lithography is fast and cost effective, it cannot be used to directly form three-dimensional (3D) microfluidic structures such as microchannels and microreservoirs in a transparent substrate without stacking and bonding layers. In addition, unlike glass, PDMS is chemically incompatible with many organic solvents, and compositional inhomogeneities frequently cause optical scattering, which is unsuitable for optical sensing in microchips.
For microchips with glass substrates, conventional fabrication employs planar microfabrication techniques, such as injection molding or conventional semiconductor processes based on photolithography, which requires stacking and bonding to construct 3D structures.
Femtosecond laser direct writing is a promising fabrication technique that can be used to modify the interior of glass in a spatially selective manner. It can be used to directly form 3D microfluidic structures within substrates because it employs a nonlinear interaction (i.e., multiphoton absorption) between a tightly focused femtosecond laser beam and glass. This interaction is effectively restricted to the vicinity of the focal point where the laser intensity exceeds the threshold for multiphoton absorption.Reference Davis, Miura, Sugiomto and Hirao4 The femtosecond laser pulses modify the chemical properties of the substrate in the laser-irradiated regions, which can be selectively removed by successive wet etching using acids such as hydrofluoric (HF) acid, realizing direct fabrication of 3D microfluidics.Reference Marcinkevicius, Juodkazis, Watanabe, Miwa, Matsuo, Misawa and Nishii5–Reference Sugioka, Cheng and Midorikawa7 This two-step process (i.e., femtosecond laser direct writing followed by wet etching) can also be used to integrate micromechanical components such as microvalvesReference Masuda, Sugioka, Cheng, Hongo, Shihoyama, Takai, Miyaloto and Midorikawa8 and micropumps.Reference Matsuo, Kiyama, Shichijo, Tomita, Hashimoto, Hosokawa and Masuhara9 It can be further extended to fabricate free-space optics such as micromirrors and micro-optical lenses inside glass.Reference Cheng, Sugioka, Midorikawa, Masuda, Toyoda, Kawachi and Shihoyama10–Reference Wang, Sugioka and Midorikawa12 Additional femtosecond laser direct writing can alter the optical properties of the substrate (e.g., the refractive index and the optical transmissivity) in addition to the chemical properties. For instance, internal refractive index modification has been successfully applied to fabricate a wide range of micro-optical components inside glass materials, including optical waveguides, optical couplers and splitters, volume Bragg gratings, and Fresnel zone plates.Reference Davis, Miura, Sugiomto and Hirao4, Reference Yamada, Watanabe, Toma, Itoh and Nishii13–Reference Sudrie and Winick20 The unique ability of femtosecond laser direct writing to alter both the chemical and optical properties in glass materials opens up a new avenue for fabricating a variety of integrated microchips for biological analysis, such as nanoaquariums for determining the functions of living microorganismsReference Hanada, Sugioka, Kawano, Ishikawa, Miyawaki and Midorikawa21, Reference Hanada, Sugioka, Ishikawa, Kawano, Miyawaki and Midorikawa22 and optofluidic sensors possessing various functionalities for monitoring the concentrations of liquid samples,Reference Crespi, Gu, Ngamsom, Hoekstra, Dongre, Pollnau, Ramponi, van den Vlekkert, Watts, Cerullo and Osellame23 detecting and manipulating single cells,Reference Kim, Hwang, Jeon, Hiromatsu and Grigoropoulos24, Reference Bragheri, Ferrara, Bellini, Vishnubhatla, Minzioni, Ramponi, Osellame and Cristiani25 and rapidly screening algae populations.Reference Schaap, Bellouard and Rohrlack26 This article reviews integrated microchips fabricated by femtosecond laser direct writing for biological analysis applications.
Fabrication of 3D microfluidic structures inside glass
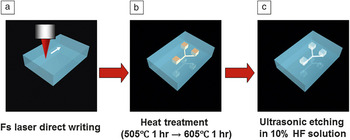
The first demonstration of femtosecond laser direct writing for fabricating embedded 3D microfluidic structures was performed using photosensitive glass.Reference Kondo, Qiu, Mitsuyu, Hirao and Yoko27 The photosensitive glass was developed by Stookey at Corning Inc. for surface microstructuring using ultraviolet (UV) light.Reference Stookey28 One of the most widely used commercial photosensitive glasses is manufactured by Schott Glass Corporation and is sold under the trade name of Foturan.29 It consists of lithium aluminosilicate glass doped with trace amounts of silver and cerium. The cerium ion (Ce3+) plays an important role as a photosensitizer, releasing an electron on exposure to UV light and becoming Ce4+. It is not necessary to dope glasses with Ce3+ or other photosensitizers when using femtosecond laser pulses since they induce multiphoton absorption, which generates free electrons by interband excitation. More specifically, three-photon absorption induced by femtosecond laser pulses with a near-infrared wavelength (∼800 nm) excites electrons from the valence band to defect levels formed by impurities and native defects in the photosensitive glass. Electrons trapped by the defect levels are subsequently further excited to the conduction band by additional three-photon absorption. This two-step excitation thus generates free electrons.Reference Hongo, Sugioka, Niino, Cheng, Masuda, Miyamoto, Takai and Midorikawa30–Reference Fisette, Busque, Degorce and Meunier32Figure 1 depicts the procedure used to fabricate 3D microfluidic structures inside photosensitive glass. (1) Free electrons are generated in laser-irradiated regions (even those inside the photosensitive glass) by two-step multiphoton excitation, as described previously. The free electrons then reduce some of the silver ions to silver atoms. (2) Subsequent thermal treatment at about 500°C causes the silver atoms to diffuse and agglomerate into silver nanoclusters with sizes of 8 nm or greater. The thermal treatment temperature is then increased to about 600°C. This causes the crystalline phase of the lithium metasilicate in the amorphous glass matrix to grow near the silver nanoclusters, which act as crystallization nuclei. If silver nanoclusters have a sufficiently high density, the crystalline phases, which are a few micrometers in size, can connect with each other and so form a network. (3) As the crystalline phase of lithium metasilicate is much more soluble in dilute HF than the glass matrix (etching selectivity: ∼50), the laser-irradiated regions are preferentially etched away, resulting in the formation of hollow microstructures inside the glass. Thus, multiphoton absorption of femtosecond laser irradiation can be used to easily fabricate complex 3D microfluidic structures embedded in photosensitive glass. However, HF etching produces rough surfaces in the etched regions, including the internal walls of fabricated microfluidic structures with typical root-mean-square (RMS) roughness of the order of several tens of nanometers. These rough surfaces can be smoothed to give an RMS roughness of less than 1 nm by applying an additional post-annealing step after wet chemical etching.Reference Cheng, Sugioka, Midorikawa, Masuda, Toyoda, Kawachi and Shihoyama10 The post-annealing is performed at 570°C, which is lower than the melting point of photosensitive glass (∼660°C), to prevent deformation of the fabricated microstructures. However, a very thin liquid layer forms on the photosensitive glass surface at this annealing temperature. This liquid layer solidifies to produce a smooth surface due to surface tension.Reference Cheng, Tsai, Sugioka and Midorikawa11 Such smooth surfaces are beneficial for many microfluidic applications and also for fabricating free-space micro-optical components such as micromirrors and microlenses based on hollow microstructures embedded in photosensitive glass.Reference Cheng, Sugioka, Midorikawa, Masuda, Toyoda, Kawachi and Shihoyama10–Reference Wang, Sugioka and Midorikawa12 Since this technique can be used to fabricate both microfluidic and micro-optical components in photosensitive glass, it is straightforward to achieve optofluidic integration (see text later). This technique can also be used to integrate micromechanical components such as microvalves and micropumps into microfluidic systems by a single continuous procedure.Reference Masuda, Sugioka, Cheng, Hongo, Shihoyama, Takai, Miyaloto and Midorikawa8, Reference Matsuo, Kiyama, Shichijo, Tomita, Hashimoto, Hosokawa and Masuhara9
Schematic illustrations of the procedure for fabricating 3D microfluidic structures inside photosensitive glass. (a) 3D latent images are written inside photosensitive glass by femtosecond laser direct writing. (b) Samples are subjected to programmed heat treatment to develop the modified regions. (c) The samples are soaked in an aqueous solution of 10% hydrofluoric (HF) acid in an ultrasonic bath to selectively etch the laser-irradiated regions. Finally, hollow microstructures are formed inside the glass.

Selective HF etching can also be achieved in non-photosensitive glass materials such as fused silica by femtosecond laser irradiation.Reference Marcinkevicius, Juodkazis, Watanabe, Miwa, Matsuo, Misawa and Nishii5 The mechanism that gives rise to etching selectivity probably involves bond breaking and defect formation, which is completely different from that for photosensitive glass. Consequently, post-annealing is not required when fused silica is irradiated by femtosecond laser radiation. Fused silica has several advantages over photosensitive glass for microfluidic chip applications, including superior optical properties (e.g., wide transmission range and low autofluorescence) and high purity. Additionally, Kiyama et al. recently found that the etching selectivity of fused silica can be further enhanced by employing KOH solution as the etchant rather than dilute HF acid.Reference Kiyama, Matsuo, Hashimoto and Morihira33 They fabricated a 1-cm-long through channel with a diameter of less than 60 μm using KOH. Etched fused silica surfaces have similar roughnesses as etched photosensitive glass surfaces. No technique has yet been developed for smoothing etched fused silica surfaces, so fused silica cannot be currently used for applications that require smooth surfaces.
Microchips integrated with optical waveguides
Femtosecond lasers can be used to write optical waveguides in various glasses such as fused silicaReference Davis, Miura, Sugiomto and Hirao4, Reference Eaton, Zhang, Herman, Yoshino, Shah, Bovatse and Arai34 and borosilicate glassReference Eaton, Zhang, Herman, Yoshino, Shah, Bovatse and Arai34, Reference Dharmadhikari, Dharmadhikari, Bhatnagar, Mallik, Singh, Dhaman and Mathur35 by modifying their refractive indices. Written optical waveguides have cores with refractive indices that are 10–4 to 10–2 higher than that of untreated fused silica and with diameters from 2 to 25 μm depending on the writing parameters. An optical waveguide fabricated in fused silica was found to have a propagation loss as low as ∼0.2 dB/cm at a wavelength of 633 nm.Reference Zhang, Eaton and Herman36
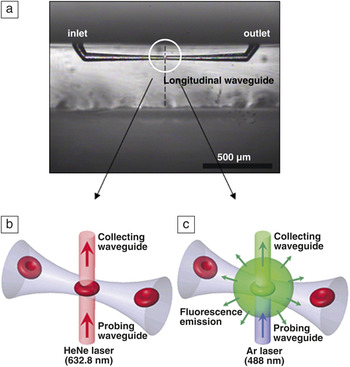
Optofluidic chips are microfludics integrated with micro-optical components for optical sensing of biomaterials. At present, such chips fabricated by femtosecond laser direct writing consist of microfluidic channels integrated with optical waveguides. Optical waveguides oriented at right angles to microfluidic channels offer various functions and can be used as illumination sources and detectors for detecting transmitted, scattered, and fluorescent light.Reference Crespi, Gu, Ngamsom, Hoekstra, Dongre, Pollnau, Ramponi, van den Vlekkert, Watts, Cerullo and Osellame23, Reference Kim, Hwang, Jeon, Hiromatsu and Grigoropoulos24, Reference Schaap, Bellouard and Rohrlack26, Reference Bellouard, Said, Dugan and Bado37–Reference Applegate, Squier, Vestad, Oakey, Marr, Bado, Dugan and Said40Figure 2a shows an optical transmission image of one such integrated optofluidic device for single-cell detection.Reference Kim, Hwang, Jeon, Hiromatsu and Grigoropoulos24 The microfluidic channel in this system was first fabricated in fused silica using the technique described earlier. A longitudinal optical waveguide was then written normal to the top surface of the glass substrate, perpendicularly intersecting the prefabricated microchannel formed by femtosecond laser direct writing. The diameter of the microchannel at the point where it intersected the optical waveguide could be varied between 5 and 100 μm by adjusting the etching time and the laser scanning parameters. The dashed line in Figure 2a indicates the position of the written optical waveguide. The fabricated optofluidic system was used to detect single red blood cells (RBCs) in diluted human blood (see Figure 2b–c). Figure 2b schematically illustrates the passive optical detection setup used to measure the transmitted light intensity, and Figure 2c schematically depicts fluorescence emission detection. The former approach involves sensing the intensity change of a waveguide-delivered He–Ne laser light (632.8 nm) induced by the refractive index difference caused by a cell flowing in the channel, whereas the latter approach involves detecting fluorescence emission from a dyed RBC excited by Ar laser light (488 nm) delivered by the optical waveguide. Use of microchannels with 5-μm-diameter necks (i.e., the microchannel diameter at the point where they intersect the optical waveguides), which is slightly smaller than the size of a RBC (6–8 μm), enabled a sharp, constant, and unambiguous signal for cell detection in both detection schemes because the small neck diameter of the tapered channel maintains a uniform detection configuration for all cells. The fabricated optofluidic system could detect up to 23 particles per second without becoming clogged; the particle counting efficiency depends on the particle concentration, the flow rate, the ratio of particle size to microchannel neck diameter, and the microchannel shape.
(a) Optical transmission image of an integrated optofluidic device fabricated for detecting single cells. The dashed line indicates the location where the integrated longitudinal waveguide was drawn. (b) Schematic illustration of cell detection experiment using transmission intensity change. (c) Schematic illustration of cell detection experiment using fluorescence emission. (Reproduced with permission from Reference Reference Kim, Hwang, Jeon, Hiromatsu and Grigoropoulos24. ©2009, Royal Society of Chemistry.)

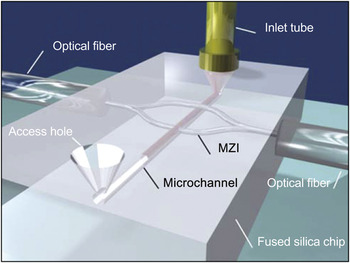
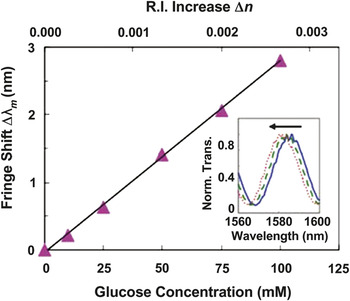
Waveguides can be used for constructing an unbalanced Mach–Zehnder interferometer (MZI) for label-free, spatially selective sensing of liquid samples in microfluidic systems based on a small refractive index changeReference Crespi, Gu, Ngamsom, Hoekstra, Dongre, Pollnau, Ramponi, van den Vlekkert, Watts, Cerullo and Osellame23 (see Figure 3). An optofluidic system made of fused silica consisted of a microchannel integrated with an unbalanced MZI with the sensing arm orthogonally intersecting the channel and the reference arm passing over it. This device is capable of refractive index sensing with a spatial resolution on the order of the waveguide mode diameter (11 μm). The two arms lie in a plane tilted with respect to the substrate surface such that the reference arm is above the microchannel, and the sensing arm and the microchannel intersect at right angles. Since the MZI and the microchannel are not coplanar, such a 3D microdevice cannot be fabricated by conventional lithographic techniques due to their intrinsically planar nature. The unbalanced MZI can detect fringes in the wavelength-dependent transmission when a sufficiently wide spectral region is scanned using a tunable laser. The refractive index varies slightly with the analyte concentration, and this variation can be detected by a shift in the fringes (see Figure 4). The microchannel of the microchip in Figure 3 was filled with glucose solutions of various concentrations as test samples, and its sensitivity was determined to be 10–4 refractive index units, which corresponds to a detection limit of 4 mM (see Figure 4). Further improvement of the sensitivity and detection limit is anticipated by reducing temperature fluctuations in the microfluidic channel, which is the major cause of fluctuations in the refractive index of the analyte in the current experiments.
Schematic illustration of femtosecond-laser-fabricated microfluidic channel and integrated Mach–Zehnder interferometer (MZI) for label-free and spatially selective sensing. The sensing arm crosses the channel orthogonally, whereas the reference arm passes over it. (Reproduced with permission from Reference Reference Crespi, Gu, Ngamsom, Hoekstra, Dongre, Pollnau, Ramponi, van den Vlekkert, Watts, Cerullo and Osellame23. ©2010, Royal Society of Chemistry.)

Fringe shift for water with different glucose-D concentrations (in inset, solid line: 0 mM; dashed line: 50 mM; dotted line: 100 mM) measured by optofluidic system with an unbalanced Mach–Zehnder interferometer. The top axis indicates the corresponding refractive index change. (Reproduced with permission from Reference Reference Crespi, Gu, Ngamsom, Hoekstra, Dongre, Pollnau, Ramponi, van den Vlekkert, Watts, Cerullo and Osellame23. ©2010, Royal Society of Chemistry.)

Microchips integrated with microlenses and optical waveguides
As described previously, free-space micro-optical components can be fabricated inside photosensitive glass. Integration of microfluidics with microlenses and optical waveguides was demonstrated for fabricating high-sensitivity optofluidic devices.Reference Wang, Sugioka and Midorikawa41, Reference Sugioka, Hanada and Midorikawa42 In the fabrication of optofluidic devices, latent images of the microlenses were first written. A latent image of the microchamber was then written near the microlenses in the same glass chip by continuous femtosecond laser direct writing. Two microcomponents (i.e., the microfluidic chamber and microlenses) were integrated in the glass chip by a continuous procedure involving heat treatment, wet etching, and additional heat treatment of the laser-irradiated sample. This procedure has the significant advantage of eliminating the need to align each microcomponent as is the case for conventional methods such as injection molding or conventional semiconductor processes based on photolithography. Optical waveguides were then successively written inside the identical glass chip by femtosecond-laser-induced refractive index change. Neither heat treatment nor wet etching was applied to the glass sample after waveguide writing.
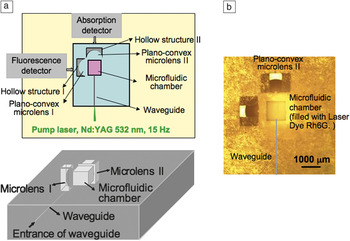
Figure 5a shows 2D and 3D schematic illustrations of the 3D integrated microchip for photonic biosensing in which a 6-mm-long waveguide is connected to a 1.0 × 1.0 × 1.0 mm3 microfluidic chamber and two microlenses with a radius of curvature of 0.75 mm, one for fluorescence measurements (on the left-hand side of Figure 5a) and one on the opposite side from the optical waveguide at a distance of 300 μm from the microchamber for absorption measurements. Figure 5b shows an optical micrograph of the fabricated optofluidic device.
(a) 2D and 3D schematic configurations and (b) optical microscope image of an optofluidic system in which two plano-convex lenses and an optical waveguide are integrated with a microfluidic chamber in a single glass chip. The solid gray line in (b) indicates the location of the waveguides in the glass.

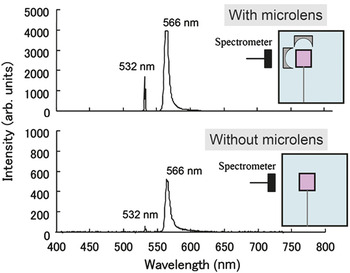
For demonstration of fluorescence analysis of a liquid sample, the microfluidic chamber was filled with a solution of the laser dye rhodamine 6G (Rh6G) in ethanol (0.02 mol/L). The pump laser beam had a frequency of 2 ω (532 nm) from an Nd:YAG laser; it was guided by the optical waveguide and introduced into the microfluidic chamber. The emission spectrum of Rh6G was obtained using the detector after plano-convex microlens I. The spectrometer probe was placed at the end of the glass chip (i.e., behind microlens I) to detect the fluorescence. Figure 6 shows a typical emission spectrum with a central wavelength of 566 nm (the peak at 532 nm is from the pump laser), which corresponds to the maximum emission of Rh6G. For comparison, the emission measurement was also performed using a microchip integrated with a waveguide but without a microlens. The results clearly show that an enhanced emission intensity was obtained when the micro-optical plano-convex lens was used to collect the fluorescence; Figure 6 shows that the detected light intensity was enhanced by a factor of eight. Furthermore, optical absorption analysis of a liquid sample through plano-convex microlens II was demonstrated. The sensitivity of the microchip with the microlens was enhanced by a factor of three relative to that of the microchip without a microlens.
Emission spectra from laser dye Rh6G pumped by 2 ω of a Nd:YAG laser. Images were obtained using microchips (top) with and (bottom) without a microlens.

Nanoaquariums for determining the functions of microorganisms
Femtosecond laser direct writing of photosensitive glass can be used to rapidly fabricate a wide variety of structures with smooth surfaces. This ability to rapidly fabricate various microchips with different structures and functions is beneficial for determining the functions of different kinds of microorganisms.Reference Yamahata, Vandevyver, Lacharme, Izewska, Vogel, Freitag and Gijs43–Reference Haeberle and Zengerle45 A large variety of organisms and bacteria live on the Earth. Of these, aquatic microorganisms have existed for more than 500 million years; their shapes have changed little during this time. Some of these microorganisms can move very rapidly, which is unusual on a macroscopic scale, and they exhibit unique 3D movement that can oppose gravity. Most of these microorganisms are single celled. It is very important to investigate their dynamic movement and physiological energy generation mechanisms to understand the functions of single cells that make up complex organisms such as humans. Consequently, cell biologists are currently seeking to observe and to determine the functions of microorganisms.
Cell biologists commonly use optical microscopes coupled with high-speed cameras to observe microorganisms.Reference Okano, Hunter and Fusetani46–Reference Stephens and Allan49 Conventional observation systems generally use a glass slide with a coverslip or a Petri dish. However, the high numerical aperture objective lenses typically used for observations limit both the field of view and the depth of focus to several hundred micrometers, making it difficult and time consuming to obtain clear images of moving microorganisms. Biologists urgently need to reduce observation times not only to reduce the cost and time involved, but also due to limited computer memory, which becomes problematic when acquiring movies using high-speed cameras.
To overcome these problems, we proposed using microchips with 3D microfluidic structures to observe microorganisms. Microchips reduce the observation area because they confine microorganisms to a limited volume, while still providing sufficient space for microorganisms to move freely. This makes it much easier to capture images of their movement. Furthermore, such microfluidic systems encapsulated in microchips allow microorganisms to remain active for a long time, since little or no evaporation or leakage of water occurs. Additionally, other functional microcomponents such as micro-optical and micromechanical components can be easily integrated with microfluidic systems, which enables functional analysis to be performed to determine the functions of microorganisms. We have termed such microchips for determining the functions of microorganisms as nanoaquariums.Reference Hanada, Sugioka, Kawano, Ishikawa, Miyawaki and Midorikawa21, Reference Hanada, Sugioka, Ishikawa, Kawano, Miyawaki and Midorikawa22 This section describes two examples of using nanoaquariums to determine the functions of microorganisms.
Nanoaquariums for dynamic observation of Euglena gracilis
Euglena gracilis is a single-celled organism that lives in fresh water. It has a flagellum at its anterior end, which it whips rapidly to swim in water. Many biologists have used microscopes to investigate the continuous movement of the flagellum to study biomotor applications in biology and ultimately to determine the origin of this functionality. However, only the thrusting movement of the flagellum has been investigated;Reference Nichols and Rikmenspoel50, Reference Nichols and Rikmenspoel51 its detailed mechanism is still unknown due to the difficulties in capturing images of the rapid continuous movement of the flagellum.
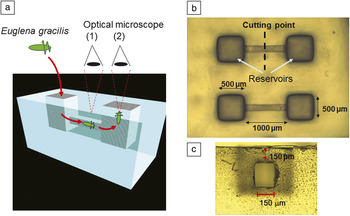
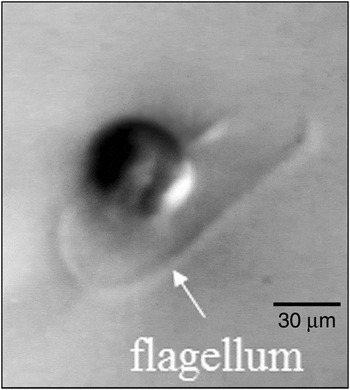
To clearly and efficiently observe flagellum movement, we fabricated a microchannel encapsulated in photosensitive glass (see Figure 7a). Figure 7b–c shows optical micrographs of a top view of the microchip and a side view of the microchannel, respectively (obtained by cutting the microchip along the dashed line in Figure 7b). The microchannel has a rectangular cross-section and is embedded 150 μm below the glass surface. Such a rectangular cross-sectional microchannel with flat and smooth internal walls is essential for capturing clear images of Euglena gracilis swimming in the microchannel using a microscope. For observations, Euglena gracilis is introduced into one of the reservoirs using an injection syringe filled with water. The microchannel is immediately filled with water, and the Euglena gracilis swims into the microchannel under its own propulsion since there is no water flow in the microchannel. In the microchannel, the Euglena gracilis is confined in a limited volume enabling the flagellum movement to be easily observed using a microscope located at position (1) in Figure 7a. The nanoaquariums reduce the observation time by a factor of more than 10 compared to the conventional method using a Petri dish. Euglena gracilis arrives at the opposite reservoir and swims upward. Observations from position (2) in Figure 7a enable images of the front of Euglena gracilis to be obtained. Figure 8 shows an image of the front view of Euglena gracilis swimming toward the camera; to the best of our knowledge, this is the first time that such an image has been obtained, and it enables analysis of the flagellum movement in three dimensions.
(a) 3D schematic illustration of a nanoaquarium used to observe the motion of Euglena gracilis. Optical microscope images showing (b) top and (c) side views of a fabricated nanoaquarium.

Optical microscope image of a front view of Euglena gracilis swimming upward in a reservoir.

Nanoaquariums for investigating the gliding mechanism of Phormidium
Recently, we have greatly enhanced the functionality of nanoaquariums by incorporating integrated optical waveguides and optical attenuators, both of which are fabricated by femtosecond laser direct writing of photosensitive glass after forming microfluidic structures.Reference Hanada, Sugioka, Ishikawa, Kawano, Miyawaki and Midorikawa22 These integrated nanoaquariums were applied to elucidate the gliding mechanism of Phormidium. Phormidium is a soil-dwelling unicellular, colonial cyanobacterium that forms motile filaments. These filaments migrate from the main biomass to nearby seedling roots where they form new colonies using a form of propulsion called Phormidium gliding, since the bacterium uses ciliary movement to glide through its own mucus. Phormidium has an ectosymbiotic relationship with seedlings: seedling growth accelerates after forming an association with Phormidium. Therefore, understanding the factors that induce Phormidium gliding is very important for developing a means to accelerate vegetable seedling growth. Such methods will improve crop yields and are thus promising for reducing food supply shortages. The gliding movement mechanism has been studied for many years using conventional observation methods involving fixing Phormidium and a seedling root on an agar gel in a petri dish in the field of view of an optical microscope and observing the gliding movement.Reference Halfen and Castenholz52, Reference Hoiczyk53 However, due to its gelatinous cell walls, Phormidium strongly adheres to agar gel. It also glides a considerable distance to the seedling root on the agar gel. Consequently, a very long time (typically a day or longer) is required to observe the gliding movement. Nanoaquariums can dramatically reduce the time required (∼1 h) to observe Phormidium gliding.
To investigate the attraction mechanism that directs Phormidium to glide toward a seedling, a T-shaped microfluidic channel was fabricated, with three reservoirs at its ends. With Phordimium introduced into one reservoir and a seedling root into another, the organism would always glide toward the seedling rather than the empty third reservoir. On the other hand, when the third reservoir was filled with carbonic water, direction of Phormidium gliding depended on concentration of the carbonic water. Additionally, the cyanobacterium glided into neither the seedling root nor carbonic water with a critical concentration of CO2, indicating that CO2 secretion by the root is a possible candidate for the attractant.
To confirm this hypothesis and determine the quantity of CO2 secreted by the seedling roots, nanoaquariums containing integrated functional microcomponents were fabricated. Two optical waveguides intersected by a microfluidic channel were integrated into a nanoaquarium to quantitatively determine the pH change of water in the microchannel by absorption spectroscopic analysis in the visible region. It was revealed that the pH of water containing the seedling root was comparable to that of the critical CO2 concentration, confirming that CO2 is the sole attractant for the gliding Phormidium.
It has also been found that the gliding movement of Phormidium is sensitive to the illumination conditions (e.g., the intensity and spectral properties of the light). To investigate the effect of illumination, optical transmission of visible light was controlled by fabricating optical attenuators around a portion of the microfluidic channel in the nanoaquariums (see Figure 9a). The optical attenuators were formed by irradiating photosensitive glass with a femtosecond laser beam after fabricating a microfluidic channel. The microchip was then annealed again (but not etched). After annealing, the laser-irradiated regions turned brown due to the formation of lithium metasilicate crystallites (see Figure 9b); these regions thus act as optical attenuators. The optical transmission is tuned by the number of attenuator layers fabricated. Figure 9b shows that Phormidium glided toward the root in the microfluidic channels when five or fewer optical attenuator layers were stacked but remained at the channel entrance for more than 2 h when six or more optical attenuator layers were stacked. Phormidium glides to a seedling root above a certain intensity for white light; this threshold was estimated to be 1530 lx. Further investigation using band-pass filters revealed that only light in the red wavelength region (i.e., in the spectral range of 640 to 700 nm) effectively promotes Phormidium gliding. These results are important for developing methods for accelerating vegetable seedling growth.
Integrated nanoaquarium design and investigation of white light intensity required to induce Phormidium gliding. (a) Structural diagrams of nanoaquarium integrated with optical attenuators (upper: overhead view, lower: side view). The same number of layers of optical attenuators were formed above and below a region of the microfluidic channel to control the white light intensity in the microfluidic channel. (b) Sequential microscope images of gliding movement in the microchip. Phormidium glided to the seedling root in the microfluidic channel covered with up to five optical attenuator layers, whereas it did not glide to the root when there were six optical attenuator layers, even after 2 h.

Summary
We have described a direct technique for fabricating 3D microfluidic structures inside glass microchips based on femtosecond laser direct writing. Studies were carried out to fabricate long channels with uniform diameters. This technique can be used to fabricate hollow microstructures with almost any 3D geometry without using stacking or bonding. This permits microfluidic systems to be integrated with micro-optical components (e.g., mirrors and lenses) and micromechanical components (e.g., valves and pumps) in a glass chip by a single continuous process. Furthermore, other micro-optical components such as optical waveguides and attenuators can be integrated by additional femtosecond laser direct writing. This technique has been demonstrated to be very useful for fabricating functional microchip devices for biological analysis. This technique would also be applicable for fabrication of micro-electro mechanical systems, including precision flexures and micro gyro sensors, as well as microchips for environmental monitoring and health care.
The glass materials used for this technique are fit to be used for these applications due to their high chemical stability and high transparency in a wide wavelength range. The high transparency is beneficial for integration of micro-optical components to perform optical biosensing. In particular, photosensitive glass is superior since a very smooth surface can be formed even at the internal walls of hollow microstructures.
Femtosecond laser direct writing for fabricating microchips has a much shorter history than conventional fabrication techniques. In addition, the high cost of amplified femtosecond laser systems limits use of this technique. Current femtosecond lasers also do not have sufficiently high performance in reliability, stability, and output power to enable them to be used in mass production. Therefore, this technique is currently only acceptable for producing small quantities of customized optofluidic devices. This limitation can be overcome by developing novel femtosecond lasers that are inexpensive and have high average powers and repetition rates. Recently, use of a rare-earth-doped laser medium enabled the fabrication of compact and high-power ultrafast laser systems using diode pumping, although the pulse width was much broader than that of the Ti:sapphire system commonly used. Picosecond lasers based on the rare-earth doped system for industrial applications are now commercially available and could potentially be used for the laser direct writing techniques described here. Finally, we would like to emphasize that femtosecond laser direct writing has opened up a new avenue for fabricating highly functional and innovative microchip devices for biological analysis that cannot be realized by existing techniques.