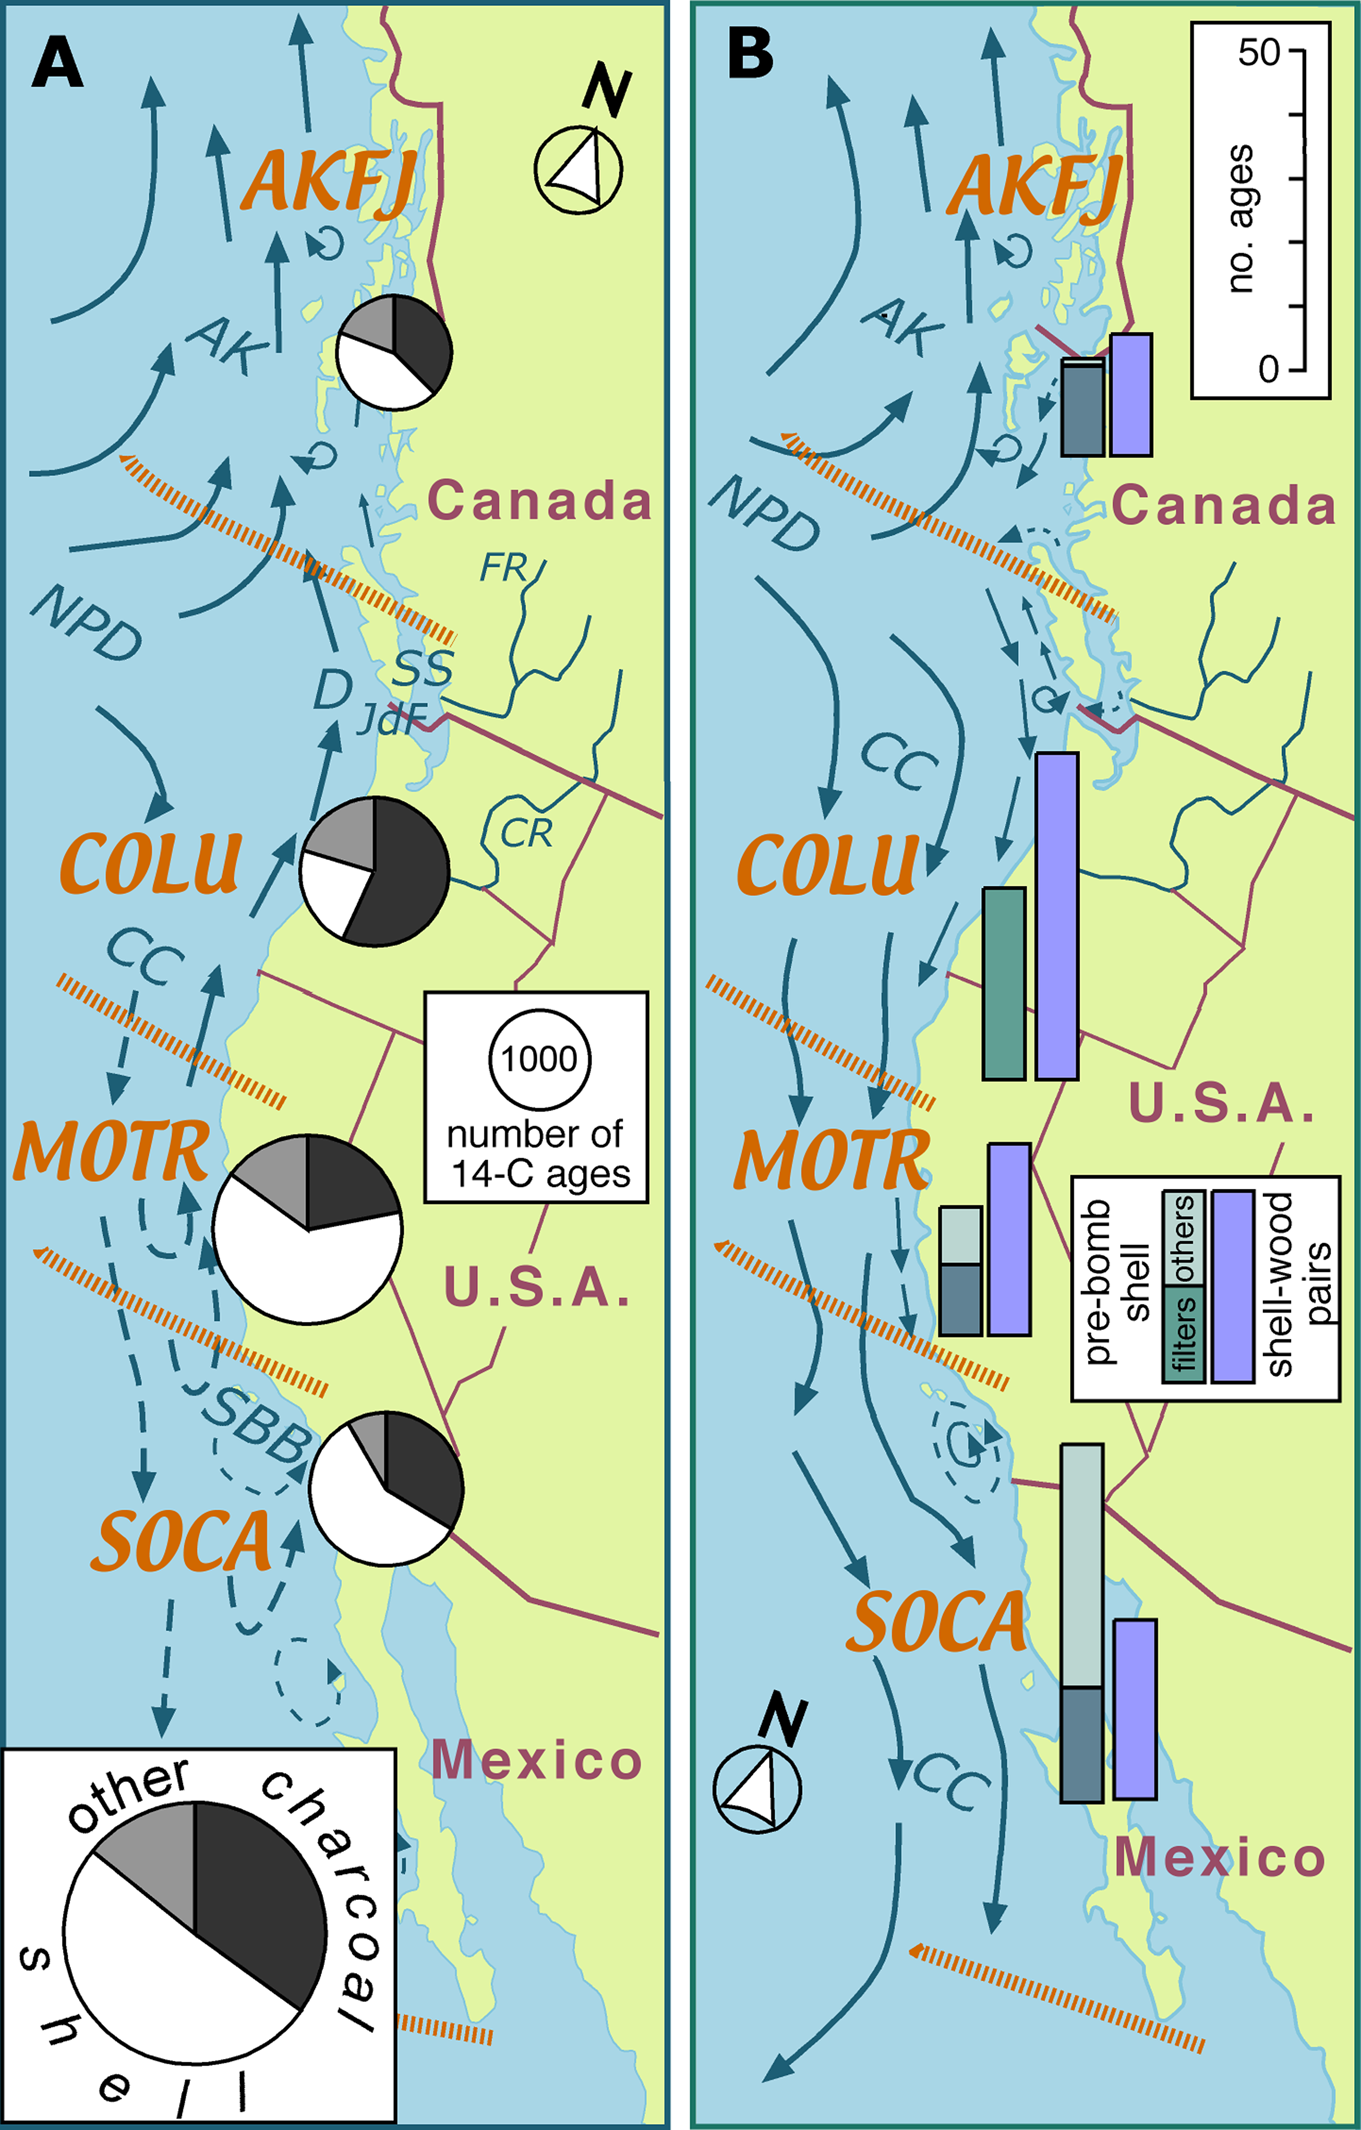


The locations of many of the precontact settlements on the west coast of North America are marked by shell deposits. Shells are not only more abundant but also generally far larger than the other organic residues in these cultural deposits, and they were consequently preferentially dated by archaeologists in the early years of the “radiocarbon revolution.” The development of AMS dating techniques in the late 1970s and early 1980s allowed investigators to date minute fragments of charcoal or wood, thereby sidestepping the uncertainties that accompany shell ages, but radiocarbon assays on shell carbonate continue to appear in the regional archaeological literature, predominantly from areas where charcoal is rare or unavailable (e.g., Jazwa and Rosencrance Reference Jazwa and Rosencrance2019; McCain et al. Reference McCain, Braje, Estrada, Michelini, Aguilar and Rick2019; Perry et al. Reference Perry, Glassow, Neal, Joslin and Minas2019; Porcasi and Radde Reference Porcasi and Radde2017; Reeder-Myers Reference Reeder-Myers2014; Taylor et al. Reference Taylor, Stein and Jolivette2011). Those dates add to the current catalog of more than 4,000 ages from shell on this coast, accounting for about two-thirds of the inventory of radiocarbon ages from the southern half of the coast, and about one-third of the inventory from the north (Figure 1). In contrast, radiocarbon assays on the remains of all the other participants in the marine food web (fish, mammals, birds, humans) account for only about 6% of the total inventory.
(a) Map of the study area showing ocean circulation patterns in winter (redrawn from Thomson Reference Thomson1981; Hickey and Banas Reference Hickey and Banas2008) and the relative frequency of radiocarbon ages derived from samples of shell, charcoal, and other materials (principally bone) from coastal cultural deposits in each of the four marine ecoregions (inset: overall frequency). Ecoregion names (AKFJ: Alaskan-Fjordland, COLU: Columbian, MOTR: Montereyan Transitional, and SOCA: Southern Californian) and boundaries are after Wilkinson and colleagues (Reference Wilkinson, Wiken, Bezaury-Creel, Hourigan, Agardy, Herrmann, Janishevski, Madden, Morgan and Padilla2009). Abbreviations, in alphabetical order: AK = Alaska Current; CC = California Current; CR = Columbia River; D = Davidson Current; FR = Fraser River; JdF = Juan de Fuca Strait; NPD = North Pacific Drift; SBB = Santa Barbara Basin; SS = Salish Sea. (b) Map of the study area showing ocean circulation patterns in summer and the relative frequency of the prebomb ages and shell-wood pairs in each of the four marine ecoregions that are analyzed in this study. (Color online)

Archaeologists on the west coast of North America have routinely corrected shell ages for isotopic fractionation and the marine reservoir effect (MRE). On occasion, the local correction factor (i.e., the ΔR component of MRE) has been independently determined during an investigation, but for the most part researchers have made use of previously published estimates. In some cases, however, no local estimates of ΔR were available. For example, when Madonna Moss excavated sea caves on the outer coast of southeastern Alaska in the 1980s–1990s, the “nearest-neighbor” ΔR estimate was from a site more than 1,000 km away. She therefore used the mean ΔR value for the entire northwest coast of North America (280 ± 50 years; Moss et al. Reference Moss, Erlandson and Stuckenrath1989, Reference Moss, Lepofsky, Lyons and Stein2004). McNeely and others (Reference McNeely, Dyke and Southon2006) subsequently dated shells in museum collections that had been gathered from the shorelines of the fjords of southeastern Alaska in the years prior to the atmospheric testing of nuclear weapons. Those shells yielded a mean ΔR value of 515 ± 80 years. Would a ΔR value derived from the shells of those recently deceased mollusks from the inner fjords be applicable to shells in much older deposits in sea caves on the outer coast?
Concerns about the applicability of estimates of ΔR to distant sites and deposits of disparate ages led one group of west coast archaeologists to call for the development of “comprehensive regional marine calibration curves that span the Holocene” (Deo et al. Reference Deo, Stone and Stein2004:784). In this article, I argue that although further ad hoc ΔR analyses, such as those of McNeely and others (Reference McNeely, Dyke and Southon2006), will undoubtedly refine the geographic specificity of ΔR estimates, a look-up table that provides estimates of ΔR for shells of any age in any cultural deposit on this coast is not a practical research objective. My objection is principally pragmatic, and it derives from the fact that most marine mollusks are sedentary and short lived. Their shells are therefore point-source samples of conditions in spatially complex and temporally variable intertidal habitats. Given the multidimensional nature of those habitats, and the ecological range and trophic variability of the mollusk taxa harvested by Indigenous peoples, how many dimensions (e.g., shoreline exposure, substrate texture, mollusk feeding strategy, etc.) would need to be incorporated, and how might temporal variability be accommodated in a calibration matrix?
Spatiotemporal Variation in ΔR: Study Area and Data Sources
Although the spatial and temporal sources of variability in ΔR cannot readily be decoupled, I consider them separately here in an attempt to demonstrate the difficulties in delimiting ΔR at geographic scales beyond the site-specific. My study area extends from Cabo San Lucas, at the southern tip of Baja California, to Yakutat, in southeastern Alaska (Figure 1), excluding San Francisco Bay, and the analysis is arbitrarily restricted to the last 2,000 years.
In order to elucidate the predominant sources of spatial variability, I divide this coastal strip into two segments: a southern segment stretching from Cabo San Lucas to Point Arenas in northern California, and a northern segment extending poleward from there to Yakutat (Figure 1). The boundary between the two segments lies in the transition zone between the two major hydroclimatic regions of western North America, regions that respond in a “see-saw” fashion to long-term changes in jet-stream position and storm tracks (Dettinger et al. Reference Dettinger, Cayan, Diaz and Meko1998; Sung et al. Reference Sung, An, Kim and Woo2014; Wise Reference Wise2010). Those atmospheric influences are expressed offshore by changes in the track, strength, and persistence of coastal currents.
Each of the coastal segments is subdivided into two marine ecoregions (Wilkinson et al. Reference Wilkinson, Wiken, Bezaury-Creel, Hourigan, Agardy, Herrmann, Janishevski, Madden, Morgan and Padilla2009). Point Conception marks the boundary between the Southern Californian and the Montereyan Transitional marine ecoregions, and the Brooks Peninsula divides the northern segment into the Columbian and the Alaskan/Fjordland ecoregions (Figure 1).
Spatial variability in ΔR is assessed from mollusk shells that were gathered in the late nineteenth and early twentieth centuries for museum collections. The shells predate open-air testing of nuclear weapons, which increased the radiocarbon content of the atmosphere and the surface waters of the ocean. The radiocarbon ages of samples of “prebomb” shells from the west coast of North America are reported by Berger and colleagues (Reference Berger, Taylor and Libby1966), Robinson and Thompson (Reference Robinson and Thompson1981), Ingram and Southon (Reference Ingram and Southon1996), McNeely and colleagues (Reference McNeely, Dyke and Southon2006), Holmquist and colleagues (Reference Holmquist, Reynolds, Brown, Southon, Simms and MacDonald2015), and Panich and colleagues (Reference Panich, Schneider and Engel2018), and they are archived in a global database (www.calib.org/marine). The number of dated prebomb shells in each of the coastal ecoregions is shown in Figure 1b. In order to reduce potential variability in ΔR resulting from diverse mollusk diets, only ΔR values derived from the shells of filter-feeding and herbivorous mollusks are used to assess spatial patterning. The taxonomic affinities, proveniences, measured ages, ΔR values, and literature sources for each of the resultant 80 samples are listed in Supplemental Table 1.
The applicability of these estimates of ΔR in geographic gaps in the prebomb shell distribution pattern, or to epochs prior to the nineteenth century, may be assessed by dating paired samples of shell and wood-charcoal from the same cultural or geological stratum (e.g., Deo et al. Reference Deo, Stone and Stein2004; Hutchinson et al. Reference Hutchinson, James, Reimer, Bornhold and Clague2004; Ingram Reference Ingram1998; Kennedy et al. Reference Kennedy, Russell and Guilderson2005; Martindale et al. Reference Martindale, Cook, McKechnie, Edinborough, Hutchinson, Eldridge, Supernant and Ames2018; Southon and Fedje Reference Southon and Fedje2003; Taylor et al. Reference Taylor, Southon and Des Lauriers2007). ΔR estimates derived from these shell-wood pairs are likely, however, to be less accurate than those from prebomb shell because the radiocarbon ages of both the shell and the charcoal partner are inherently uncertain.
Samples of prebomb shell from the same site and collected in the same year may yield dissimilar ΔR results. In some cases, these disparities may arise because specimens were not alive when collected (Ingram and Southon Reference Ingram and Southon1996), but the shells of living mollusks with similar feeding strategies from the same local microhabitat may also yield highly variable ages (e.g., McNeely Reference McNeely2006). The shell sample in a shell-wood pair will also yield inaccurate results if the shell was discarded decades or centuries earlier and then redeposited by geomorphic processes or bioturbation. The charcoal may also yield anomalous ΔR values if, for example, it comes from the heartwood of a centuries-old tree. I compiled a catalog of 123 shell-wood pairs (Supplemental Table 2: restricted to wood [predominantly charcoal] samples ≤2,000 14C years old, matched with dated samples of mollusk shell from the same excavation unit, either within the same stratum or the same 10 cm thick horizon in the cultural deposit). I excluded samples that were clearly anomalous, but there is no objective test by which such “old-shell/old-wood” anomalies can be identified. Their incidence may be reduced by dating charred twigs (e.g., Kennedy et al. Reference Kennedy, Russell and Guilderson2005) rather than large charcoal fragments of uncertain origin, and anomalous values are more likely to be identified if several shell and charcoal samples from the same stratum are dated (e.g., Cook et al. Reference Cook, Ascough, Bonsall, Derek Hamilton, Russell, Sayle, Marian Scott and Bownes2015; Martindale et al. Reference Martindale, Cook, McKechnie, Edinborough, Hutchinson, Eldridge, Supernant and Ames2018).
Shell Deposits and the Local Intertidal Environment
The discarded shells in a cultural deposit tend to echo the local species assemblage, which in turn mirrors the array of intertidal habitats in the vicinity of the settlement. Indigenous people principally consumed mussels (Mytilus spp.), abalone (Haliotis spp.), oysters (Ostrea lurida), and clams (Protothaca [a.k.a. Leukoma], Saxidomus, Siliqua, and Macoma spp.). That list includes obligate filter feeders (Mytilus, Ostrea, Protothaca, Saxidomus, Siliqua), facultative filter feeders (Macoma), and grazers (Haliotis).
Estimates of the local value of ΔR derived from such a shell assemblage may vary widely because not only do these animals inhabit diverse environments (rocky shores, sandy beaches, mudflats), but they can be harvested over a range of ages, and as their shells encapsulate conditions over their entire life cycle, the shells of younger mollusks are likely to yield ΔR values that differ from those of their older kin.
Several of these shellfish are currently farmed in sheltered and productive waters on the northern segment of this coastline. They feed throughout the year, but shell growth is restricted to the periods when water temperature exceeds 10°C (Hallmann et al. Reference Hallmann, Burchell, Schöne, Irvine and Maxwell2009; Quayle Reference Quayle1988; Skidmore and Chew Reference Skidmore and Chew1985). On the northern coast, this period may be less than six months in length, so the shells are proxies for summer conditions. On the southern coast, temperatures may never fall below this threshold, and the shells are therefore continuous recorders of oceanic environments.
Interactions between the animal's feeding habits and food sources affect the shell's radiocarbon age. Mussels, oysters, and other suspension feeders filter living diatoms and bacteria from the inundating seawater, and as these planktic microorganisms have essentially the same radiocarbon signature as seawater, they exert little influence on the radiocarbon age of the mollusk's shell. These filter feeders, however, may ingest considerable quantities of suspended detritus, particularly in estuarine environments. If the detritus has been pre-aged in neighboring wetland or floodplain soils, then the shells of the filter feeders may yield radiocarbon ages that approach those of the obligate detritivores from the same locality.
Patterns of ΔR Variation on the Pacific Coast of North America
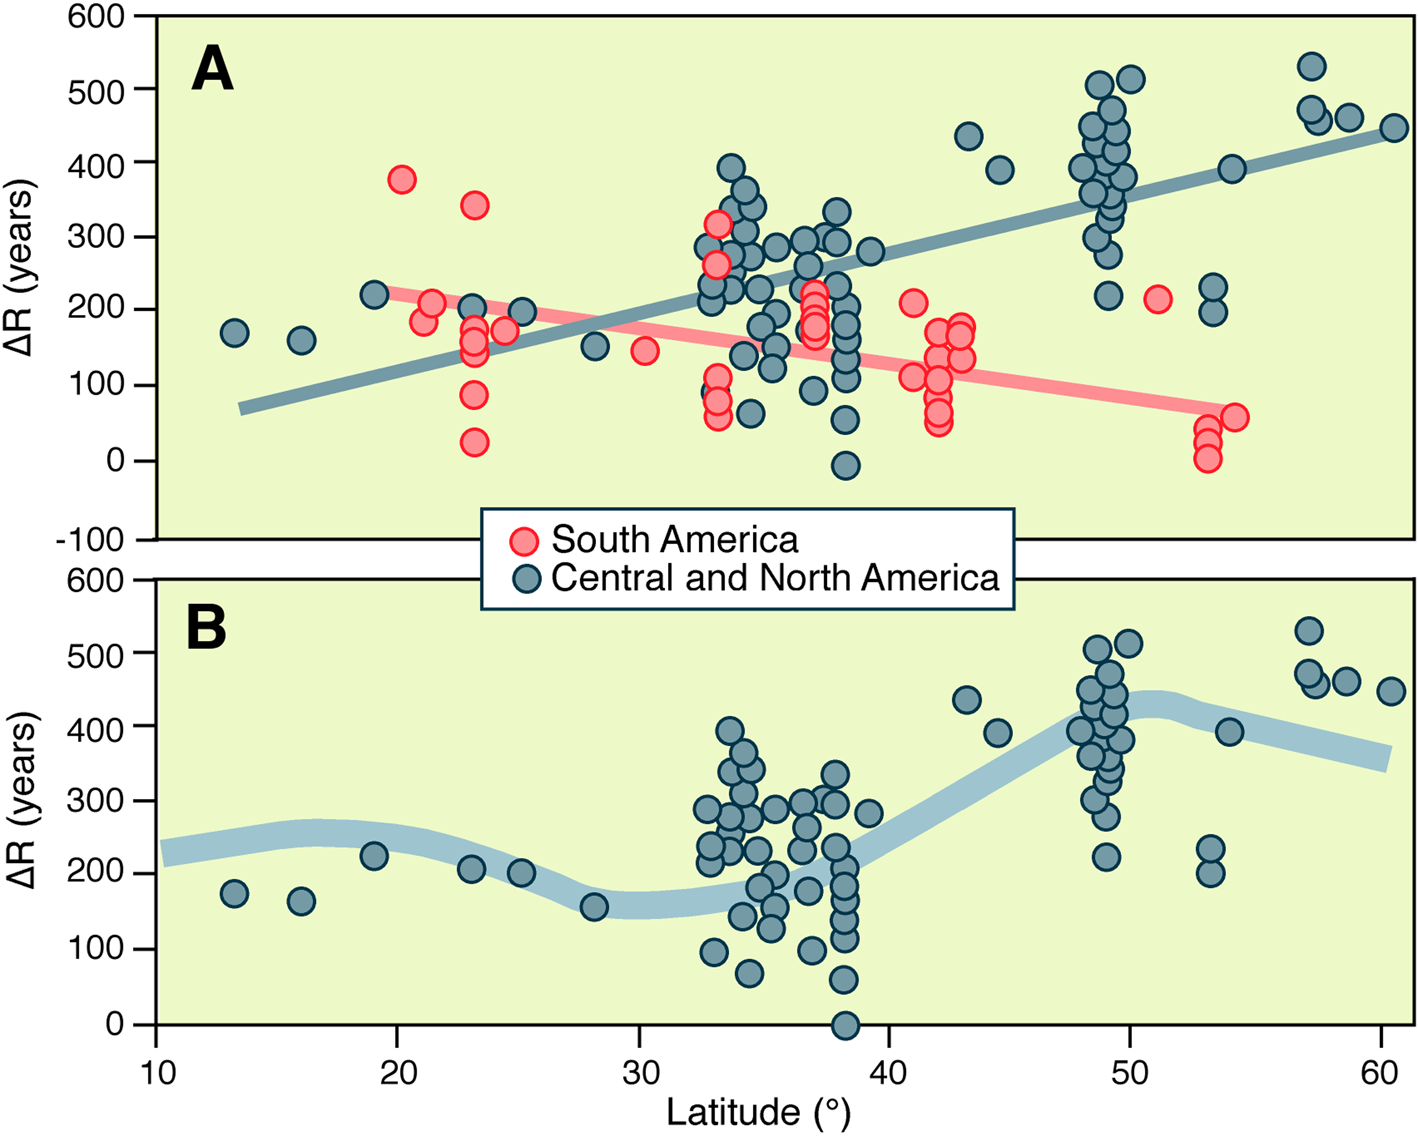
A plot of the ΔR values of prebomb shell along the coasts of Central and North America (Figure 2a) shows that ΔR increases from about 150–200 years in the subtropics, to about 250 years on the coast of southern California, and to more than 400 years in southeastern Alaska, with a concomitant increase in local variability. That pattern is distinctly different from that on the west coast of South America (Figure 2a). ΔR values on the coast from southern Peru to central Chile are akin to those at equivalent latitudes in Central and North America, but the ΔR values in the fjord complexes of southern Chile are much lower than their counterparts in northern British Columbia and southeastern Alaska, despite the fact that the west coasts of North and South America display similar latitudinal gradients in climate.
(a) Variation in ΔR with latitude on the west coasts of Central and North America (excluding San Francisco Bay), and South America. The ΔR values in both charts are derived from the apparent ages of shells of suspension-feeding mollusks collected in the decades prior to atmospheric testing of nuclear weapons (data: http://calib.qub.ac.uk/marine/index.html). (b) As above for Central and North America, plus the estimated ΔR value for offshore waters at 600 m depth (Gebbie and Huybers Reference Gebbie and Huybers2012:Figure 8). (Color online)

The Age Gradient of Offshore Waters
The difference between coastal ΔR values from Chile and southeastern Alaska probably reflects the age of the water offshore. Water circulating at intermediate depths (300–800 m) in the north Pacific Ocean is principally generated by thermohaline processes in the Sea of Okhotsk and along the southern margin of the Bering Sea (Talley Reference Talley1993; Watanabe et al. Reference Watanabe, Ikeda and Wakatsuchi2004). Water at these depths in the Gulf of Alaska may have been out of contact with the atmosphere for up to 1,000 years, far longer than water at equivalent depths off the coast of South America (Gebbie and Huybers Reference Gebbie and Huybers2012: Figure 8).
Thorough mixing of these intermediate-depth waters in the northeastern Pacific into the surface layers at the ocean margins would generate ΔR values (assuming a value of 450 years as a global mixed surface-layer correction [Reimer et al. Reference Reimer, Bard, Bayliss, Warren Beck, Blackwell, Ramsey, Buck, Cheng, Lawrence Edwards and Friedrich2013] for the immediate prebomb era) ranging from about 200 years at 30°N to about 400 years at 55°N. The ΔR values of the prebomb shells parallel this meridional gradient (Figure 2b).
The substantial local variability in ΔR revealed by Figure 2b, on the other hand, reflects the interaction of macroscale and mesoscale influences, which enhance or diminish the advection and mixing of these intermediate-depth waters into the surface waters of the coastal zone. The most important of these influences are the ocean circulation patterns, the annual precipitation regime, and the tidal range and wave climate. The first of these controls the vertical transport of intermediate-depth waters; the second, the discharge of freshwater into the coastal zone; and the last two, the cross-shelf transport and mixing of near-surface waters. The relative importance of each of these controls in modifying the background ΔR value may be judged from the latitudinal changes in the dominant oceanic current, precipitation, fluvial discharge, tidal range, and wave climate patterns shown in Figures 3 and 4, which summarize data collected at buoys deployed for the last several decades in U.S. and Canadian coastal waters (Supplemental Table 3), and at onshore tide gauges and river monitoring stations (Benke and Cushing, Reference Benke and Cushing2005). Embedded within these broad latitudinal patterns, however, are local-scale heterogeneities in ΔR that reflect the variable width and slope of the continental shelf (Figure 4), the orientation of the shoreline, and backshore topography and geology.
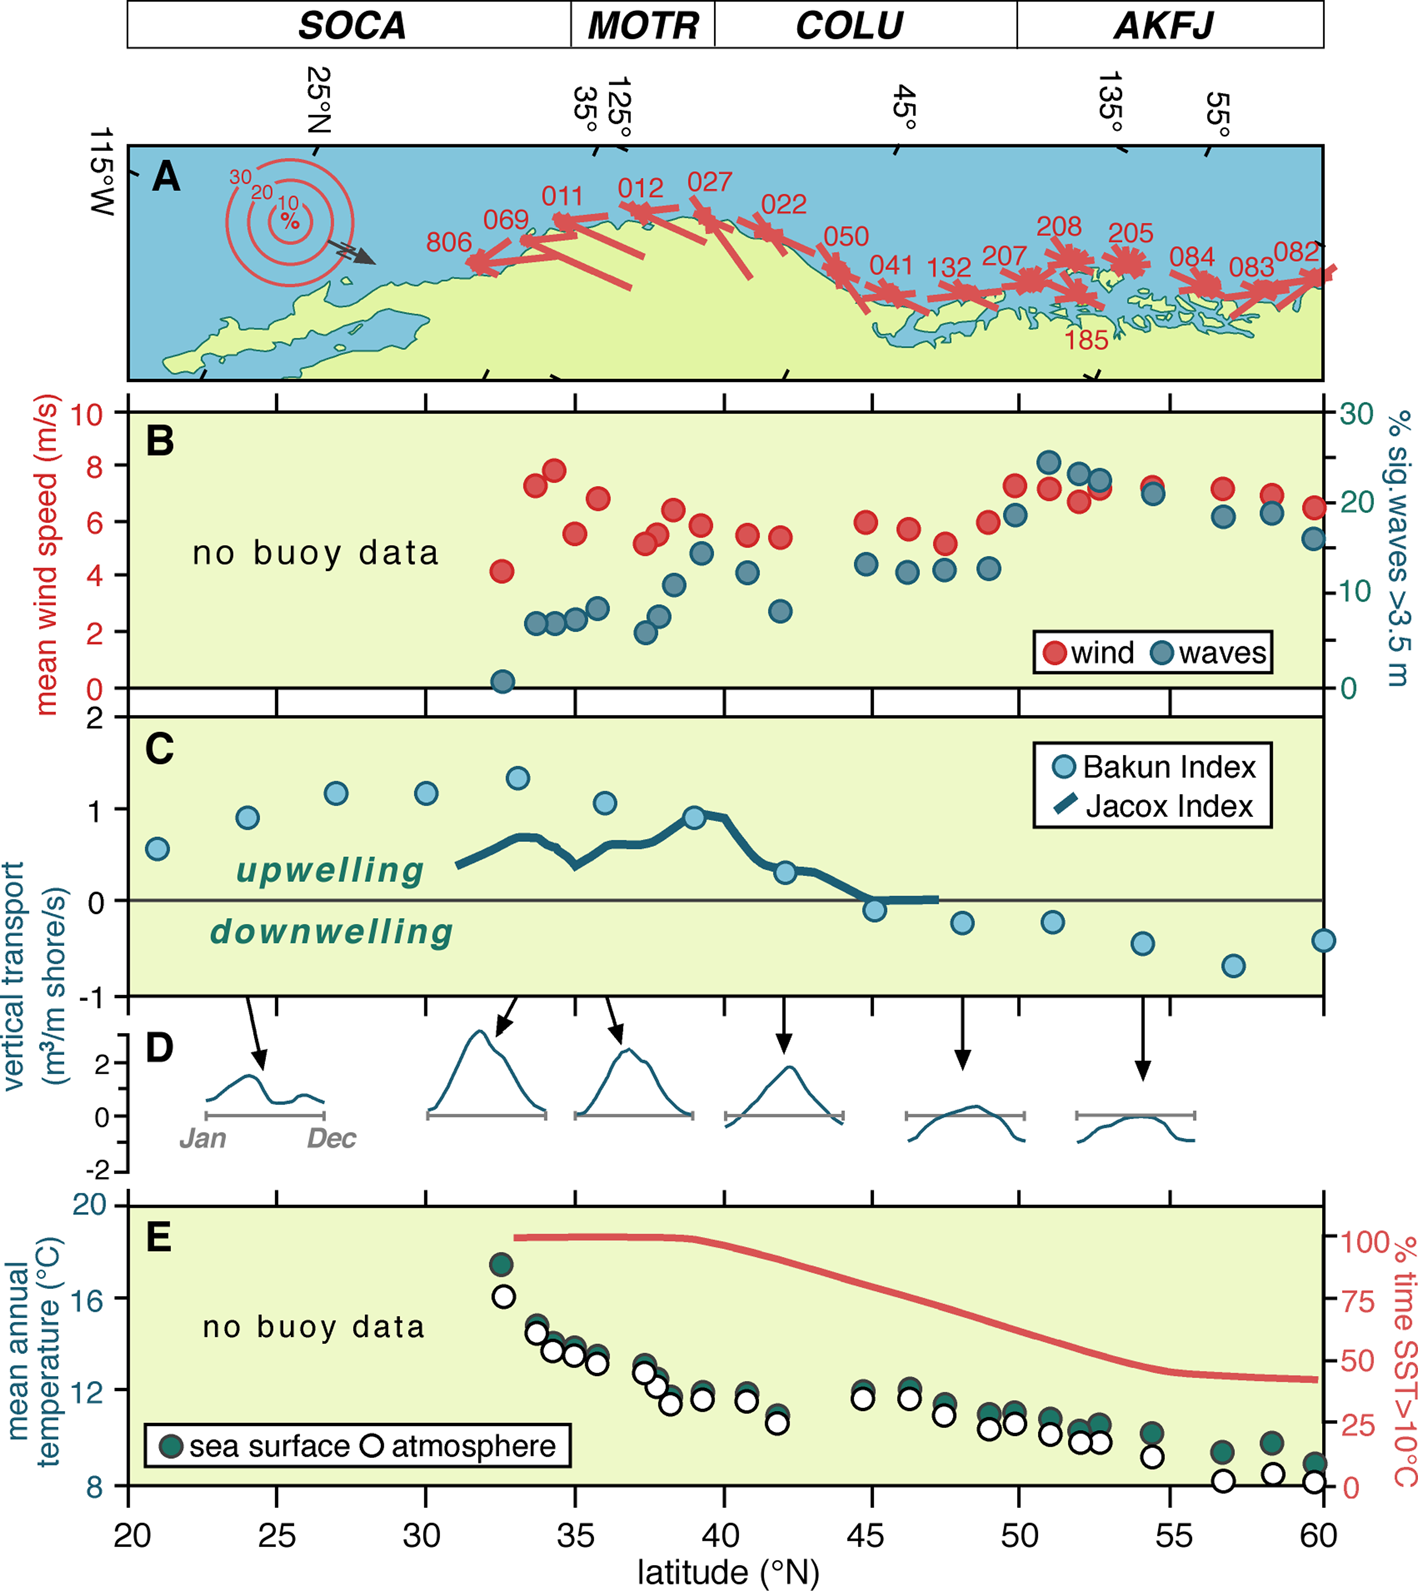
(a) Mean annual wind patterns at selected offshore buoys (the “46” prefix for each buoy number is omitted); (b) mean annual wind speed and percentage of significant waves >3.5 m in height at the offshore buoys; (c) mean annual net rates of vertical transport of water in the coastal zone; (d) monthly mean transport rates; (e) mean annual sea-surface and atmospheric temperatures, and relative length of the potential shell-growing season (SST >10°C). (Color online)

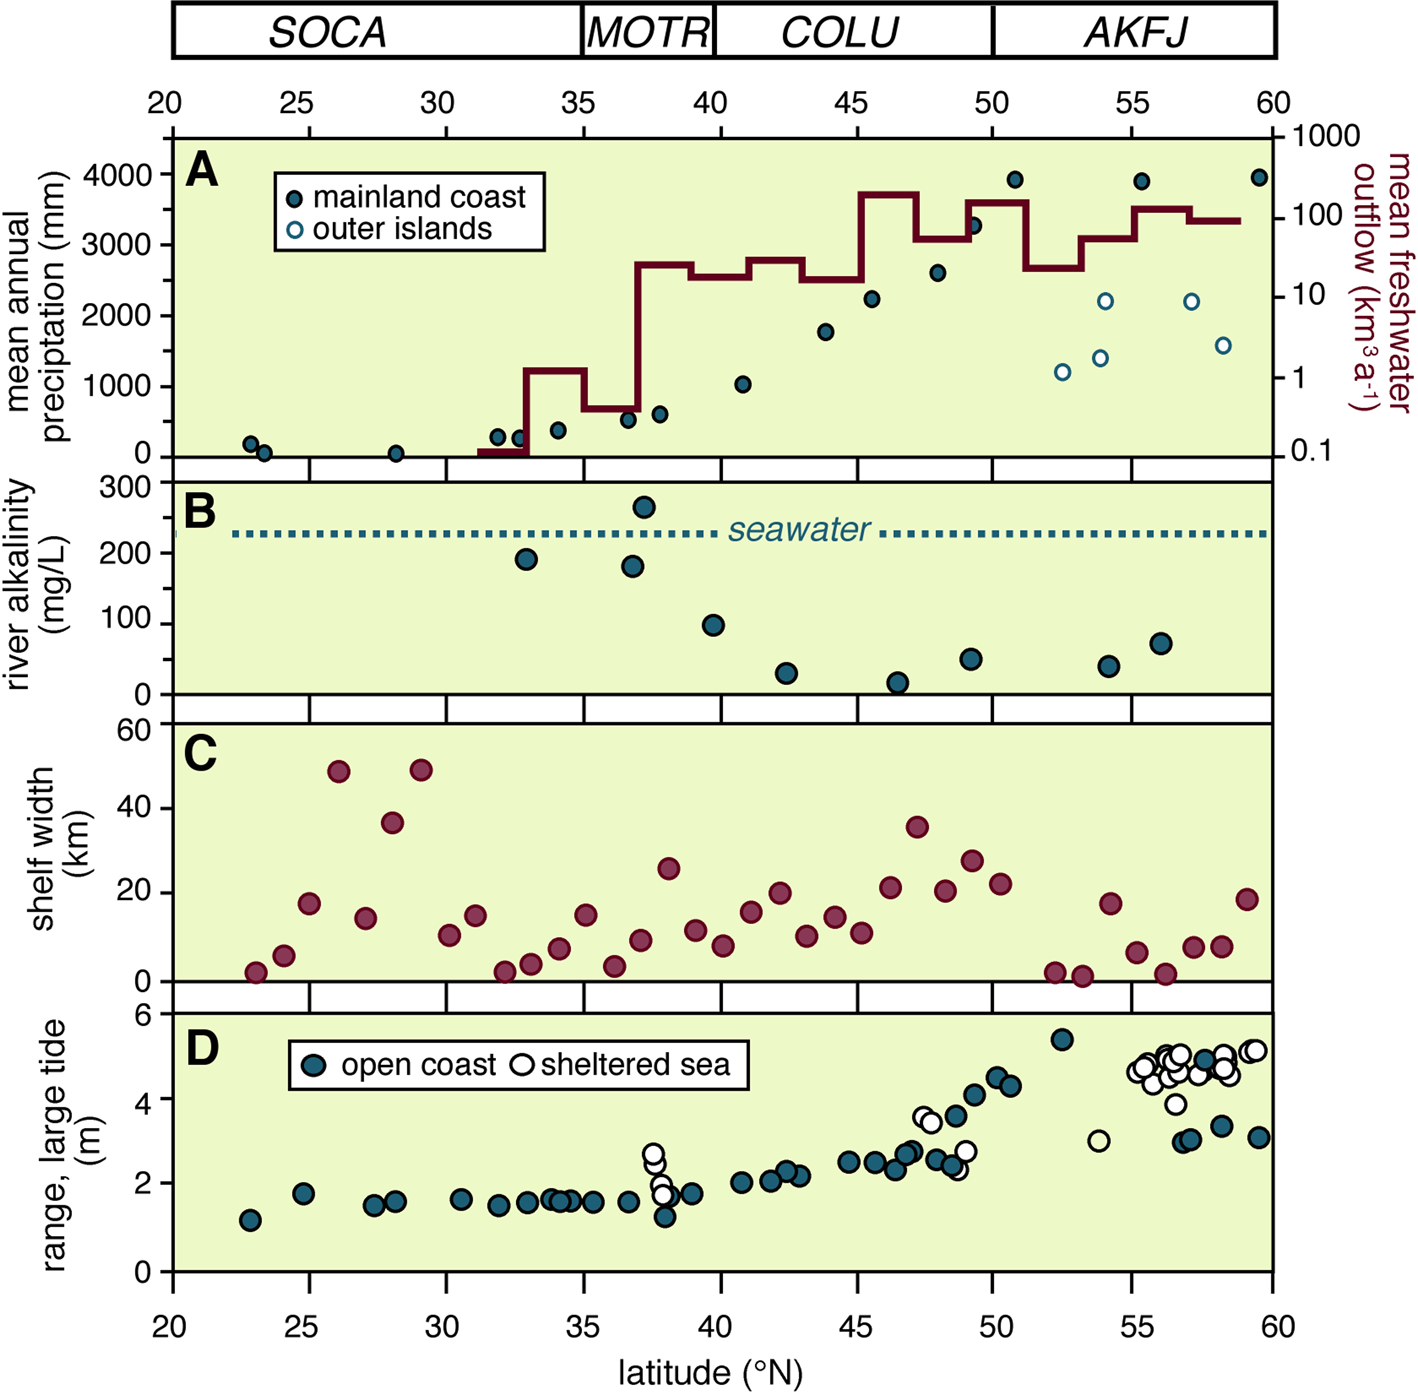
(a) Mean annual precipitation (dots) and mean annual outflow of large and middle-sized rivers (bar graph) binned by latitude (2° bins); (b) mean alkalinity of monitored rivers; (c) width of the continental shelf at 1° latitude intervals, and (d) mean range of large tides. (Color online)

Coastal Currents
The dominant surface currents off the west coast of North America are the alongshore limbs of an eastward-flowing transoceanic current (the North Pacific Drift) that bifurcates as it approaches the continental margin (Figure 1). The equatorward return limb forms the California Current, and the poleward return limb is the Alaska Current. The Coriolis effect directs the waters entrained in the California Current offshore (i.e., Ekman transport) and those in the Alaska Current onshore. The advected surface waters in the California Current are replaced by water upwelling from near-surface and intermediate-depth waters. Upwelling in the California Current domain is expressed by depressed sea-surface and atmospheric temperatures at the offshore buoys (Figure 3d).
The latitudinal variation in ΔR shown in Figure 2b has commonly been attributed to the variable strength of the California Current alongshore. For example, Holmquist and colleagues (Reference Holmquist, Reynolds, Brown, Southon, Simms and MacDonald2015:449) state:
Surface waters off of North America's Pacific coast tend to have higher ΔR values than the standard marine calibration because of strong upwelling caused by the western deflection of the California Current as it moves south from British Columbia to Baja California. Latitudinal variation in upwelling strength causes a tendency for poleward waters to have higher ΔR than equatorial waters.
Calculations of the upwelling rates in the domain of the California Current by Bakun (Reference Bakun1973) and Jacox and colleagues (Reference Jacox, Edwards, Hazen and Bograd2018), however, reveal a more complex latitudinal pattern (Figure 3c). Their estimates of vertical advection show an increase in the southern coastal segment, but poleward of 39°N, the upwelling season—associated with northerly wind dominance (Figure 3a)—becomes progressively shorter (Figure 3d), until at about 45°N, the annual volume of upwelled water is exceeded by the volume sinking to lower depths.
Superimposed on these supraregional patterns are permanent, macroscale features coupled with changes in shoreline orientation. The lower upwelling rates immediately south of 40°N (Figure 3c), for example, may be linked to a change in shoreline orientation at Cape Mendocino. The more acute change in the orientation of the coast south of Point Conception (34.5°N) results in a discontinuity in the California Current as well as the development of a return current in the Southern California Bight (Figures 1 and 5a). The lower ΔR values downstream of both these features (Figure 2b) may be attributable to reduced upwelling in their wakes.
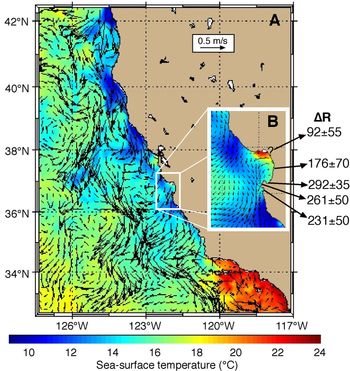
(a) Sea-surface temperatures (°C) and currents (m/s, arrows) in central and southern California on July 7, 2018, at 0300 GMT; and (b) in Monterey Bay and vicinity at the same time (http://west.rssoffice.com/ca_roms?variable=temp). The ΔR values, with one exception, are derived from http://calib.qub.ac.uk/marine/index.html. The exact provenance of the shell yielding the 92 ± 55 year ΔR value is not known, but Berger and colleagues (Reference Berger, Taylor and Libby1966) note it as Monterey, and Berger and Libby (Reference Berger and Libby1966) indicate that it is from Santa Cruz County (i.e., the northern shore of the bay). The exception is the ΔR value from Elkhorn Slough, on the central shore of the bay (Jones and Jones Reference Jones and Jones1992). (Color online)

Smaller coastal crenulations and offshore banks can have similar effects: promontories deflect the coastal current offshore, meanders form in their lee, and cyclonic eddies frequently occur in the loops of each meander. Upwelling rates may vary considerably over short distances alongshore as a result. A snapshot of current directions and sea-surface temperatures (SST) on the California coastline on a single day in the summer of 2018 (Figure 5) illustrates the potential complexity of these patterns. Upwelling (inversely related to SST) is reduced on the eastern limb of the inshore cyclonic eddies and enhanced in the immediate lee of the promontories compared to areas upstream of the obstruction.
The effect of these mesoscale differences on ocean ventilation is illustrated by ΔR determinations on shells collected in Monterey and Carmel bays in the prebomb era. SSTs in the summer are consistently 3°C–4°C lower along the south shore of Monterey Bay than on the northern shore because of vigorous local upwelling (Figure 5b), and the shells dated by Berger and Libby (Reference Berger and Libby1966), Robinson and Thompson (Reference Robinson and Thompson1981), Jones and Jones (Reference Jones and Jones1992), and Ingram and Southon (Reference Ingram and Southon1996) reflect the variation in upwelling intensity. The three shells from the vicinity of Point Pinos, the promontory at the southern end of the bay, yield an average ΔR value that is about 150 years greater than that of the two shells from the central and northern shores (Figure 5b).
In addition to Ekman transport and deflection of the currents by obstacles, the other mechanisms promoting entrainment of intermediate-depth waters into near-shore areas are (a) turbulent flow across complex bottom topography (shoals, sills, and glacial troughs), (b) turbulent tidal flow in narrow straits, (c) upwelling at the shelf break prompted by offshore winds, (d) large-scale estuarine circulations, (e) semipermanent eddies at the mouths of straits, and (f) the oceanward migration of large-scale eddies from coastal source areas and enhanced localized upwelling at the heads of submarine canyons (Hickey and Banas Reference Hickey and Banas2008).
Tidal ranges and the latitudinal variation in the width of the continental shelf (defined as the distance to the 100 m isobath, measured orthogonally from the coast) are shown in Figure 4.
Freshwater Outflows: Volumes and Regimes
The total freshwater efflux from medium-sized and large rivers to the northeast Pacific Ocean is about 1,000 km3 per year (Royer Reference Royer1982). Ninety-five percent of that efflux results from runoff and snowmelt in the wetter northern segment, where annual precipitation commonly exceeds 2,000 mm (Figure 4). Creeks, small rivers, and groundwater discharges may add an equivalent amount, and probably exhibit a similar latitudinal gradient in flow magnitude.
All of the streams draining the Coast Ranges in the southern coastal segment are directly responsive to precipitation patterns—in other words, the high discharges occur in concert with winter rains. In the mountainous terrain of the northern segment, however, discharge follows a mixed pluvial-nival regime—increasing amounts of snow result, at least in the case of medium-sized catchments, in a late fall-winter discharge peak, with a secondary peak in the melt season. The larger rivers that drain the continental interiors, such as the Columbia and Fraser, have nival regimes—peak flows occur in late spring-early summer as the snow melts. This pattern also holds for the nival-glacial streams of southeastern Alaska. The timing of the freshwater pulse and its potential effect on mollusk shell growth therefore varies latitudinally.
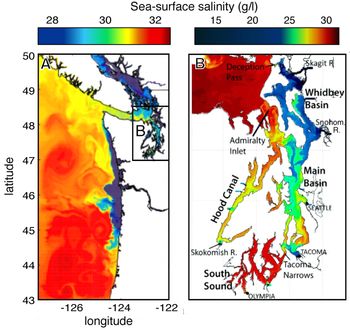
The potential influence of freshwater outflows on surface waters of the coastal zone is clearly discharge dependent. Whereas creeks only impact the temperature, salinity and turbidity of surface waters in the immediate vicinity of the river mouth, the major rivers affect the near-coastal oceanic environment for considerable distances alongshore. For example, outflows from the Columbia River, the largest river on this coast, modify the character of surface waters over more than 400 km of coastline (Figure 6a). In the winter, when southwesterly winds are dominant, the freshwater plume disperses northward, carried by the waters of the Davidson Current (Figure 1) along the outer coast of Washington State. During the summer freshet, however, north and northwesterly winds are dominant, and the river plume is transported southward, creating a stratification barrier that suppresses upwelling along much of the northern Oregon coast. Unfortunately, estimates of ΔR from prebomb shell are only available from a single site at the southern limit of this zone (Robinson and Thompson Reference Robinson and Thompson1981), so the effect of these freshwater inputs on the apparent ages of the shells of mollusks growing in these waters remains unknown.
(a) A snapshot of sea-surface salinity patterns in the Columbian marine ecoregion in summer, based on the model developed by Sarah Giddings and the University of Washington Coastal Modeling Group (for details, see Giddings and MacCready Reference Giddings and MacCready2017; Giddings et al. Reference Giddings, MacCready, Hickey, Banas, Davis, Siedlecki, Trainer, Kudela, Pelland and Connolly2014). The low salinity values in the Salish Sea (Figure 1) result from freshwater outflow from the Fraser River and its neighbors; the depressed salinity values on the outer coast represent dispersion of the Columbia River plume by countervailing winds during a downwelling-upwelling reversal episode. (b) A snapshot of sea-surface salinity in the Salish Sea on June 21, 2006, several days after the onset of a coastal upwelling episode, derived from a model developed by Dave Sutherland and the University of Washington Coastal Modeling Group (for details, see Sutherland et al. Reference Sutherland, MacCready, Banas and Smedstad2011). Note the contrasting patterns in the sub-basins of Puget Sound. (Color online)

Variations in discharge volumes and seasonal regimes can induce complex local patterns in the salinity, temperature, and turbidity of surface waters. A snapshot of sea-surface salinity patterns (inversely related to freshwater discharge) in the Strait of Juan de Fuca and the neighboring sub-basins of Puget Sound in mid-summer (Figure 6b) illustrates the potential for local variations in ΔR as a result (Sutherland et al. Reference Sutherland, MacCready, Banas and Smedstad2011). It might be presumed that the overall effect of these freshwater inputs would be to lower the ambient ΔR value, the magnitude of which might be estimated by a distance-decay function from the freshwater point sources, but that presumption may not be valid. This is because although freshwater flows increase stratification of surface waters, thereby reducing upwelling, they also transport dissolved and particulate carbon from terrestrial to oceanic reservoirs, which may partially offset such effects.
Freshwater Outflows: Carbon Export
Rivers deliver significant amounts of dissolved inorganic carbon (DIC) as well as particulate and dissolved organic carbon (POC, DOC) into coastal waters (Marwick et al. Reference Marwick, Tamooh, Teodoru, Borges, Darchambeau and Bouillon2015). DIC concentrations can be approximated by measuring total alkalinity. Rivers in the northern half of the study area have a much lower alkalinity (Figure 4) than that of seawater (~50 mg/L, measured as CaCO3, vs. 220–230 mg/L for the open waters of the North Pacific), and ΔR values in estuaries are therefore likely to be further reduced compared to those on open coasts. The rivers in the southern segment, however, display a broad range of alkalinities (100–500 mg/L) that reflect variable groundwater contributions to runoff. The DIC in these waters is in many cases a product of the weathering of 14C-free carbonaceous bedrock, and ΔR values in these estuaries may therefore be modestly lower than on neighboring open coasts—or anomalously large.
Mollusk ingestion of plant detritus recycled from floodplain or wetland soils and sediments may also influence ΔR values in shell from estuarine environments. For example, at least 60% of the organic carbon on the continental shelf beneath the Columbia River plume is of terrestrial origin (Prahl et al. Reference Prahl, Ertel, Goñi, Sparrow and Eversmeyer1994). That value rises to approximately 90% within 30 km of the mouth of the river (Feng et al. Reference Feng, Benitez-Nelson, Montluçon, Prahl, McNichol, Xu, Repeta and Eglinton2013). The radiocarbon age of bulk samples of this material ranges from 1140 to 1700 years. This is not an isolated case. For example, the DOC and POC in the Santa Clara River, the largest of the rivers entering the Southern California Bight, currently yield mean radiocarbon ages of approximately 1500 and 3000 years, respectively. Incorporation of this material into shells via metabolic pathways may produce anomalies in the radiocarbon ages of mollusk shells from these estuarine waters.
It should be noted, however, that although most authors consider that metabolically derived carbon makes only a minor contribution to shell formation, the science is not settled. Estimates of the relative contribution of respired carbon not only vary widely (from <10% to 85%) but appear to be determined in part by environmental context and in part by shell age and size (McConnaughey and Gillikin Reference McConnaughey and Gillikin2008 and references therein).
Tidal Exchange, Eddies, Etcetera
The other mechanisms promoting entrainment of deeper water into near-shore areas are (a) tidal flow across complex bottom topography (shoals, sills, and glacial troughs), (b) tidal flow in narrow straits, (c) upwelling at the shelf break prompted by offshore winds, (d) semipermanent eddies at the mouths of straits, and (e) the oceanward migration of large-scale eddies from coastal source areas. All of these mechanisms operate in the estuarine fjords on the northern half of the coast. I illustrate the operation of these factors with two examples: the Salish Sea, particularly the Straits of Georgia and Juan de Fuca, and the fjord complex of southeastern Alaska.
As noted above, the Salish Sea is a classic fjord estuary with substantial freshwater inputs, primarily from the Fraser River. Surface outflows of brackish water, principally through the Strait of Juan de Fuca, are transported northward along the west coast of Vancouver Island by a semipermanent cyclonic eddy at the mouth of the strait (Thomson Reference Thomson1981). These outflows are offset by an influx of saline oceanic water at depth. The 3–4 m tidal range induces vigorous upwelling and mixing of these water masses in the narrow passages between the islands that separate the Strait of Juan de Fuca from the Strait of Georgia.
The efficacy of these processes in entraining radiocarbon-depleted oceanic water into the basins is evident in the ΔR determinations. The mean prebomb ΔR in the Strait of Georgia (394 ± 64 years, based on a sample of six shells of filter-feeding mollusks) is slightly higher, but it is not significantly different from that on the outer coast, and it is very similar to the mean from nine prebomb shells of filter-feeding mollusks collected from sites near the landward end of the Strait of Juan de Fuca (419 ± 52 years). Although radiocarbon-depleted freshwaters in the Salish Sea may affect these ΔR values, it should be noted that all the prebomb shells from the Strait of Georgia were collected from beyond the limits of the freshet plume of the Fraser River.
Similar conditions occur in the fjord complexes of southeastern Alaska. It might be presumed that summer melt from glaciers at the head of these fjords would produce strongly stratified estuarine flow, resulting in reduced ΔR values, but such is not the case. Four Mytilus shells from the inner fjords yielded a mean ΔR of 475 ± 35 years (McNeely et al. Reference McNeely, Dyke and Southon2006), whereas four shells of filter feeders from Haida Gwaii, on the outer coast to the south of the Alaskan fjordlands, yielded a significantly lower value of 275 ± 87 years. Although radiocarbon-depleted waters from thawing glacial ice may account for part of this difference, it more likely results from vigorous mixing of deep waters from beyond the continental shelf break with surface waters across a very narrow shelf (Figure 4). Deep-water renewal is particularly intense in the vicinity of sills and lateral constrictions in the narrow, steep-sided fjords in the summer, and during the winter when strong “gap” winds flow out from the continental interior. Vigorous mixing also occurs in association with the eddies that are generated by the strong tidal flows at the mouths of the straits. The eddies extend throughout the water column, persist for several years, and transport estuarine outflows northward along the shores of the outer islands (Ladd and Cheng Reference Ladd and Cheng2016; Stabeno et al. Reference Stabeno, Bond, Kachel, Ladd, Mordy and Strom2016; Weingartner et al. Reference Weingartner, Eisner, Eckert, Danielson and Bellwood2009).
Temporal Variation in ΔR on the Pacific Coast of North America
Short-Term Variation in ΔR
Unlike currently farmed shellfish, which are commonly ready for market at less than two years of age, the shellfish gathered by Indigenous peoples on the northwest coast were about 5–10 years old (Cannon and Burchell Reference Cannon and Burchell2009; Dana Lepofsky, personal communication 2018). Whole-shell values of ΔR are therefore snapshots of intertidal conditions over an equivalent period, and they mask shorter-term fluctuations in the organism's habitat. These sub-decadal excursions in ΔR can be as large as the trans-Holocene range. Culleton and colleagues (Reference Culleton, Kennett, Lynn Ingram, Erlandson and Southon2006), for example, recorded interannual variations of approximately 200 years in ΔR values in individual mussel valves on the southern Californian coast, and Ferguson and colleagues (Reference Ferguson, Johnson, Santos, Meyer and Tripati2013) documented a similar degree of intra-annual variability in shells from the same area. Both authors conclude that these disparities reflect fluctuations in the frequency, intensity, and duration of upwelling events in the coastal zone.
Long-Term Variation in ΔR
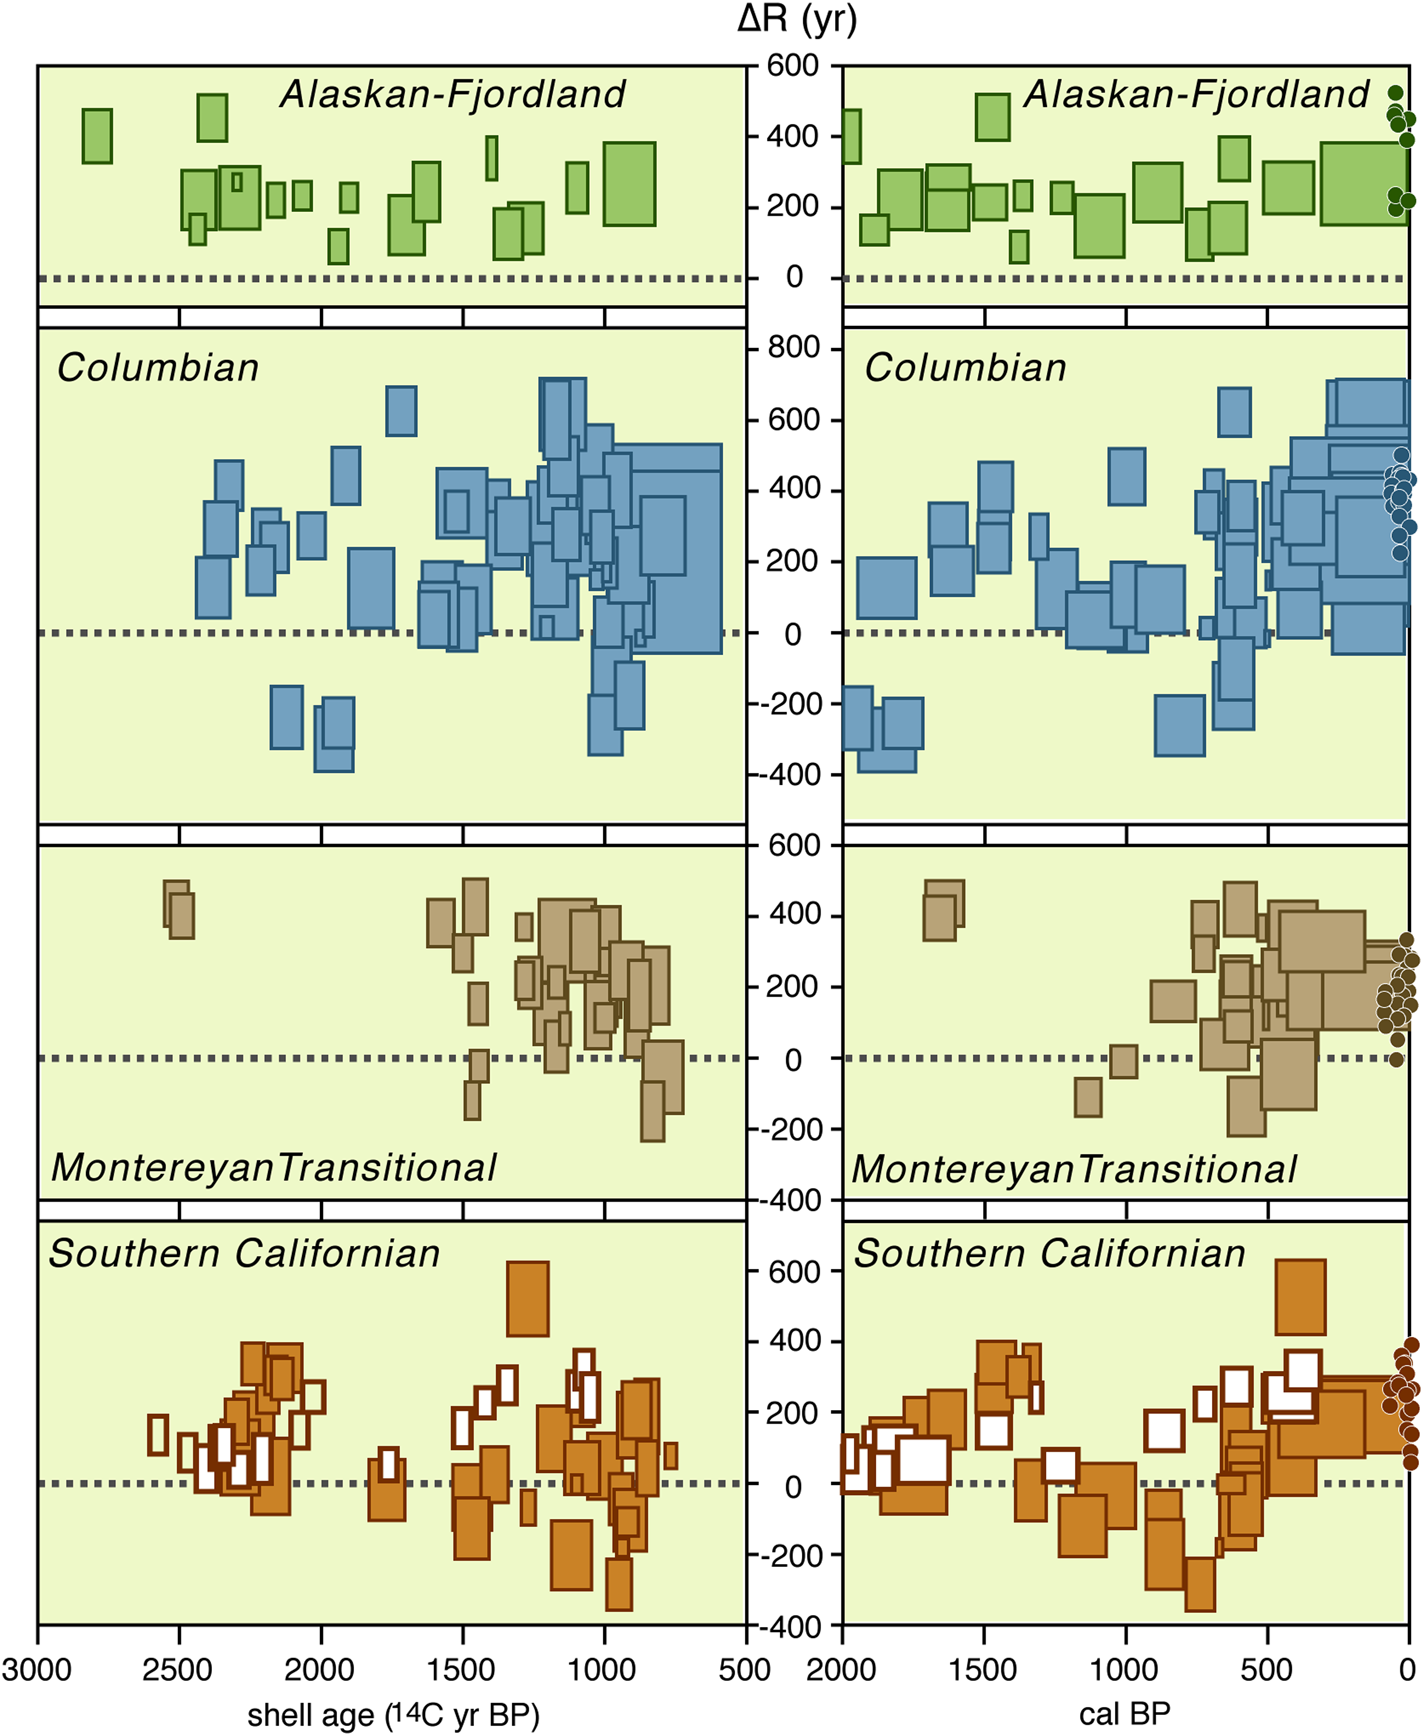
A plot of ΔR values against shell age for the individual shell-wood pairs in each of the ecoregions (shown as 1σ boxplots in the left-hand panels of Figure 7) illustrates the inherent variability of the ΔR values. These large ranges in ΔR may in part be a result of the inadvertent sampling of “old wood” or bioturbated deposits. They may also be an expression of the disparate geomorphic contexts from which the shells were harvested. But some of the variability undoubtedly reflects temporal fluctuations in the coastal zone environment. Synchronous changes in the magnitude or tempo of these fluctuations in each of the ecoregions may give rise to communal variations in ΔR values, which are masked in the shell age–ΔR plots. Replotting the calculated ΔR values against the calibrated ages of the wood samples in each pair reveals (with the exception of the Montereyan Transitional ecoregion) similar temporal signatures, albeit of variable amplitude (Figure 7:right panels).
Left-hand panels: 1σ ranges of shell ages (in radiocarbon years) and associated ΔR values, shown as filled rectangles, for the 123 shell-wood pairs in the four ecoregions in the study area. The equivalent age ranges (in radiocarbon years) of the foraminifera from the sediments underlying the Santa Barbara Basin (Hendy et al. Reference Hendy, Dunn, Schimmelmann and Pak2013) are shown as bold, open rectangles. Right-hand panels: Wood ages (in calibrated years BP) and ΔR values for the shell-wood and foraminifera-wood pairs. The small dots show the equivalent ΔR values for the prebomb shells from each ecoregion. (Color online)

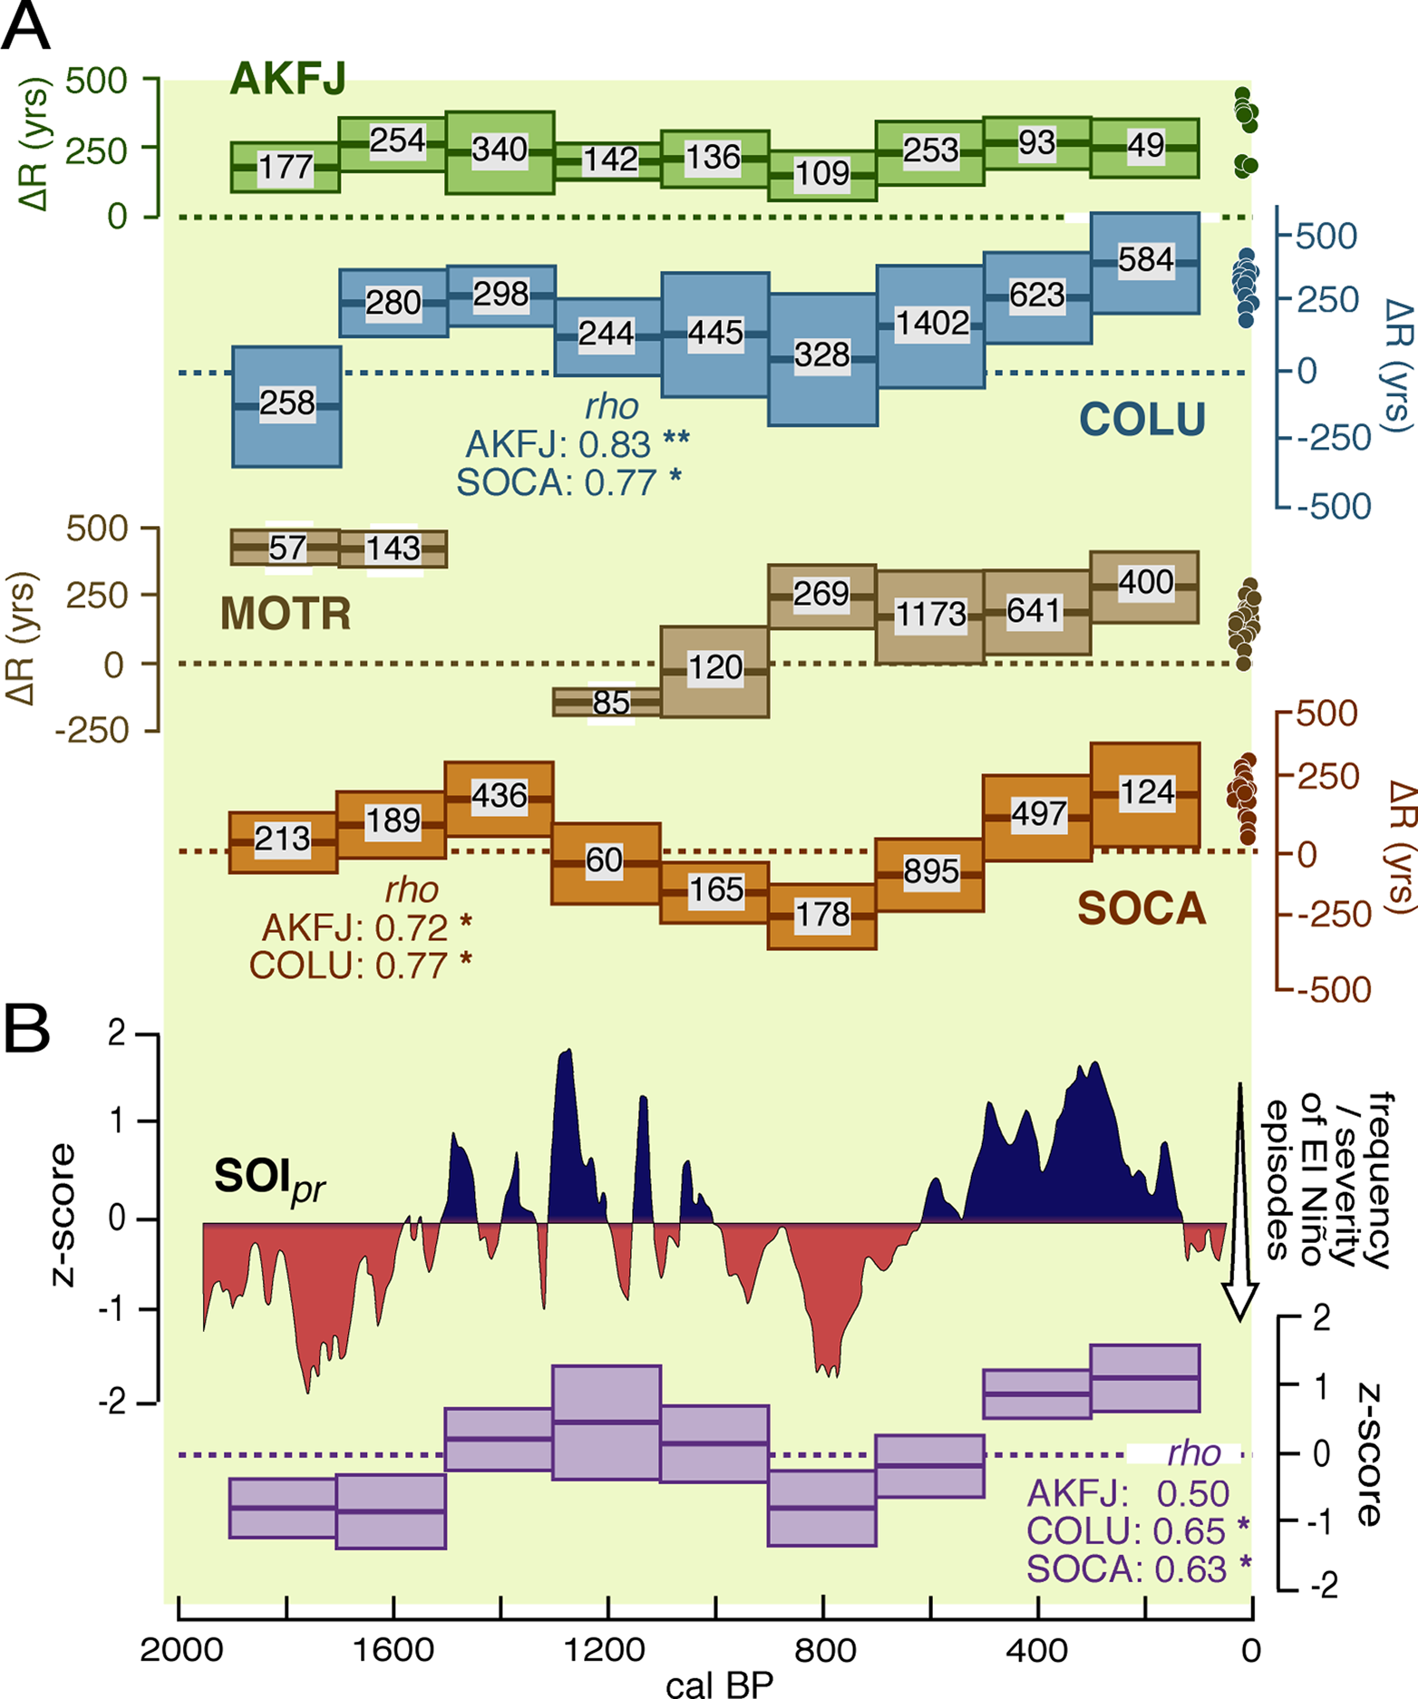
I tested the commonality of these patterns by generating 100 Monte Carlo samples from the means and standard deviations of all the ΔR estimates and the calibrated ages of the associated wood samples. I binned the resultant values into 200-year silos, calculated the mean and standard deviation of the ΔR values in each bin (Figure 8a), ranked those values in descending order, and calculated Spearman's Rho values between each pair of ecoregions. The limited number of shell-wood pairs older than about 1000 cal BP from the Montereyan Transitional ecoregion precluded its inclusion in this exercise, but the intercorrelations between the Alaskan-Fjordland, Columbian, and Southern Californian ecoregions are all positive and significantly different from zero (Figure 8a).
(a) Mean and 1σ ranges of ΔR in 200-year bins generated by repeated (100×) random sampling of the distribution functions of the wood ages and ΔR values of the shell-wood pairs in each of the four ecoregions. The numbers within each boxplot show the resultant density of samples in each bin. Correlations (Spearman's Rho) between the ecoregion sequences and the probabilities of no positive association (*p < 0.05; **p < 0.01) are shown below the boxplots. The small dots show the equivalent ΔR values for the prebomb shells from each ecoregion. (b) Above: fluctuations in the Southern Oscillation Index (SOIpr) as a measure of El Niño activity, as reconstructed by Yan and colleagues (Reference Yan, Sun, Wang, Huang, Qiu and Yang2011). Below: mean and 1σ ranges of the SOIpr values in 200-year bins. The correlations (Spearman's Rho) between the SOI temporal sequence and those in the ecoregions are shown below the boxplots, with their probabilities of no positive association: * p < 0.05; ** p < 0.01. (Color online)

If the fluctuations in mean ΔR values in the shell-wood pairs are indeed a proxy for a series of synchronous environmental changes in the late Holocene, a similar temporal pattern should also be apparent in other marine or coastal records. The authors of virtually all such studies, however, either assume a uniform value for ΔR over this interval (often basing their estimates of ΔR on prebomb shell or shell-wood pairs from archaeological sites) or calculate ΔR from the disparities in ages of paired samples of planktonic and benthic foraminifera, both of which are potentially subject to ΔR variation. A notable exception is the study conducted by Hendy and colleagues (Reference Hendy, Dunn, Schimmelmann and Pak2013), who determined ΔR values from the age offsets of planktonic foraminifera and detrital wood fragments in the sediment in the Santa Barbara Basin (SBB; Figure 1; data in Supplemental Table 2). They demonstrated that ΔR values varied from approximately 70 to approximately 350 years over the course of the last 2,000 years. The temporal pattern of ΔR variation in the foraminifera-wood pairs (Figure 7) echoes that of the local shell-wood pairs, albeit in a more muted form. The differences between the two may be a product of resolution: the marine sediments reflect changes in environmental conditions in the South California Bight, whereas the shell-wood pairs are snapshots of local conditions on a much longer stretch of coastline.
A detailed examination of the drivers that underlie these long-term ΔR fluctuations in each of these ecoregions is beyond the scope of this article, but it would appear that the ΔR temporal pattern is broadly concordant with centennial-scale variations in El Niño–Southern Oscillation (ENSO) activity in the late Holocene (Figure 8b). Yan and colleagues (Reference Yan, Sun, Wang, Huang, Qiu and Yang2011) developed an index of these variations (their Southern Oscillation Index: SOIpr) from the precipitation histories of sites in Indonesia and the Galápagos Islands, and a ranked series of binned mean SOI values based on their data is highly correlated with the mean ΔR values from the same intervals from the Columbian and Southern Californian ecoregions (see Rho values, Figure 8b).
The enhanced ΔR values on the west coast of North America coincide with prolonged periods of positive SOIpr anomalies, which are associated with abnormally cold surface waters, dry periods, and weak or infrequent El Niño activity in the eastern tropical Pacific Ocean. Depressed ΔR values coincide with negative SOIpr values, which denote abnormally warm ocean waters, wet phases, and an increased frequency of moderate or severe El Niños. If the ultimate drivers of the temporal fluctuations in ΔR are the atmospheric-oceanic teleconnections between the tropical eastern Pacific and the coastal waters of the northeastern Pacific, their proximate causes are the effects that these phase changes exert on the frequency and intensity of coastal upwelling and the source water chemistry of upwelled waters, particularly at the southern end of the California Current system (Jacox et al. Reference Jacox, Fiechter, Moore and Edwards2015).
The SOI phase changes are strongly echoed in the temporal patterns of ΔR variation in the Southern Californian and Columbian ecoregions, but they are only weakly expressed farther north (Figure 8a). Although the limited impact of these perturbations in the Alaskan-Fjordland ecoregion may simply be a distance-decay effect, other factors may also play a role. Melsom and colleagues (Reference Melsom, Meyers, Hurlburt, Metzger and O'Brien1999), for example, showed that the northward translation of Kelvin waves in the 1997–1998 El Niño stimulated eddy formation in the Gulf of Alaska. The subsequent movement of the eddies offshore results in a compensatory flow of deep water across the continental shelf, thereby potentially dampening fluctuations in ΔR. It should be noted however, that the shell-wood pairs from this ecoregion all derive from two local areas of northern British Columbia. No shell-wood pairs of late Holocene vintage have as yet been dated from sites in southeastern Alaska.
Discussion
The degree to which the inherent spatiotemporal variations in ΔR described here need to be accommodated in archaeological practice on the west coast of North America depends on the objectives of the investigation. The results of a CRM study, for example, are unlikely to be challenged if conventional radiocarbon ages on shell are offset by a supraregional, trans-Holocene ΔR value. Analyses of the linkages between culture, subsistence, resource availability, and climate at coastal archaeological sites, however, demand more precise chronological control. A study of those relations using shell ages from the Alaskan-Fjordland ecoregion, where deviations in ΔR are modest, might well be feasible by dating a few local shell-wood pairs. But archaeologists working in areas to the south face problems ranging from the surmountable (with sufficient financial investment) to the insoluble. Variations in ΔR associated with fixed geographic features (headlands, bays, estuaries) could be mapped with a sufficiently dense array of prebomb shell ages, but corralling the ΔR fluctuations arising from changeable upwelling patterns and freshwater volumes would present far greater challenges, and the correction values may in some cases be essentially indeterminate.
Given the complexity of the geographic template on the west coast of North America and the capricious changes in the Holocene coastal environment, can further expenditures on shell dates be justified, except, perhaps, in places where closely constrained and site-specific ΔR values can be developed, or in places where charcoal is rare or wholly absent? What then of the myriad ages in the archaeological literature on marine shell (and ages derived from the remains of the other participants in marine food webs)? Can they be successfully recalibrated, or should they be reluctantly cast aside?
Acknowledgments
Thanks to Gary Breschini and Jack Meyer for sharing their radiocarbon catalogs, to Yi Chao for granting permission to copy the maps shown in Figure 5, and to Sarah Giddings and Dave Sutherland for granting permission to reproduce the maps shown in Figure 6. The development of their models was supported by grants from the NSF, NOAA's Coastal Ocean Program, and the University of Washington. Thanks also to Dana Lepofsky, Rob Losey, Paul Valentich-Scott, Jerry Moore, Bruce Bradshaw, Matthew Kirby, Jason Addington, and Mike Foreman for sending me data and answering my questions; to Lori Nordstrom, for the Spanish translation of the abstract; and to the reviewers, whose critical comments on earlier versions of the manuscript led to substantial improvements in the final draft. The base map for Figure 1 was taken from the North American Environmental Atlas from the Commission for Environmental Cooperation.
Data Availability Statement
Pre-bomb shell ages, shell-wood pair ages, and buoy data are presented in the three supplemental files.
Supplemental Materials
For supplemental material accompanying this article, visit https://doi.org/10.1017/aaq.2020.47.
Supplemental Table 1. Estimated values of ΔR from prebomb marine shell samples from the coast of western North America.
Supplemental Table 2. Estimated values of ΔR from paired samples of marine and terrestrial organic materials from archaeological sites on the west coast of North America.
Supplemental Table 3. Oceanic and atmospheric data from offshore buoys, west coast of North America.