Introduction
Wolbachia pipientis encompasses a group of obligate, maternally-inherited intracellular Rickettsia-like bacteria that infect many invertebrates (Jeyaprakash & Hoy, Reference Jeyaprakash and Hoy2000; Lo et al., 2007). Wolbachia infections were first described in cytological preparations from Culex mosquito reproductive tissues (Hertig, Reference Hertig1936). The evolutionary success of Wolbachia is attributed in part to its ability to manipulate the reproduction of its hosts. One such manipulation is cytoplasmic incompatibility (CI), which is characterized by early embryonic arrest resulting in host death (Tram et al., Reference Tram, Ferree and Sullivan2003). In addition to basic scientific interest in the Wolbachia-host interaction, there is an interest in the use of Wolbachia in applied strategies for controlling insects and insect-vectored diseases (Sinkins & Gould, Reference Sinkins and Gould2006; Walker et al., Reference Walker, Johnson, Moreira, Iturbe-Ormaetxe, Frentiu, McMeniman, Leong, Dong, Axford, Kriesner, Lloyd, Ritchie, O'Neill and Hoffmann2011).
To facilitate the study of Wolbachia-host cell interactions, a Wolbachia-infected cell line (Aa23) was established using Aedes albopictus embryos (O'Neill et al., Reference O'Neill, Pettigrew, Sinkins, Braig, Andreadis and Tesh1997). Aedes albopictus mosquitoes are naturally ‘superinfected’ with two Wolbachia infections, wAlbA and wAlbB, that are maternally inherited through the embryos (O'Neill et al., Reference O'Neill, Giordano, Colbert, Karr and Robertson1992; Sinkins et al., Reference Sinkins, Braig and O'Neill1995). The Aa23 cell line was established from post-blastoderm embryos, resulting in a cell line that consists of many cell types, and only the wAlbB infection is present in the Aa23 cell line. The wAlbB Wolbachia appears to infect all cell types, and the infection level has been observed to vary among the different cell types and over time (O'Neill et al., Reference O'Neill, Pettigrew, Sinkins, Braig, Andreadis and Tesh1997). Subsequent work has shown the Aa23 cell line to be a useful tool for studies including antibiotic tests with Wolbachia infection (Hermans et al., Reference Hermans, Hart and Trees2001; Fenollar et al., Reference Fenollar, Maurin and Raoult2003b; Makepeace et al., Reference Makepeace, Rodgers and Trees2006). However, variation in infection level can complicate experimental interpretation. Here, two approaches have been examined for an ability to ameliorate the complication of temporal infection variability.
In the first approach, the effect of cell-passaging methods on Aa23 Wolbachia infection level is examined. Cell-culture passaging is required to prevent cell overcrowding and to replenish media components required for cell growth. The level of cell dilution during passaging can affect cell growth (Agathos et al., Reference Agathos, Jeong and Venkat1990; Gerenday & Fallon, Reference Gerenday and Fallon1996). Specifically, in vitro mosquito cells at low densities grow relatively slowly (Agathos et al., Reference Agathos, Jeong and Venkat1990). With increasing cell density, cell growth rate can increase until cells become overcrowded and/or the nutrients in the medium are depleted. In previous studies, Aa23 cells have been maintained using differing media types and timing between cell passaging ranged from three to seven days (O'Neill et al., Reference O'Neill, Pettigrew, Sinkins, Braig, Andreadis and Tesh1997; Hermans et al., Reference Hermans, Hart and Trees2001; Fenollar et al., Reference Fenollar, La Scola, Inokuma, Dumler, Taylor and Raoult2003a; Makepeace et al., Reference Makepeace, Rodgers and Trees2006). Here, fluorescence in situ hybridization (FISH) staining was used to characterize temporal variation in Wolbachia infection levels in Aa23 by comparing four passaging regimes. The overall Wolbachia infection level, uniformity of infection level per host cell and temporal changes in infection level are presented.
A second approach examining for an ability to reduce variability was based upon the hypothesis that the multiple cell types present in the Aa23 cell line contribute to infection variability. The wAlbB and wRi Wolbachia from Aa23 and Drosophila simulans (Riverside), respectively, were established in C7-10, which is a clonal cell line generated by sub-cloning from an A. albopictus neonate larval cell line (Singh, Reference Singh1967; Nouri & Fallon, Reference Nouri and Fallon1987). Wolbachia infection in the C7-10 cell lines was evaluated. We discuss the infection dynamics amongst the different Wolbachia-infected cell lines to determine which cell line is most stable for in vitro Wolbachia studies.
Materials and Methods
Cell lines
Aa23 is a non-clonal cell line that is infected with the wAlbB Wolbachia strain (O'Neill et al., Reference O'Neill, Pettigrew, Sinkins, Braig, Andreadis and Tesh1997). Wolbachia infection in Aa23 was eliminated by adding tetracycline to the culture medium at a concentration of 10 μg ml–1 (Dobson et al., Reference Dobson, Marsland, Veneti, Bourtzis and O'Neill2002) (method below). The resulting cell line was named Aa23 T. C7-10 is a well-characterized clonal cell line that is not infected with Wolbachia (Singh, Reference Singh1967; Nouri & Fallon, Reference Nouri and Fallon1987).
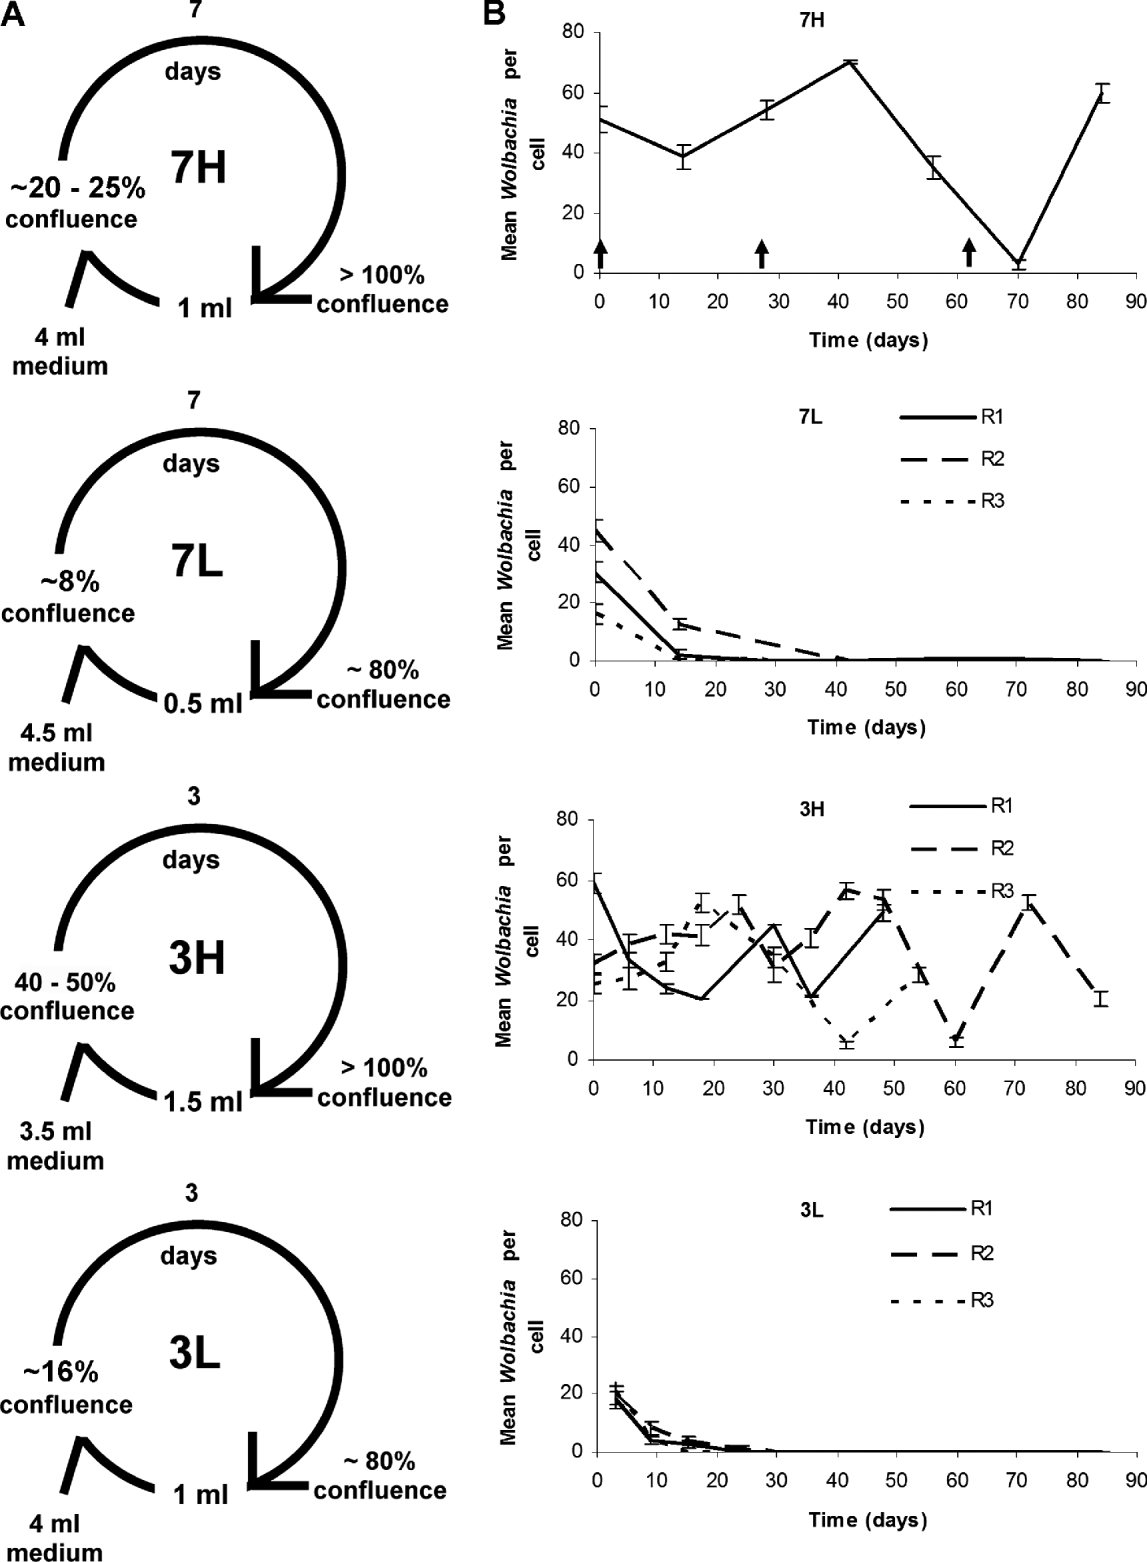
The Aa23 and Aa23 T cell lines were maintained similarly to a protocol previously described (Fenollar et al., Reference Fenollar, La Scola, Inokuma, Dumler, Taylor and Raoult2003a). Briefly, the cell lines were cultivated as cell monolayers in 25 cm2 cell culture flasks at 28 °C in (1:1) Mitsuhashi-Maramorosh and Schneider's insect media (Sigma-Aldrich, St Louis, MO, USA) supplemented with 10% heat-inactivated fetal bovine serum (Invitrogen Corp., Carlsbad, CA, USA). At the time of passage, cells were detached by gently shaking the flasks, and 0.5 or 1.5 ml of the resulting cell suspension was added to fresh medium for a total volume of 5 ml and transferred to a new flask. Four different Aa23 passaging treatments were characterized, varying the cell confluence level at the time of passage and the level of cell dilution during passage (fig. 1A). Three replicates were conducted for each treatment, with the exception of the original 7H treatment, which was unreplicated.
Passaging regimes and Wolbachia infection levels in Aa23. (A) Four passaging regimes tested on Aa23. The cells were transferred into new flasks every three or seven days. The density of cells is expressed as cell confluence. The initial volume of cell suspension at the start of each passage is as indicated. (B) Wolbachia infection in Aa23 cells for each passaging regime, visualized using FISH. Wolbachia infection levels are expressed as mean (±SE) Wolbachia from 45 host cells. Arrows in the graph of 7H indicate the times when the 7H cells were split to obtain the replicates for the 7L, 3H and 3L regimes. R1, R2, R3 = replicates 1, 2 and 3, respectively.

C7-10, C7-10B and C7-10R cell lines were cultivated at 28 °C in L-glutamine supplemented Leibovitz's L15 medium (Caisson Laboratories Inc., Logan, UT, USA) with 5.55 μM D-glucose, 2% MEM non-essential amino acids, 1% MEM vitamin solution and 10% heat-inactivated fetal bovine serum (Invitrogen). C7-10, C7-10B and C7-10R cells were passaged using the same methods shown for the 3H treatment (fig. 1A).
The C7-10B and C7-10R cell lines were generated using the shell vial method (Dobson et al., Reference Dobson, Marsland, Veneti, Bourtzis and O'Neill2002). Briefly, C7-10 cell monolayer was grown in a 48-well plate. For C7-10B, 1 ml of Aa23 cells from a confluent 25 cm2 flask were pelleted, resuspended in phosphate-buffered saline (PBS) and ground using a motorized pestle as described previously (Dobson et al., Reference Dobson, Marsland, Veneti, Bourtzis and O'Neill2002). For C7-10R, eggs from D. simulans (Riverside) (DSR) infected with wRi Wolbachia were collected, surface sterilized, rinsed with sterile water and crushed in PBS as described previously (Dobson et al., Reference Dobson, Marsland, Veneti, Bourtzis and O'Neill2002). Medium was removed from the C7-10 cells; the ground cells and crushed egg material were separately overlaid on top of the C7-10 cell monolayer, and the preparation was centrifuged at 2500 × g for 1 h at 15 °C. After centrifugation, fresh growth medium was added to the cells. Cells were incubated at 28 °C for four days, transferred to a six-well plate and after four days transferred to 25 cm2 culture flasks. To potentially increase the wRi infection in the cells (Zhou et al., Reference Zhou, Rousset and O'Neill1998), the shell vial method was repeated 38 days after the initial infection.
FISH and DAPI staining
Cell monolayers were grown on sterile cover slips (Fisherfinest™ Premium Cover Glass, Fisher Scientific, Pittsburgh, PA, USA) coated with concanavalin A (Vector Laboratories, Burlingame, CA, USA). Cells (0.5 ml) were seeded onto the coated cover slips in sterile six-well plates (Greiner Bio-One, Monroe, NC, USA) and fresh medium (1.5 ml) was added into the wells. Cells were incubated at 28 °C for ∼18 h without a change of medium.
FISH staining is similar to that previously described (Xi et al., 2005). Briefly, medium was removed and cells on cover slips were washed with PBS and fixed with cold 4% formaldehyde in PBS at room temperature (RT) for 15 min. The cover slips were then washed with PBS plus 0.1% Tween 20 and pre-hybridized for 1 h at RT with a buffer composed of 50% deionized formamide, 20% 20 × SSC (3 M sodium chloride, 0.3 M sodium citrate, pH 7.0), 1% 50 × Denhardts (Invitrogen), 10% 1 M dithiothreitol (DTT; BioChemika, Buchs, Switzerland), 0.25 mg ml−1 t-RNA (Sigma-Aldrich), and 0.25 mg ml−1 poly A (Sigma-Aldrich). Cells were hybridized in a moist chamber, consisting of an air tight plastic container with wet paper towels in the container, for 18 h at 37 °C with the pre-hybridization buffer plus 0.25 mg ml−1 ssDNA (Sigma-Aldrich), 0.2 g ml−1 dextran sulfate and 10 ng ml−1 of fluorescein-labeled oligonucleotide Wolbachia 16S rDNA probes, 5′-FACC AGA TAG ACG CCT TCG CC-3′ (Xi & Dobson, Reference Xi and Dobson2005) and 5′-FCTT CTG TGA GTA CCG TCA TTA-3′ (Heddi et al., Reference Heddi, Grenier, Khatchadourian, Charles and Nardon1999). After hybridization, cells were washed twice with 1× SSCD (SSC augmented with 10 mM DTT) at 42 °C, twice with 0.5 × SSCD at 42 °C, once with 0.5 × SSCD at 25 °C and once with deionized water at 25 °C.
Following FISH staining, cells were stained with 0.03% 4′,6-Diamidino-2-phenylindole hydrochloride [DAPI] (Fisher Scientific) for 5 min at RT, rinsed with water and air dried. The cover slips were mounted onto glass slides with VECTASHIELD® Mounting Medium (Vector Laboratories Inc.).
Elimination of Wolbachia from infected cells
Wolbachia-infected cell lines were tetracycline-treated to eliminate Wolbachia infection. Two 25 cm2 flasks were set up for each replicate; cells in one flask were treated with 10 μg ml–1 of tetracycline (Dobson et al., Reference Dobson, Marsland, Veneti, Bourtzis and O'Neill2002), while those in the other were untreated as control. The cells in the treated flask were subsequently tetracycline-treated three more times during the first three passages in an attempt to eliminate Wolbachia. The tetracycline treatment was replicated three times.
Quantification of Wolbachia infection and host cell measurements
Aa23, C7-10B and C7-10R cells were viewed under an Olympus IX70 fluorescence microscope at 100× magnification. Images were captured under the Olympus filters U-M516 for fluorescein and U-M536 for DAPI using Magnafire software (Optronics, Goleta, CA, USA) and merged by forming a z-series using ImageJ software (National Institutes of Health, Bethesda, MD, USA). ImageJ software was used to measure the perimeter of mosquito cells and to calculate cell area. To quantify Wolbachia infection level in cell culture, a sampling approach was developed in which 45 cells per cover slip were randomly selected prior to Wolbachia visualization. Subsequently, the number of Wolbachia per cell was visualized and counted using the U-M516 filter.
DNA extraction and PCR
Cells (1 ml) were pelleted by centrifuging at 14,000 × g and DNA was extracted as described (Dobson et al., Reference Dobson, Marsland, Veneti, Bourtzis and O'Neill2002). Briefly, cells were resuspended in 100 μl of sodium chloride Tris EDTA (STE) buffer (10 mM Tris-HCl, pH 8.0, 0.1 M NaCl, 1 mM EDTA); 2 μl of 10 mg ml–1 proteinase K (Invitrogen) was added and incubated at 55 °C for one hour and at 100 °C for 10 min. Samples were centrifuged at 14,000 × g for 5 min. Supernatant was removed and used for PCR amplifications.
Wolbachia surface protein (wsp) strain-specific primers were used to detect wRi (169F/691R) in C7-10R and wAlbB (183F/691R) (Zhou et al., Reference Zhou, Rousset and O'Neill1998) in C7-10B and Aa23. Primers specific for insect mitochondrial 12S rRNA (12SA1/12SB1) (O'Neill et al., Reference O'Neill, Giordano, Colbert, Karr and Robertson1992) were used as a control for template quality (i.e. to confirm that high quality DNA was present in Wolbachia-negative samples). PCR conditions for the above reactions are as previously described (O'Neill et al., Reference O'Neill, Giordano, Colbert, Karr and Robertson1992; Zhou et al., Reference Zhou, Rousset and O'Neill1998). Drosophila oskar gene primers oskF2 (5′-CGM ATG GAG CTR AAA TGC CG-3′) and oskR1 (5′-GCT KCG KAT AAA CTT GTT GAA TC-3′) were used to detect D. simulans DNA. The PCR conditions for the oskar primers were: 4 min at 94 °C, 36 cycles of 1 min at 94 °C, 1 min at 50 °C, 1 min at 72 °C and 10 min at 72 °C. Two microliters of DNA extract were used for each PCR reaction. PCR amplicon was visualized by running 7.5 μl of the PCR reaction on a 1% ethidium bromide pre-stained agarose gel.
Statistical analyses
For reliability of Wolbachia estimation methods, the actual and estimated mean Wolbachia density values were statistically compared using a linear regression analysis, and Pearson's coefficient of regression (R2) was determined. Data for host cell size and overall infection level were tested for normality using the Kolmogorov-Smirnov test prior to statistical analyses. For host cell size, log transformation was used to normalize cell size data and the data were analyzed using either t-test or ANOVA followed by Fisher's PLSD test. Data for overall infection level were not normally distributed, could not be normalized and were analyzed using Mann-Whitney test.
Results
Passaging effect on Wolbachia infection level in Aa23
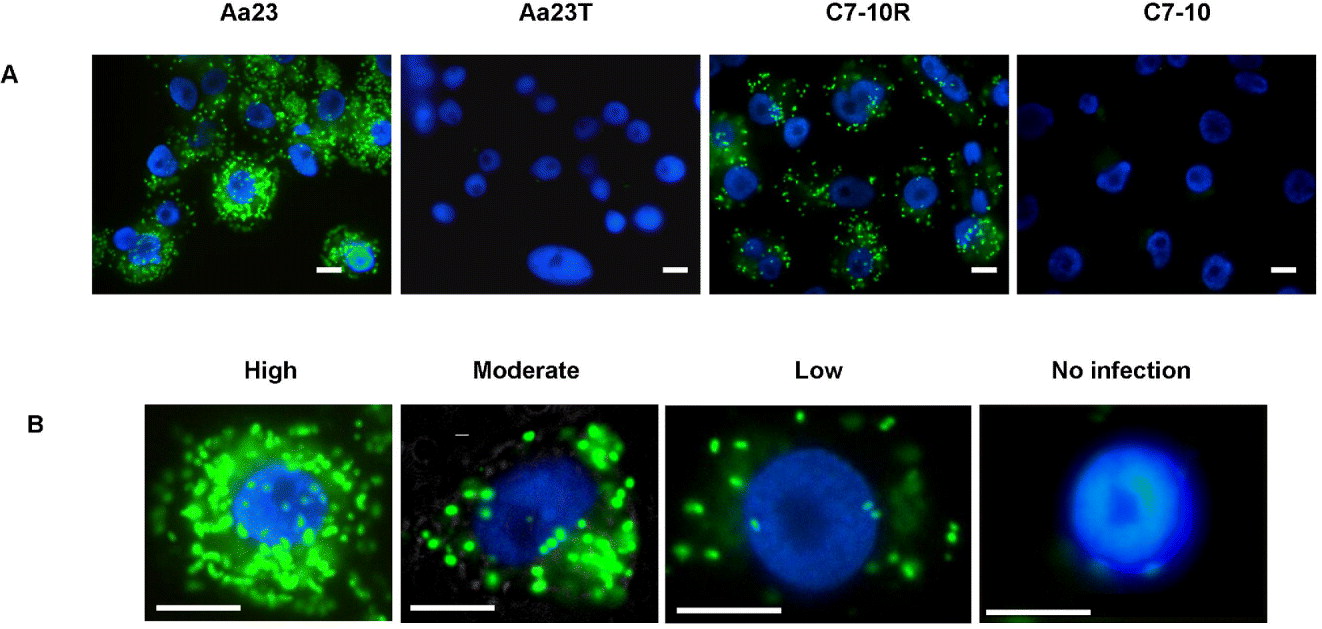
FISH staining was used to detect and stain Wolbachia in the Aa23 cell culture. Wolbachia appeared as punctate green dots due to the fluorescein marker that is attached to the FISH probes (fig. 2A). Uninfected cell culture (Aa23 T) did not show similar fluorescence, demonstrating that the FISH probes are Wolbachia-specific. Subsequently, FISH assay was used as a tool to visualize and characterize Wolbachia infection in A. albopictus cell cultures. The FISH assay is a more precise method for monitoring Wolbachia infection per cell compared to qPCR, which measures total Wolbachia DNA in a homogenate of cells rather than in individual cells.
Fluorescence in situ hybridization (FISH) staining of Aa23 and C7-10R cell cultures. (A) Wolbachia stained as green punctate dots in Aa23 and C7-10R cells. No Wolbachia staining in uninfected Aa23 T and C7-10 cells. (B) Variation in Wolbachia infection level in Aa23 cells, as shown by FISH staining. Host cell nuclei are stained blue using DAPI stain. Scale bar = 1 μm. (Please see online for a colour version of this figure.)

The 7H treatment (fig. 1A) was the initial method used to passage the Aa23 cell culture and is analogous to that previously described (Makepeace et al., Reference Makepeace, Rodgers and Trees2006). In our hands, this passaging method resulted in substantial fluctuation of Wolbachia infection level (fig. 1B). To test the hypothesis that alternate passaging protocols might improve infection stability, three additional passaging regimes were examined (fig. 1A). The passaging treatments differed in the level of cell dilution upon passaging, mosquito cell growth rate and timing between passages.
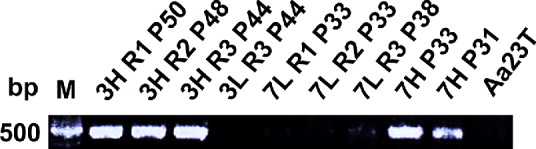
Differences in Wolbachia infection levels among the treatments, as well as temporal fluctuations within treatments, were observed (fig. 1B). Notably, the 7L and 3L regimes repeatedly failed to sustain Wolbachia infection beyond eight passages. The absence of Wolbachia infection from the 7L and 3L treatments, as determined by FISH staining, was confirmed via PCR (fig. 3). In contrast, the 7H and 3H treatments sustained Wolbachia infection throughout the study. However, while means of approximately 50 and 25 Wolbachia per cell were observed for the 7H and 3H treatments, respectively, the infection level varied greatly: from five to 70 Wolbachia per cell (fig. 1B). The cells of the 7H treatment had an overall Wolbachia infection level that is significantly higher than the level of the 3H treatment (Mann-Whitney U = 34,560, n 7H = 225 n 3H = 584, P < 0.0001 two-tailed).
wAlbB Wolbachia infection in Aa23 cells under the four passaging regimes (3H, 3L, 7H and 7L). PCR amplifications were conducted using the primer set specific for the wAlbB infection. PCR showed that the 7L and 3L regimes failed to sustain Wolbachia infection, but the 3H and 7H regimes successfully sustained Wolbachia infection. Replicates 1 and 2 of the 3L regime were not assayed because the cells were contaminated and had to be discarded prior to the PCR assay. P, passage number; R, replicate number; Aa23 T, Aa23 cells treated with tetracycline.

Wolbachia estimation
Data for the preceding experiment were based upon counting FISH-stained Wolbachia per mosquito cell and then averaging across the 45 quantified cells. To simplify additional experiments, an estimation approach was examined. Specifically, instead of counting, mosquito cells were assigned to four categories, based upon a visual estimation of the Wolbachia infection level in FISH-stained cells: uninfected (U), low (L), intermediate (M) and high (H) (fig. 2B). We used the Wolbachia counts of ‘5’, ‘30’ and ‘71’ to represent low, intermediate and high infections, respectively. Subsequently, the overall infection level per cell was calculated using the following formula:
 $$Infection = \displaystyle{{5L \cdot 30{\kern 1pt} M \cdot 71{\kern 1pt} H} \over T}$$
where: L, number of ‘low’ cells; M, number of ‘intermediate’ cells; H, number of ‘high’ cells; U, number of ‘uninfected’ cells; T, total cells = [U + L+M + H].
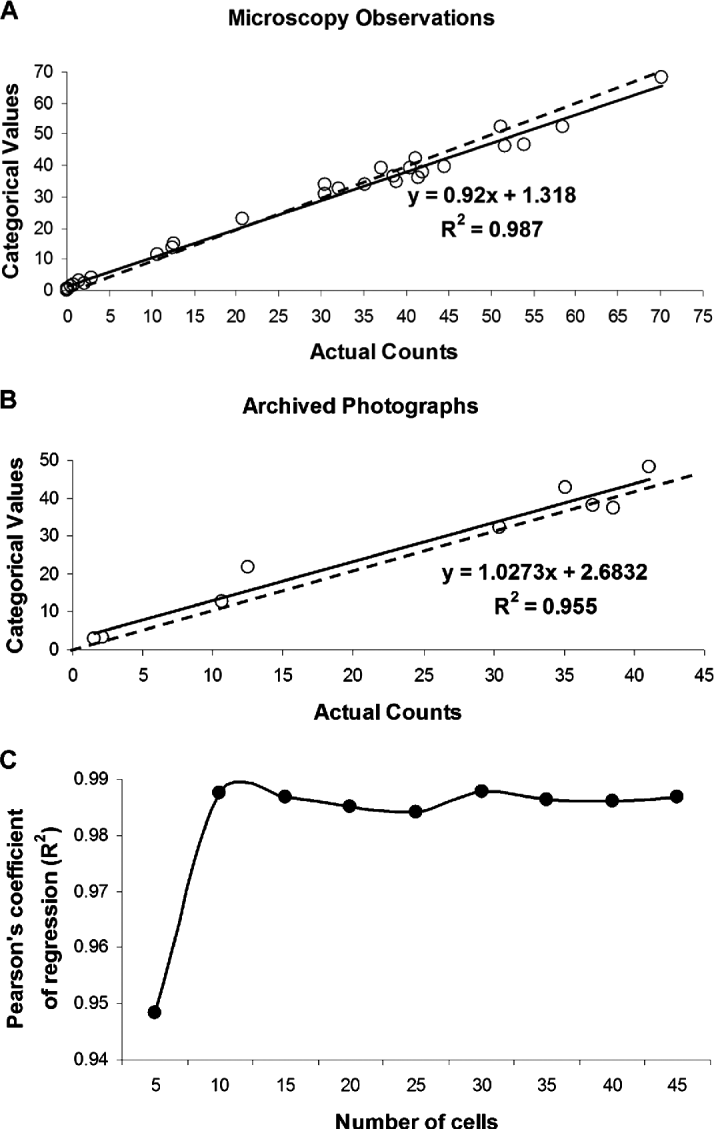
The infection level estimated using categories was compared to the infection level determined from the actual Wolbachia counts from 45 cells as described above (fig. 4A). Regression analysis, comparing the counting versus the estimation method, is highly significant regardless of whether estimates are based upon direct microscopic examination (R2 = 0.987; F = 127.7; df = 1, 28; P < 0.0001) or photographs (R2 = 0.955; F = 148.4; df = 1, 7; P < 0.0001) (fig. 4B). Furthermore, the estimation method demonstrates the technique can be predictive of the overall infection level when fewer than 45 cells are measured (fig. 4C). Specifically, the value of the Pearson's coefficient of regression (R2), remained larger than 0.98 when the sample size was between ten and 45 cells. Fewer than ten cells were not predictive of the overall infection level (fig. 4C).
Correlation between Wolbachia counts and estimates. (A) Scatter plot of mean Wolbachia estimates using categorical values versus actual Wolbachia counts via microscopic observation and (B) a similar scatter plot using archived photographs. The solid line represents the best fit line for the data. The dashed line represents predicted best fit line assuming that categorical values equal actual counts. (C) Pearson's coefficient of regression (R2) values of regression analysis when differing sample sizes were used.

Establishment of wAlbB and wRi Wolbachia infection in the C7-10 cell line
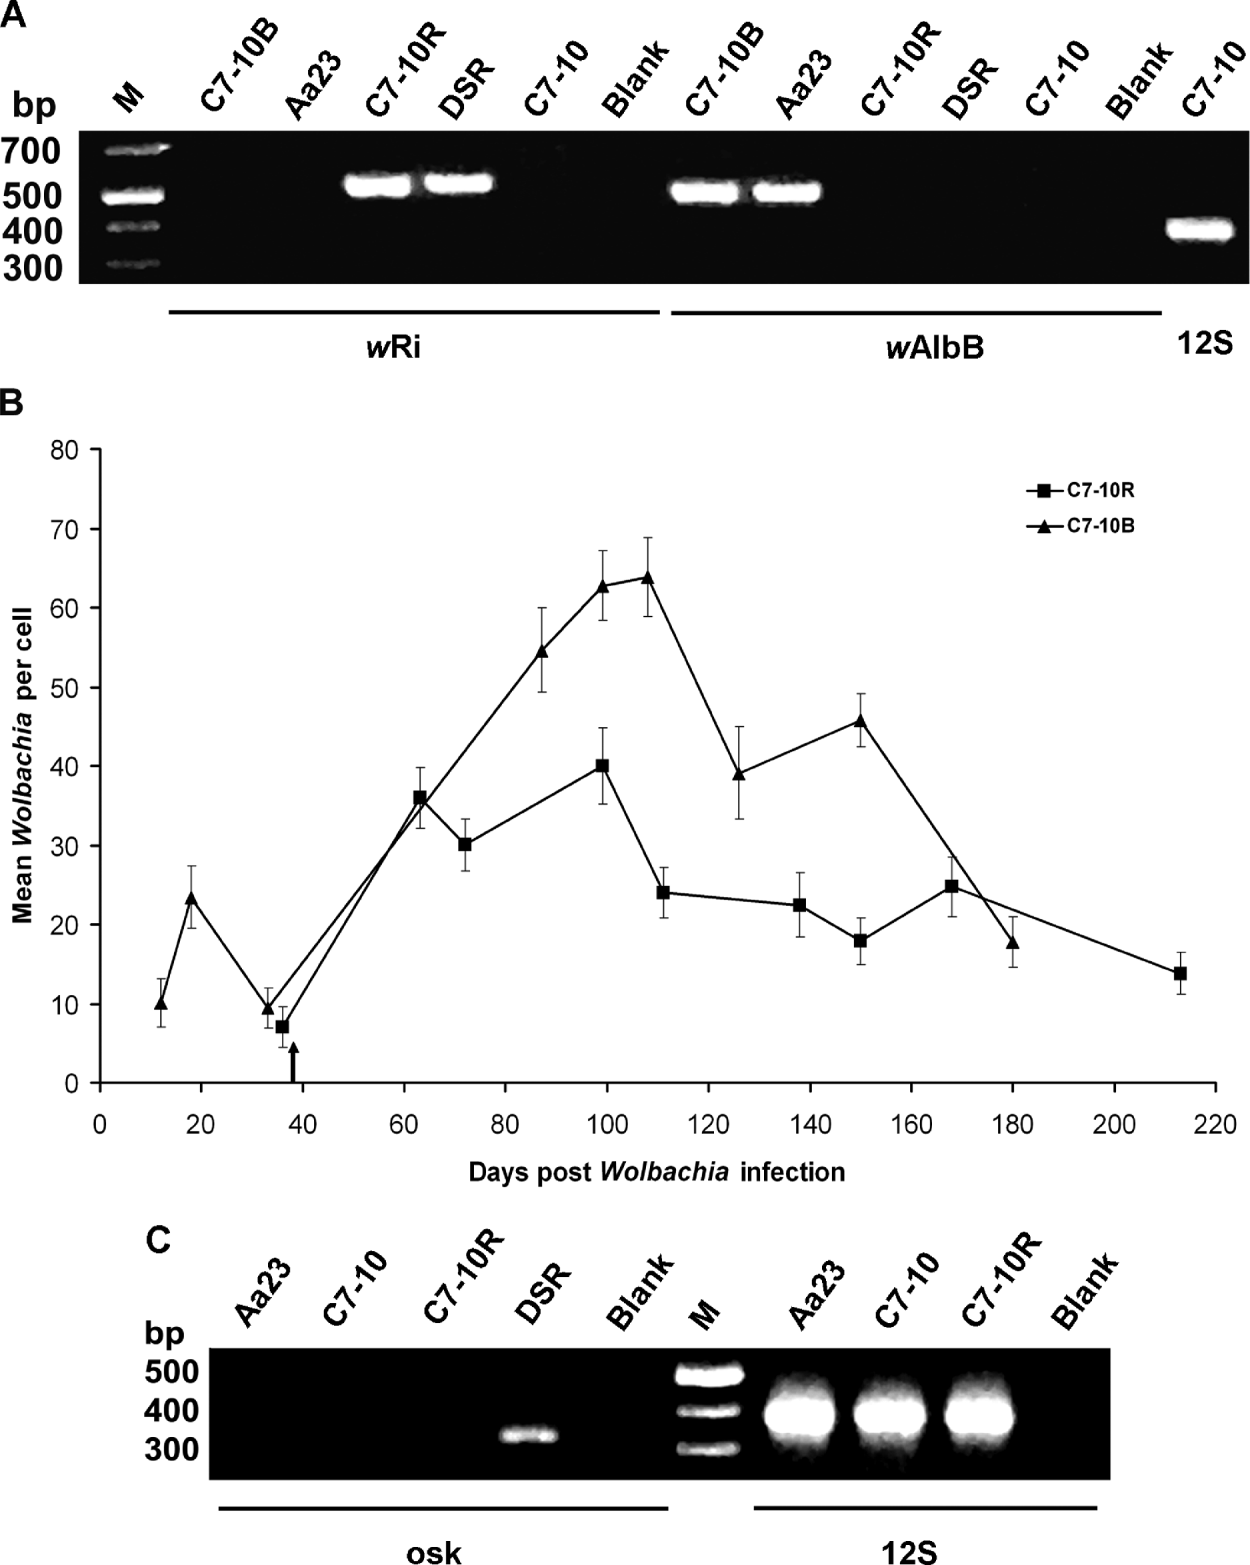
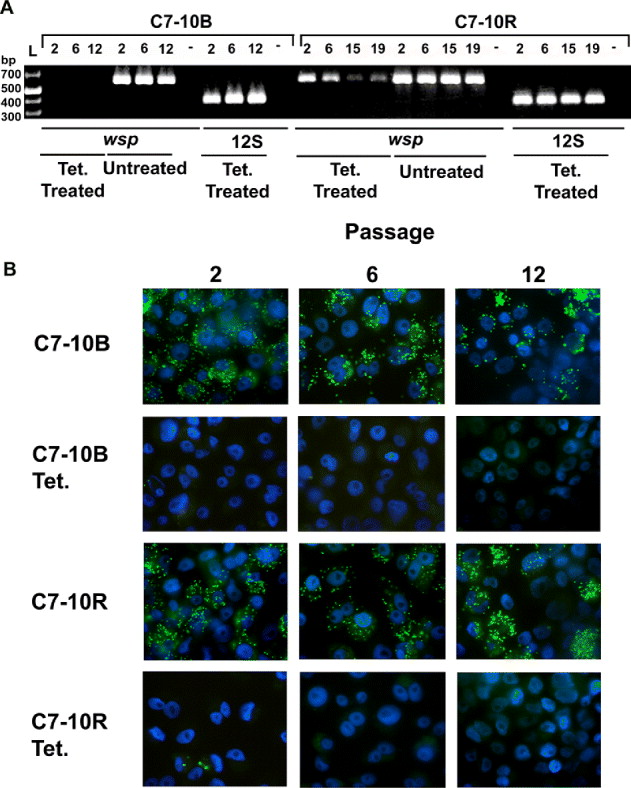
A second approach to ameliorate infection variability involved separately establishing the wAlbB and wRi Wolbachia infections in the C7-10 clonal cell line. Following the introduction of the wAlbB and wRi into C7-10 cells, FISH (fig. 2A) and PCR (fig. 5A) demonstrated the persistence of infection in the C7-10B and C7-10R lines for over 148 passages, when the study was ended. To test whether FISH and PCR were detecting live Wolbachia, tetracycline was used to eliminate (kill) Wolbachia in C7-10B and C7-10R cells. Cells that were treated with tetracycline showed rapid decrease in PCR amplification signal and FISH staining with passage post treatment (fig. 6). LIVE/DEAD BacLight™ Bacterial Viability kit (Invitrogen) was also used to detect live and dead Wolbachia in the cells. Very few (∼1%) dead Wolbachia were detected in the wAlbB and wRi-infected cells (data not shown). Characterization of the C7-10B and C7-10R lines via FISH-staining revealed a rapid increase in infection level following the initial and secondary introductions of wAlbB and wRi. For the latter 100 days of observations, the wRi infection level displayed greater consistency relative to the Wolbachia infection observed in the C7-10B cell line (fig. 5B). However, the overall Wolbachia infection level in the C7-10R line is lower than that of Aa23 and C7-10B, with a mean of approximately 20 Wolbachia per cell. To date, both the C7-10B and C7-10R cell lines have consistently maintained their infection levels without any obvious decrease in infection.
wRi Wolbachia infection in C7-10 cells. (A) PCR amplifications using primer sets specific for the wRi and wAlbB infections. PCR amplification using the 183F/691R primer set indicates that the C7-10 and C7-10R cell lines are not infected with wAlbB (no cross contamination of infections). (B) Wolbachia infection in C7-10B and C7-10R cells characterized via FISH staining. Wolbachia infection levels are expressed as mean (±SE) [estimated based upon categorical assignment]. The arrow indicates the second wRi shell vial infection. (C) PCR amplification using oskar Drosophila-specific primers. The absence of an amplicon in C7-10R cells supports the hypothesized absence of Drosophila cells (i.e. Drosophila cells not established along with mosquito cells in the C7-10R cell culture). Primers specific for insect mitochondrial 12S rRNA (12S) were used to confirm DNA template quality. DSR, wRi-infected Drosophila simulans (Riverside); M, 1 kb molecular marker; Blank, water blank as negative control.

(A) PCR and (B) FISH staining of C7-10B and C7-10R cells with and without tetracycline (Tet.) treatment. PCR and FISH showed that after two passages post tetracycline treatment, Wolbachia DNA was absent from the C7-10B cells. However, for C7-10R, Wolbachia DNA, although not observed by FISH, was present when PCR-assayed, showing a decrease with time (passages) after tetracycline treatment. Numbers on top of gel indicate the passage number after cells were treated with tetracycline. Wsp primers were used to test the presence of Wolbachia DNA in host cells. Primers specific for insect mitochondrial 12S rRNA (12S) were used to confirm DNA template quality. Green punctate dots represent Wolbachia infection in FISH-stained micrographs. Nuclei were stained blue with DAPI. (Please see online for a colour version of this figure.)

To test for the possibility that D. simulans cells became established in the C7-10R cell culture (i.e. ‘host cell carryover’), primers specific for the oskar gene of D. simulans were used to amplify total DNA extracts. An oskar amplification product was obtained from D. simulans flies but not from C7-10 or C7-10R (fig. 4C). Thus, there was no evidence for D. simulans cells within the C7-10R line.
Host cell size and Wolbachia infection
For the Aa23, C7-10B and C7-10R cell lines, cells in the infected lines were significantly larger than uninfected cells. Specifically, infected Aa23 cells (234 ± 11.2 μm2; mean ± SE; n = 120 cells) were significantly larger than uninfected Aa23 T cells (199 ± 8.5 μm2; mean ± SE; n = 120 cells) (t = 2.448, df = 238, P = 0.015; t-test after log transformation). Similarly, Wolbachia-infected C7-10B and C7-10R cells (351 ± 15.3 μm2; mean ± SE; n = 55 cells and 220 ± 7.3 μm2; mean ± SE; n = 54 cells) were significantly larger than uninfected C7-10 cells (192 ± 8.4 μm2; mean ± SE; n = 54 cells) (F = 56.994, df = 147, P < 0.0001).
Discussion
FISH staining of Aa23 confirms prior reports of Wolbachia infection level variability within this cell culture. Examination of different passaging regimes showed that the Wolbachia infection level can be impacted by cell passaging technique. Most dramatically, two of the passaging regimes (3L and 7L) resulted in the loss of Wolbachia infection. In two additional regimes (3H and 7H), the Wolbachia infection was sustained, albeit with substantial variation in Wolbachia infection level. Variation in infection level could be linked to host cell density. In a prior study, Wolbachia density was observed daily as host cells increased in density (Fallon, Reference Fallon2008). This report described the gradual increase in Wolbachia abundance with increasing cell number in culture. Wolbachia was also observed to rapidly accumulate when the cell culture deteriorated (i.e. cells have passed the confluence level and start to die). In the 3H and 7H cultures, since cells are grown to a higher cell density compared to the 3L and 7L cultures, cells might start to die due to overcrowding when the culture has passed the confluence level. These cells, based on the previous hypothesis (Fallon, Reference Fallon2008), might liberate precursors, which could include chemical compounds that precede compounds used in metabolic pathways of Wolbachia. These precursors are scavenged by Wolbachia for growth and metabolism.
Additional experiments are needed to better understand the mechanisms responsible for infection variations. For example, the role of host cell replication rate on Wolbachia infection level should be investigated. A previous report (Ruang-areerate et al., Reference Ruang-areerate, Kittayapong, McGraw, Baimai and O'Neill2004) demonstrated that Wolbachia numbers decrease in diapausing mosquitoes due to lack of host cell replication, but Wolbachia numbers increased during embryonation when host cells are actively replicating. The effects of host cell crowding, age of host cell and quality of the cell culture medium on Wolbachia infection level should also be investigated. Similarly, prior work with Rickettsia tsutsugamushi in cell culture demonstrated that complex cell culture medium containing serum, chick embryo extract and colchicine (an alkaloid) were essential for the growth and proliferation of R. tsutsugamushi (Hopps et al., Reference Hopps, Jackson, Danauskas and Smadel1959).
The variation in Aa23 Wolbachia infection level is an important consideration in the design of experiments. For example, the Aa23 infection in the 7H treatment was observed to drop to a low level and then rebound quickly (fig. 1B). This variation has the potential to complicate experimental interpretation. As an example, Wolbachia has formed obligate mutualistic relationships with multiple filarial nematodes. Eliminating Wolbachia infection results in nematode sterility and death; as a result, Wolbachia has become a target for anti-filarial strategies (Bandi et al., Reference Bandi, McCall, Genchi, Corona, Venco and Sacchi1999; Hoerauf et al., Reference Hoerauf, Nissen-Pähle, Schmetz, Henkle-Dührsen, Blaxter, Büttner, Gallin, Al-Qaoud, Lucius and Fleischer1999; Langworthy et al., Reference Langworthy, Renz, Mackenstedr, Henkle-Dührsen, de Bronsvoort, Tanya, Donnelly and Trees2000). Researchers have used Wolbachia-infected cell culture as a tool to test the effectiveness of different antibiotics on Wolbachia infection (Hermans et al., Reference Hermans, Hart and Trees2001; Fenollar et al., Reference Fenollar, Maurin and Raoult2003b; Makepeace et al., Reference Makepeace, Rodgers and Trees2006) and potentially to study the interaction between Wolbachia and arthropod-borne viruses that are transmitted by A. albopictus (Voronin et al., Reference Voronin, Tran-Van, Potier and Mavingui2009). Aa23, being the first Wolbachia-infected cell culture developed, has been the most widely used cell culture for antibiotic testing. Therefore, characterization of Aa23 is important for setting parameters involving cell culture passaging and maintenance that promote persistent Wolbachia infection at a constant level. Based on our results, variation in Wolbachia infection in C7-10R was the least (between 14 and 40 Wolbachia per cell) compared to Aa23 (between six and 57 Wolbachia per cell) and C7-10B (between nine and 64 Wolbachia per cell). The improved consistency of the Wolbachia infection level in the C7-10R culture could provide greater stability and repeatability for additional tests.
Cell size was observed to increase with increase of Wolbachia load in the cell. This pattern was observed with the Aa23, C7-10B and C7-10R cells. This observation is analogous to that seen in a human cell line that showed a correlation between cell size and the infection level of intracellular viruses – human papillomavirus (Garner-Hamrick & Fisher, Reference Garner-Hamrick and Fisher2002) and human cytomegalovirus (Crowe et al., Reference Crowe, Maglova, Ponka and Russell2004). In the latter study, increasing cell size was attributed to an accumulation of iron in cells infected with human cytomegalovirus. Additional experiments are necessary to define the impact of Wolbachia infection on host cell size.
FISH staining is shown to be a useful method for monitoring and quantifying Wolbachia infection level in cell cultures. FISH staining of uninfected cultures demonstrates a minimal level of background artifacts, unlike giemsa, which can stain mitochondria, nuclei, bacteria-like structures and endocellular compartments in eukaryotic cells, complicating subsequent analyses (Fallon, Reference Fallon2008). Furthermore, while qPCR allows an overall assessment of infection level (Voronin et al., Reference Voronin, Tran-Van, Potier and Mavingui2009), the FISH approach allows visualization of Wolbachia infection level in an individual cell and visualization of the variability of infection level among individual host cells.
In summary, differing cell passaging regimes were observed to impact Wolbachia infection levels in Aa23 cells, with some regimes resulting in the loss of Wolbachia infection. Furthermore, none of the passaging regimes described in this study resulted in a consistent Wolbachia infection level in Aa23. Infection of the C7-10 clonal cells line with wAlbB did not decrease the variability in infection level for the Wolbachia strain. In contrast, wRi Wolbachia infection established in the clonal C7-10 cell line displayed less variability, which suggests that the C7-10-wRi combination is a more stable in vitro model system for studying Wolbachia interactions with insect host cells.
Acknowledgements
We thank S.L. O'Neill (University of Queensland, Queensland, Australia) for the Aa23 cells and A.M. Fallon (University of Minnesota, St Paul, MN, USA) for the C7-10 cells. This work was supported by NIH/NIAID R01-AI067434 and R01-AI051533. This is publication 10-08-088 of the University of Kentucky Agricultural Experiment Station.