







1. Introduction
One of the important aspects of fluid dynamics research from a practical point of view is the control of the near-wall turbulence in wall-bounded flows. Industrial devices where such flows appear can benefit significantly from reduction in friction, or, when necessary, increase in turbulent mixing. In the last three decades, significant effort has been made to understand the mechanisms of control in canonical turbulent flows (including flows in pipes, channels and boundary layers). One of the most successful control strategies is to interfere with the near-wall turbulent cycle, suppressing the formation of streamwise vortices close to the wall and their interaction with streaks of streamwise velocity. This strategy can be implemented via modification of the wall surface by riblets (García-Mayoral & Jiménez Reference García-Mayoral and Jiménez2011), active modification of the near-wall flow by blowing and suction (opposition control; Choi, Moin & Kim Reference Choi, Moin and Kim1994), or near-wall spanwise oscillations (Quadrio & Ricco Reference Quadrio and Ricco2004, among others). Despite the theoretical progress, practical implementation of these strategies is scarce. In the case of riblets, their technical maintenance is difficult and their relative efficiency reduces with increasing Reynolds number (Spalart & McLean Reference Spalart and McLean2011). Spanwise wall oscillations give promising 40 % drag reduction (Quadrio & Ricco Reference Quadrio and Ricco2004), but there is evidence that secondary circulation at the sidewalls impedes reaching this value in experiments (Straub et al. Reference Straub, Vinuesa, Schlatter, Frohnapfel and Gatti2017). Opposition flow control consists of measuring wall-normal (or spanwise) velocity at the detection plane  $y_d$ and opposing it at the wall, and gives up to 20 % friction drag reduction (Choi et al. Reference Choi, Moin and Kim1994). This robust control method creates a ‘virtual-wall’ effect, manifested by a minimum in the turbulent intensity profile of the controlled velocity component. The virtual wall expels small quasi-streamwise vortices away from the wall (Jiménez Reference Jiménez1994) and reduces the vertical transport of streamwise momentum near the wall, diminishing drag (Hammond, Bewley & Moin Reference Hammond, Bewley and Moin1998). Kim & Lim (Reference Kim and Lim2000) identified a possible linear physical mechanism of this reduction, relating the suppression of the spanwise variation of velocity in opposition control to weakening of the linear coupling between wall-normal velocity and vorticity near the wall. The control strategy proposed by Choi et al. (Reference Choi, Moin and Kim1994) soon became a benchmark for optimal flow control strategies (Bewley, Moin & Temam Reference Bewley, Moin and Temam2001), as well as other physics-motivated methods employing wall-based sensors of shear stress or vorticity fluxes (Lee et al. Reference Lee, Kim, Babcock and Goodman1997; Koumoutsakos Reference Koumoutsakos1999). Early experiments approached its implementation by blocking sweep and ejection events near the wall with wall-normal jets (Rebbeck & Choi Reference Rebbeck and Choi2001, Reference Rebbeck and Choi2006), but these were limited to just one spatially localized pair of a detector and an actuator.
The principal difficulties in the practical implementation of opposition flow control are the actuation times and the need for flow reconstruction. Consider, for example, the classic set-up of Choi et al. (Reference Choi, Moin and Kim1994). It requires observations of the velocity field in the buffer layer ( $y^+ \approx 10$) and actuation at the wall on the same scales. Here superscript ‘
 $+$’ denotes wall units, defined in terms of kinematic viscosity
 $\nu$ and friction velocity
 $u_\tau$. The characteristic energetic length scales at this height are
 $\lambda ^+_x \approx 1000$ (streamwise) and
 $\lambda ^+_z \approx 100$ (spanwise). The passing time of these eddies is of the order of milliseconds and they are too fast to be detected and opposed in experiments due to the resolution restrictions of the measuring sensors and actuators. Also, a grid of sensors and actuators with spacing less than a millimetre between them renders the control scheme impracticable. This draws our attention away from the buffer layer to the logarithmic layer control, where turbulent structures, with lifetimes of the order of seconds, could indeed be detected and controlled. The recent work of Ibrahim, Guseva & Garcia-Mayoral (Reference Ibrahim, Guseva and Garcia-Mayoral2020) showed that complete removal of large scales in the logarithmic layer results in a positive, outward shift of the mean velocity profile, equivalent to drag reduction. Also, the recent Monte Carlo experiment of Pastor, Vela-Martin & Flores (Reference Pastor, Vela-Martin and Flores2020) suggests that a single actuator, localized in space and located above
 $y^+ = 50$, could reduce drag by 3–4 %, by opposing vertical motions near the wall.
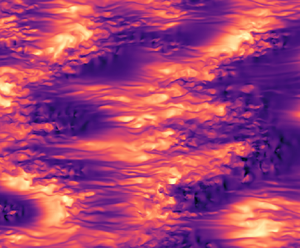
The second difficulty in implementing opposition flow control is that, unlike in experiments or numerical simulations, information about the flow above the wall is usually not available in the real world. This constrains our knowledge about the velocity field above the wall to flow reconstructions based only on the wall measurements (Oehler, Garcia-Gutiérrez & Illingworth Reference Oehler, Garcia-Gutiérrez and Illingworth2018; Encinar & Jiménez Reference Encinar and Jiménez2019). The main problem of such flow reconstructions is the lack of fidelity far from the wall. The wall is impacted mostly by attached eddies, and their size grows with the distance from the wall. The linear stochastic estimation (LSE) of Encinar & Jiménez (Reference Encinar and Jiménez2019) showed that, the farther from the wall, the less information about small-scale flow structure is accessible. Only scales of wall-normal velocity comparable to the channel height  $h$ can be reconstructed with less than 50 % error in the logarithmic layer. As an illustration of this problem, figure 1(a) shows a typical instantaneous snapshot of the wall-normal velocity at
 $y/h=0.1$, where small structures exist alongside large ones. In figure 1(b), that snapshot has been filtered with a Gaussian low-pass filter at the length scales
 $\lambda _x/h >1$ and
 $\lambda _z/h > 0.6$. On top of it, the contours of the LSE reconstruction done with the algorithm of Encinar & Jiménez (Reference Encinar and Jiménez2019) are added, and they coincide with the large velocity structures reasonably well.
(a) Instantaneous snapshot of wall-normal velocity at  $y/h = 0.1$. (b) Wall-normal velocity from panel (
 $a$) filtered with a low-pass Gaussian filter on the controlled wavelengths (shaded) with the LSE reconstruction from Encinar & Jiménez (Reference Encinar and Jiménez2019) on top (contours).
 $Re_{\tau } = 932$.

Despite the need of a control strategy for the structures in the logarithmic layer of wall-bounded turbulent shear flows, its implementation is non-trivial. It has long been known that the performance of opposition control deteriorates if the detection plane is lifted above an optimal location of  $y_d^+ = 15$ (Choi et al. Reference Choi, Moin and Kim1994; Hammond et al. Reference Hammond, Bewley and Moin1998), which can even result in drag increase. Hammond et al. (Reference Hammond, Bewley and Moin1998) related this effect to the inability of the control to establish a virtual wall by allowing high-momentum fluid to be drawn into the region between the detection plane and the wall. This effect can be understood by considering linear mechanisms supporting turbulence in the flow, since a significant part of the dynamics originates from the interaction of turbulent fluctuations with the mean shear through transient growth (Butler & Farrell Reference Butler and Farrell1992; Del Alamo & Jiménez Reference Del Alamo and Jiménez2006).
For a channel flow subject to opposition control, Lim & Kim (Reference Lim and Kim2004) showed that the transient growth weakened when  $y_d$ was located in the buffer layer close to the wall, and significantly increased if
 $y_d$ was chosen too far away from it. Chung & Talha (Reference Chung and Talha2011) showed that this effect could be mitigated partially by decreasing the amplitude of actuation. Lee (Reference Lee2015) later introduced an upstream spatial shift between detection and actuation which improved control performance.
On the other hand, modifying the boundary conditions at the wall can also affect the stability properties of the flow. Introducing wall transpiration permits momentum exchange in the  $y$-direction, often destabilizing otherwise linearly stable flows. An early study of drag increase in turbulent flows over porous surfaces relates the appearance of large spanwise rollers to an inviscid Kelvin–Helmholtz instability (Jiménez et al. Reference Jiménez, Uhlmann, Pinelli and Kawahara2001). The same effect destroys the drag-reducing behaviour of riblets when their characteristic size and spacing are more than 10–15 wall units (García-Mayoral & Jiménez Reference García-Mayoral and Jiménez2011). Toedtli, Yu & McKeon (Reference Toedtli, Yu and McKeon2020) reported the presence of spanwise rollers and linear instability in a channel flow with opposition control of the buffer layer for certain parameters of actuation.
Furthermore, Jiménez et al. (Reference Jiménez, Uhlmann, Pinelli and Kawahara2001) opens a discussion about another mechanism of drag increase in turbulent flows with transpiring walls, which can be active even if the flow is linearly stable. If the flow is forced at a frequency close to the real part of one of its linear eigenvalues, the response of the system can be quite large. The ‘response–forcing’ framework was generalized for turbulent pipe flow by the resolvent analysis of McKeon & Sharma (Reference McKeon and Sharma2010), who proposed to decompose the velocity field into a series of optimal response and forcing modes with different frequencies, and to rank them by their importance. Later, resolvent analysis was adapted to the study of opposition control by Luhar, Sharma & McKeon (Reference Luhar, Sharma and McKeon2014), who found that opposition control with the detection plane at  $y_d^+=10$ suppresses slow response modes localized near the wall, but amplifies faster detached modes. To counteract the latter, Luhar et al. (Reference Luhar, Sharma and McKeon2014) proposed to employ a phase lag
 $\phi$ between sensor and actuator. It was shown by Luhar et al. (Reference Luhar, Sharma and McKeon2014) that negative phases, equivalent to shifting control downstream with respect to ‘classic’ opposition, result in some improvement of performance. On the contrary, shifting control positively in phase (i.e. upstream) results in unwanted increase of drag.
Toedtli, Luhar & McKeon (Reference Toedtli, Luhar and McKeon2019) confirmed the capability of the resolvent model to predict friction drag in direct numerical simulations (DNS), showing that an optimal negative phase  $\phi = -{\rm \pi} /4$ allows the detection plane to be slightly shifted up to
 $y_d^+ = 24$. The results of Luhar et al. (Reference Luhar, Sharma and McKeon2014) and Toedtli et al. (Reference Toedtli, Luhar and McKeon2019) are also in agreement with the conclusion of Pastor et al. (Reference Pastor, Vela-Martin and Flores2020) that locating a localized sensor upstream improves control performance. This improvement is probably produced by cancelling an additional streamwise lag between the control and the detection plane, introduced by the downstream advection of velocity structures by the flow. The advection velocity of the large flow scales is approximately equal to the mean velocity at their wall-normal location (Jiménez Reference Jiménez2018).
The motivation of this work is to extend opposition flow control to the large scales of the flow with the detection plane in the log layer, i.e. to the scales that can be both observed and controlled. We analyse the effect of the control on the large scales with DNS in fully turbulent channel flow ( $Re_\tau = 930$). We explore the possibility to affect the eddies of relatively large wavelengths (
 $\lambda /h > 0.1$) by acting from the wall, and thus to alter the friction created by their presence. As a side note, we do not attempt to perform linear optimal flow control. There exists a substantial body of work on linear optimal control for flows that are close to transition to turbulence (Bewley & Liu Reference Bewley and Liu1998), but application of this theory to fully turbulent flows is not straightforward. The aim of the optimal linear control is to return the flow back to a (low-drag) unstable state. The turbulent mean profile is the result of nonlinear interactions of turbulent flow fluctuations, and is a high-drag state. Linearization around it will not necessarily yield the same results as in near-transitional flows. Nevertheless, Oehler & Illingworth (Reference Oehler and Illingworth2020) applied this technique to the turbulent mean profile in a channel and found that the best performance is achieved when the actuator and sensor planes are both located at
 $y/h=0.3$. While this location is feasible for measurement, it is not very practical for actuation, which is most easily implemented at the wall.
This paper is structured as follows. We begin by describing the computational set-up and the numerical methods used in the DNS and the linear stability analysis in § 2. Then § 3 presents the DNS results of the flow affected by the large-scale control. In § 4 we show how the presence of the control affects the linear stability of the simplified channel flow without viscosity, including the theoretical implications of imposing the control. A more realistic linear model including turbulent viscosity is analysed in § 5. In § 6 we exploit linearized flow dynamics to explain part of the DNS results from § 3. To clarify the rest, we employ amplified responses of the linearized flow to the control in § 7. Finally, § 8 presents a discussion of the results and conclusions.
2. Numerical experiments
2.1. Direct numerical simulations
To assess the possibility of large-scale flow control, we simulate turbulent flow in a channel with DNS. In the following,  $u, v, w$ (and
 $\omega _x, \omega _y, \omega _z$) denote the velocity (and vorticity) components in the streamwise (
 $x$), wall-normal (
 $y$) and spanwise (
 $z$) directions, respectively. Our numerical scheme is similar to that of Kim, Moin & Moser (Reference Kim, Moin and Moser1987). We solve equations for the Laplacian of the wall-normal velocity
 $\nabla ^2 v$ and for the wall-normal vorticity
 $\omega _y$, which are coupled in the nonlinear terms. The advantage of this formulation is that the pressure is eliminated from the equations, and no boundary conditions for pressure are needed. The computational box is periodic in the wall-parallel directions, and this periodicity allows solutions to be represented in the form of Fourier harmonics in
 $x$ and
 $z$,
 \begin{equation} \left. \begin{aligned} v (x,y,z,t) & = \sum_{k_x, k_z} \hat{v}(t, y, k_x, k_z) \exp({\mathrm{i} (k_x x + k_z z )}), \\ \omega_y (x,y,z,t) & = \sum_{k_x, k_z} \hat{\omega}_y(t, y, k_x, k_z) \exp({\mathrm{i} (k_x x + k_x z )}), \end{aligned} \right\} \end{equation}
where  $\hat {v}$ and
 $\hat {\omega }_y$ represent complex Fourier coefficients of particular Fourier modes, and
 $t$ represents time. Wavenumbers
 $k_{x_n} = 2 {\rm \pi}n/L_{x}$ and
 $k_{z_m} = 2 {\rm \pi}m/L_z$ are proportional to integer multiples
 $n$ and
 $m$, and inversely proportional to the length and width of the computational domain
 $L_x$ and
 $L_z$. In the wall-normal direction,
 $y$, the equations are discretized with compact finite differences. Unlike in Kim et al. (Reference Kim, Moin and Moser1987), the flow is integrated in time with fourth-order Runge–Kutta scheme. For more details on the numerical method, see Flores & Jiménez (Reference Flores and Jiménez2006).
In the code formulation, the flow mass flux is kept constant and the pressure gradient is allowed to vary. This way, if a control is applied, the total shear stress  $\tau _w = - \overline {u' v'} + \nu (\partial u /\partial y)$, the friction velocity
 $u_\tau = \sqrt {\tau _w /\rho }$ and the friction Reynolds number
 $Re_{\tau } = u_{\tau } h / \nu$ vary too (here
 $\rho$ is the fluid density). This becomes important later for the definition of the friction factor
 $C_f = \tau _w / (0.5 \rho U^2_b)$, which is used to assess control performance; here
 $U_b = (1/2h) \int _{-h}^{h} U\,{\textrm {d} y}$ denotes the bulk velocity. Since
 $u_\tau$ changes, the normalization of the flow in wall units also changes. The majority of our DNS results are non-dimensionalized with the respective
 $u_\tau$ of each case, unless stated otherwise. The uncontrolled flow parameters are identified as
 $u_{\tau 0}$,
 $Re_{\tau 0}$,
 $C_{f 0}$, etc.
Further details of the computational set-up can be found in table 1. The friction Reynolds number of the uncontrolled base flow  $Re_{\tau 0} = 932$ is relatively large, allowing enough statistics to be gathered in the logarithmic layer. The size of the computational domain is
 $2 {\rm \pi}h \times {\rm \pi}h$, which is large enough to accommodate the structures prevalent at the target location for control
 $y_d = 0.1 h$ (Flores & Jiménez Reference Flores and Jiménez2010; Lozano-Durán & Jiménez Reference Lozano-Durán and Jiménez2014). The longest wavelengths
 $\lambda _{x,z} = 2{\rm \pi} /|k_{x,z}|$ that our simulations can accommodate are
 $(2{\rm \pi},{\rm \pi} )$ in the
 $x$- and
 $z$-directions, respectively, with
 $k_{x,z}$ denoting a wavenumber pair. The two left columns of table 1 give information about the mesh in collocation space, and the coarsest mesh resolutions in the three directions, indicating that the baseline simulations are well resolved.
Parameters of the DNS and control:  $L_x$ and
 $L_z$ are streamwise and spanwise sizes of the computational domain, respectively, compared to the half-height
 $h$ of the channel;
 $N_x$,
 $N_y$ and
 $N_z$ are the numbers of grid points in physical space in each direction; and
 $\Delta x^+$,
 $\Delta z^+$ and
 $\Delta y_{max}^+$ are the spatial resolutions in wall units before dealiasing. The phase of the complex coefficient
 $A$ is related to the streamwise shift
 $x_0$ in (2.3). The
 $(0,0)$ mode was not controlled (
 $E_{vv}^{00} =0$ from continuity).

We implement a variation of the opposition control set-up that affects only large scales of the flow. At each time step of the simulation, the wall-normal velocity  $v$ is recorded at the detection plane
 $y_d/h \approx 0.1$, which corresponds to
 $y^+_d \approx 100$ for the base uncontrolled flow. Although here we focus on the effects of full opposition and do not employ LSE, we use the conclusions from the LSE analysis of Encinar & Jiménez (Reference Encinar and Jiménez2019) to guide our choice of controlled length scales. Their flow reconstructions suggest that only the largest structures of
 $v$ with wavelengths of
 ${\rm \pi} /3 < \lambda _x/h < \infty$ and
 ${\rm \pi} /5 < \lambda _z/h < \infty$ can be reconstructed with at least 50 % accuracy at this wall-normal location (figure 1b). Thus the measurement and actuation are performed only for Fourier modes with these wavelengths, with the corresponding wavenumbers
 $k_{x,z}$ given in table 1. To avoid direct forcing of the mean flow, the mode with
 $k_x, k_z = (0,0)$ is omitted in the control.
In the next step, this measurement is used to oppose the vertical velocity. The control law can be written as a boundary condition at the wall,
 \begin{equation} \hat{v}_w (t, k_x, k_z) ={-} A \hat{v} (t, y_d, k_x, k_z), \end{equation}
where the control coefficient in general can be a complex number:  $A=|A|\exp (\textrm {i}\phi )$. The control gain
 $|A|$ shows the relationship between the magnitudes of the control input and output. The gain
 $|A|$ and the phase
 $\phi$ of the control coefficient are parameters that can be optimized separately for each flow mode, as suggested by Luhar et al. (Reference Luhar, Sharma and McKeon2014). The phase of control can be interpreted as a shift of the Fourier harmonic in the streamwise direction:
 $\phi = - k_x x_0$. In an average sense, positive values of
 $x_0$ correspond to a rightwards shift along the
 $x$-axis of the control with respect to the detection (i.e. downstream), and negative ones to a leftward shift (i.e. upstream). In summary,
 \begin{equation} \hat{v}_w (t, k_x, k_z) ={-}|A| \exp ({\rm i} \phi_{k_x}) \hat{v} (t, y_d, k_x, k_z) ={-}|A| \exp (-{\rm i} k_x x_0) \hat{v} (t, y_d, k_x, k_z), \end{equation}
where a different phase  $\phi _{k_x}$ is assigned to each
 $k_x$ to make sure that the same shift
 $x_0$ is applied to all harmonics, and the control wave train moves as a whole backwards or forwards in
 $x$ with respect to the measurement. See table 1 for the compilation of control parameters.
Relating streamwise and phase shifts requires some care. For example, any non-zero phase shift will automatically become a spanwise shift for modes with  $k_x =0, k_z \neq 0$, which is detrimental for control and causes drag increase (Chung & Sung Reference Chung and Sung2003). In our implementation, however, the modes with
 $k_x =0$,
 $k_z \neq 0$ are not affected by phase shifts, since their phases are zero for any
 $x_0$ in (2.3). In addition, an instantaneous phase shift with mixed arguments in
 $x$ and
 $z$ can arise due to the lack of
 $k_z \to - k_z$ symmetry in the instantaneous DNS flow, which can be removed by setting equal actuation amplitudes for
 $k_z$ and
 $-k_z$ modes (Toedtli et al. Reference Toedtli, Luhar and McKeon2019). As this results in leaving the mixed-argument term uncontrolled, and the DNS flow is nevertheless statistically invariant to
 $k_z\to -k_z$, we did not implement this correction here. However, it could be potentially important for quantitative comparison of the friction behaviour between the controlled DNS and linearized flow models (Toedtli et al. Reference Toedtli, Luhar and McKeon2019).
2.2. Linearized flow
For linear analysis we employ the numerical method from Schmid & Henningson (Reference Schmid and Henningson2012), augmented with turbulent viscosity (Reynolds & Hussain Reference Reynolds and Hussain1972; Del Alamo & Jiménez Reference Del Alamo and Jiménez2006; Pujals et al. Reference Pujals, García-Villalba, Cossu and Depardon2009). The linearized Navier–Stokes operator, written in terms of wall-normal velocity  $v$ and wall-normal vorticity
 $\omega _y = \partial u/\partial z - \partial w/\partial x$, transforms into the Orr–Sommerfeld and Squire equations,
 \begin{gather} \left[ \left( \frac{\partial}{\partial t} + U \frac{\partial }{\partial x} \right) \nabla^2 - U^{\prime\prime} \frac{\partial }{\partial x} - \nu_t (y) \nabla^4 - 2 \nu'_t (y) \nabla^2 \frac{\partial}{\partial y} - \nu^{\prime\prime}_t (y) \left( 2 \frac{\partial^2 }{\partial y^2} - \nabla^2 \right) \right] v = 0 , \end{gather}
 \begin{gather}\left[ \frac{\partial}{\partial t} + U \frac{\partial}{\partial x} - \nu_t (y) \nabla^2 - \nu'_t (y) \frac{\partial }{\partial y} \right] \omega_y ={-} U^{\prime} \frac{\partial v}{\partial z}, \end{gather}
with the mean turbulent velocity profile  $U(y)$ and boundary conditions (2.2), supplemented by
 $\partial v / \partial y|_{y=0,2h} =0$ and
 $\omega _y|_{y=0,2h} =0$. The primes in (2.4) and (2.5) denote wall-normal derivative, and
 $v$ at the wall is a function of
 $v$ at the detection plane in (2.2).
Note that the linearization of the Navier–Stokes equation was done around the uncontrolled flow profile, although the mean velocity profile changes when control is applied. The eddy viscosity profile  $\nu _t$, suggested by Cess (Reference Cess1958), is an analytic function of
 $y$. The idea behind it is that, for every spatial harmonic, the background turbulence acts directly through Reynolds stresses and indirectly through the turbulent mean profile. Turbulent viscosity, introduced into the viscous term, is merely a closure for the mean Reynolds stresses (see Appendix A). Periodicity of the flow in wall-parallel directions allows one to represent solutions in the form of Fourier harmonics (2.1) with wavenumbers
 $k_x$ and
 $k_z$ as the input parameters of the problem.
It is common to study (2.4) and (2.5) by introducing a forcing term, accounting for turbulent fluctuations, nonlinearities or noise (McKeon & Sharma Reference McKeon and Sharma2010), and to simplify the notation by introducing operators  $\mathrm {D} \equiv \partial / \partial y$,
 $L_{OS}$ and
 $L_{SQ}$, the vector of variables
 $\boldsymbol {q}$ and
 $\kappa ^2 = k_x^2 + k_z^2$ as
 \begin{equation} \boldsymbol{q} = \begin{pmatrix} \hat{v} \\ \hat{\omega}_y \end{pmatrix}, \quad \boldsymbol{\mathsf{M}} = \begin{pmatrix} \kappa^2 - \mathrm{D}^2 & 0 \\ 0 & 1 \end{pmatrix}, \quad \boldsymbol{\mathsf{L}} = \begin{pmatrix} L_{OS} & 0 \\ \mathrm{i} k_z \dfrac{{\rm d} U}{{\rm d} y} & L_{SQ} \end{pmatrix}. \end{equation}
See Appendix A for more details. Introducing the unknown forcing  $\boldsymbol {f}$, we can write (2.4) in matrix form,
 \begin{equation} \boldsymbol{\mathsf{M}} \frac{\partial}{\partial t} \boldsymbol{q} = -\boldsymbol{\mathsf{L}} \boldsymbol{q} + \boldsymbol{f}. \end{equation}
We consider solutions of the form  $\boldsymbol {q} = \boldsymbol {q_r} (y) \textrm {e}^{- \mathrm {i} \omega t}$, implying the forcing
 $\boldsymbol {f} = \boldsymbol {q_f} (y) \textrm {e}^{- \mathrm {i} \omega t}$. Equation (2.7) can be rewritten as
 \begin{equation} -{\rm i}\omega \boldsymbol{\mathsf{M}} \boldsymbol{q_r} ={-} \boldsymbol{\mathsf{L}} \boldsymbol{q_r} + \boldsymbol{q_f}. \end{equation}
Note that there are two ways of representing the role of the boundary condition (2.2). In the first one, we could absorb the boundary conditions in the forcing  $\boldsymbol {f}$, leaving the original force-less system and its eigenvectors untouched. However, on a closer look, (2.2) affects not only the values of
 $\hat {v}$ near the wall, but also the shape of the eigenvectors above the wall. Therefore, here we constrain the eigensolutions of (2.8), as well as its responses to the forcing
 $\boldsymbol {q_f}$, to the condition
 $\hat v|_{y=0,2h} = - A \hat {v}|_{y=y_d,2h-y_d}$ by modifying the operators
 $\boldsymbol{\mathsf{M}}$ and
 $\boldsymbol{\mathsf{L}}$, as shown in Appendix B.
If there is no forcing,  $\boldsymbol {q_f}=0$, the problem is converted into a generalized eigenvalue problem
 $\omega \boldsymbol {q_r} = \boldsymbol{\mathsf{M}}^{-1}(-\mathrm {i}\boldsymbol{\mathsf{L}}) \boldsymbol {q_r}$ and the complex eigenvalues
 $\omega \in \mathbb {C}$ are sought. In agreement with commonly used notation, we will use
 $c = \omega /k_x = c_r + \mathrm {i} c_i$ as a measure of the stability of the system,
 $c_r = \omega _r/k_x$ being the phase speed of the disturbance in the
 $x$-direction, and
 $c_i = \omega _i /k_x$ representing its growth rate. The criterion for instability is
 $c_i>0$. The numerical method employed here for linear analysis is detailed in Schmid & Henningson (Reference Schmid and Henningson2012, Appendix A). In short, we consider the generalized eigenvalue problem obtained by setting
 $\boldsymbol {q_f}=0$ in (2.8). This problem contains derivatives in
 $y$ up to a fourth order and is further discretized in
 $y$ with the spectral Chebyshev collocation method, resulting in an
 $N\times N$ matrix, with
 $N$ eigenvalues and eigenvectors. Here we used
 $N=256$, or
 $N = 512$ for large values of
 $|A|$, but we also tested our results with higher
 $N$ to ensure the absence of spurious eigenvalues. It is straightforward to reduce (2.4) and (2.5) to an inviscid problem by eliminating viscosity
 $\nu _t$. The new second-order differential equation in
 $y$ only requires two boundary conditions on
 $v_{w}$, one for each wall of the channel. The conditions
 $\partial v / \partial y =0$ and
 $\omega _y=0$ at the wall no longer hold in an inviscid flow where wall-parallel velocities are not required to be zero, and therefore should be removed from the system.
2.2.1. Response to a forcing
Consider the problem (2.8) in a more general form, where the forcing is non-zero  $\boldsymbol {q_f} \neq 0$, but its shape is not known a priori. In a noisy nonlinear system such as turbulent shear flow, this choice is reasonable. If
 $\omega$ is real (let us denote it
 $\omega _f$), it appears as an additional parameter in (2.8). The response of the system to this general forcing can be derived as
 \begin{equation} \boldsymbol{q_r} = (\boldsymbol{\mathsf{M}}^{{-}1} \boldsymbol{\mathsf{L}} - \mathrm{i} \omega_f \boldsymbol{\mathsf{I}})^{{-}1} \boldsymbol{\mathsf{M}}^{{-}1} \boldsymbol{q_f} = \mathcal{H} \{\boldsymbol{\mathsf{M}}^{{-}1}\boldsymbol{q_f}\}, \end{equation}
where  $\mathcal {H}$ is the resolvent operator of (2.8). The spectral norm of the operator
 $\mathcal {H}$ represents the maximum amplification of the response to a forcing with frequency
 $\omega _f$,
 \begin{equation} \| \mathcal{H} \| \equiv \sup_{\boldsymbol{q_f} \neq 0 } \frac{\|\boldsymbol{q_r}\|}{\|\boldsymbol{\mathsf{M}}^{{-}1} \boldsymbol{q_f} (y)\|}. \end{equation}
This norm, weighted by the total energy of the flow, can be computed as the first (largest) singular value,  $\sigma _0$, of the singular value decomposition (SVD) of the operator
 $\mathcal {H} = \boldsymbol{\mathsf{U}} \boldsymbol {\varSigma } \boldsymbol{\mathsf{V}}^\textrm {T}$. Here the diagonal matrix
 $\boldsymbol {\varSigma }$ contains the singular values (relative amplitudes of the response), and the matrices
 $\boldsymbol{\mathsf{U}}$ and
 $\boldsymbol{\mathsf{V}}$ are the optimal responses and forcings, respectively, ranked by the amplitude of response. In the following we consider only the flow responses related to the largest singular values, as in the so-called rank-one model introduced by McKeon & Sharma (Reference McKeon and Sharma2010). They proposed two amplification mechanisms: the first one through the shear
 $U'$ and related to it transient growth, and the second one through amplification at the critical layer where the phase speed of the forcing
 $c_f=\omega _f/k_x$ matches the local mean velocity.
3. Large-scale control in DNS
3.1. Virtual-wall effect for large scales
The effect of wall modification is reflected in the turbulent mean profile in the log layer (Nikuradse Reference Nikuradse1933). In wall units,  $U^+ = \gamma ^{-1} \log (y^+) + B$, and the wall modifications such as roughness or control preserve the slope of the logarithmic law,
 $\gamma ^{-1}$, but change the intercept constant of the profile
 $B$ (Townsend Reference Townsend1976). A decrease in
 $B$ is related to an increase in friction factor
 $C_f$, as in flows above rough walls; while an increase in
 $B$ is related to a drag-decreasing effect (Jiménez Reference Jiménez1994). Figure 2(a) compares the mean velocity profiles of the flow subject to large-scale control,
 $y_d/h = 0.1$, with ‘classic’ opposition flow control,
 $y_d^+ = 10$, and with the uncontrolled flow. The classic opposition control results, as expected, in a shift of the mean profile upwards with a corresponding decrease in drag,
 $\Delta C_f = (C_f - C_{f0}) / C_{f0}\approx -0.17$. On the contrary, opposing only large wavelengths results in the shift of the mean velocity profile downwards, and a significant drag increase of
 $\Delta C_f \approx 50\,\%$.
(a) Influence of the control on the mean velocity profile  $U^+$: black dashed line, without control; orange dash-dotted line, opposition control with all flow scales involved and
 $y_d^+ = 10$; and green solid line, opposition control with only large scales and
 $y_d/h=0.1$. (b) The r.m.s. of wall-normal velocity. The virtual-wall effect of control with
 $y^+_d=10$ produces a minimum at
 $y^+ = 5$, in contrast to the large-scale control at
 $y_d/h=0.1$. (c) The contribution to the r.m.s. of
 $v$ from the large scales (see text for more details). (d) Wall-normal coordinate of the local minimum in panel (c) for the large-scale control as a function of the control gain, together with the fit (3.2). Control parameters in panels (a–c) are
 $|A|=1$ and
 $x_0 = 0$.

A possible physical explanation for the success of opposition flow control in the first case is that opposing flow at the wall creates a so-called virtual-wall effect for small eddies with sizes approximately 10–15 wall units (Luchini, Manzo & Pozzi Reference Luchini, Manzo and Pozzi1991; Jiménez Reference Jiménez1994). These ideas were also proven useful in the application to drag reduction with riblets (García-Mayoral & Jiménez Reference García-Mayoral and Jiménez2011). Figure 2(b) illustrates this effect using the root mean square (r.m.s.) of the wall-normal velocity component, referred to as  $v^+_{rms}$ from now on. In the case of ‘classic’ opposition control with
 $y_d^+=10$, the minimum of
 $v^+_{rms}$ appears at
 $y_0^+ = 5$, midway to the detection plane. There is an expected peak at the wall due to the non-zero boundary condition on
 $v$, but away from the wall the overall intensity of
 $v$ decreases with respect to the uncontrolled flow. On the contrary, the large-scale opposition control strategy enhances
 $v^+_{rms}$ for all
 $y$. At first sight, there is no visible minimum of
 $v$ near the wall. To find out whether the chosen control strategy affects large structures, we determine their contribution to
 $v^+_{rms}$ from the spectrum of the wall-normal velocity, and denote this quantity as
 $v^+_{rms} (\lambda _{ctrl})$. It is calculated by adding only the values corresponding to controlled wavelengths from table 1 for each wall-normal location. Figure 2(c) shows
 $v^+_{rms} (\lambda _{ctrl})$ for the uncontrolled case, for classical opposition control and for the opposition control of the large wavelengths. Both control strategies increase the contribution to
 $v^+_{rms}$ from the large structures of
 $v$, but the large-scale opposition produces a minimum near the wall for those structures. This minimum is located at
 $y_0^+ \approx 50$, which corresponds, approximately, to half of the wall-normal distance to the detection plane. The analogous minimum for the classic opposition control is much less pronounced since there is little energy in large scales of
 $v$ at
 $y_d = 10$.
If  $v$ is assumed to vary linearly between the wall and the sensor location, then, given (2.2),
 \begin{equation} \hat{v} /\hat{v} (y_d) = (y/y_d) (1 + A) - A. \end{equation}
The location of the virtual wall can be defined as a minimum of  $|v/v_d|$, reached at
 \begin{equation} y_0 /y_d= \frac{ \mathrm{Re}(A) + (\mathrm{Re}(A))^2 +(\mathrm{Im}(A))^2}{(1 + \mathrm{Re}(A))^2 + (\mathrm{Im}(A))^2}, \end{equation}
where  $\mathrm {Re}$ and
 $\mathrm {Im}$ denote the real and imaginary parts. It reduces to
 \begin{equation} \frac{y_0}{y_d} = \frac{A}{1 + A} , \end{equation}
when  $\mathrm {Im}(A)=0$, i.e. when the control coefficient
 $A$ is purely real. It follows from (2.3) that this happens when
 $-k_x x_0 = 2 {\rm \pi}n$, with
 $n=0, 1,\ldots$ . One specific case of this condition is when no phase shift is introduced, i.e.
 $x_0 =0$. In figure 2(d) we test if the assumption of linearity is valid for the large-scale control. The control gain
 $|A|$ is varied while the phase of control is kept zero, and the location of the minimum in
 $v^+_{rms} (\lambda _{ctrl})$ is recorded. For small values of
 $|A| \leq 0.25$ the location of the minimum in
 $v$ is predicted quite well by (3.2), while for larger control gain the trend, while still increasing, no longer exactly follows the linear prediction.
3.2. Introducing streamwise offset between sensing and actuation
In the spirit of (2.3) we modify the control by shifting it upstream or downstream, creating an offset between sensing and actuation. Figure 3(a) presents results of a control experiment in which  $x_0$ is varied in order to search for an optimal control delay. The results of control are relatively insensitive to the downstream shifts: the drag increase stays at the level of 50 % for most of the positive values of
 $x_0$. Negative, upstream shifts produce much larger drag increase, up to 300 % for
 $x_0 = -0.3$. Both very large negative (
 $x_0 \leq -0.35$) and positive (
 $x_0 \geq 0.55$) streamwise shifts result in control instability. In both cases, the wall-normal velocity grows to levels at which the resolution of the code is insufficient and the simulations diverge. There exists nevertheless a clear difference between the two limits. While at large negative shifts the instability manifests itself in a gradual increase in drag, for large positive shifts it appears suddenly.
(a) Friction factor  $c_f$ as a function of streamwise shift
 $x_0$ of the control normalized with the friction factor of the uncontrolled flow,
 $|A| = 1$. Shaded regions denote the areas with a sharp increase in friction where the resolution in table 1 is insufficient to converge. (b) Friction factor as a function of the control gain
 $|A|$. Symbols:
 $\bullet$,
 $x_0 = -0.3$;
 $\bigstar$,
 $x_0 = 0$;
 $\blacktriangledown$,
 $x_0 = 0.55$.

In figure 3(b) we plot the friction factor for the two limits  $x_0 = 0.55$ and
 $x_0 = -0.3$, as well as the regular control with no shift. For all three cases, we observe that, for relatively low control gain
 $|A|\leq 0.5$, the introduction of large-scale opposition results in only a mild increase in drag. The flow almost does not ‘feel’ this control. For higher control gain, both
 $x_0=0$ and
 $x_0=0.55$ saturate around
 $c_f/c_{f_0} = 1.5$, with the latter performing slightly better. As
 $|A|\to 0.95$, and
 $x_0=0.55$, the friction suddenly increases sharply, and the transition on the right side of figure 3(a) is approached. For
 $x_0 = -0.3$, which is close to the transition on the left, the drag continuously increases beyond
 $|A| \approx 0.5$. The large increase in drag obtained with the large-scale control strategy is very different from what is expected from the ‘classic’ opposition control. Together with the control instability, it shows that large-scale structures in the logarithmic layer in the channel flow are very sensitive to actuation.
3.3. Spanwise rollers and oblique waves
To illustrate the effect of control on the streamwise velocity, we show in figure 4 instantaneous snapshots of the streamwise velocity fluctuations in the buffer layer ( $y^+ = 10$). Figure 4(a) shows a ‘normal’ snapshot of uncontrolled flow. The flow is populated with buffer-layer low- and high-velocity streaks with footprints of two larger
 $u$-structures, possibly logarithmic-layer streaks. Figure 4(b) also contains a streamwise velocity snapshot, but now for the case with large-scale control and negative streamwise shift
 $x_0 = -0.3$. This case corresponds to the sharp increase in drag on the left side of figure 3(a). The streaky structure of the flow is completely lost and, instead, five or six spanwise rollers appear that are almost homogeneous in the spanwise direction. Figure 4(c) also shows
 $u$ but for the case of control with no streamwise shift
 $x_0 = 0$. In this case the streaky structure of the uncontrolled flow is also lost, but spanwise-homogeneous rollers do not appear. Instead, oblique-like waves with inclination in the
 $x$–
 $z$ plane occur. As is visible from the snapshot, the
 $(x,z)$ lengths of the waves are approximately
 $(2h, h)$, which is within the range of controlled wavelengths in table 1.
Instantaneous snapshots of streamwise velocity fluctuations near the wall ( $y^+ = 10$), normalized with the bulk velocity. (a) Uncontrolled flow. (b) Large-scale control with negative phase shift,
 $x_0 = -0.3$. (c) Large-scale control,
 $x_0 = 0$. The colour bar is the same for all the snapshots.

To identify the length scale of the oblique waves chosen by the flow in figure 4(c) more precisely, we plot in figure 5(a,b) the spectrum of the streamwise velocity component,  $E_{uu}$, as a function of
 $\lambda _x$,
 $\lambda _z$ and the distance from the wall. It is clear from the spectra that applying opposition flow control on the large scales creates a significant footprint not only on the spectrum of the wall-normal velocity component,
 $E_{vv}$, at the wall, as seen in figure 5(c), but also on the spectrum of
 $u$. This response, although distributed over various length scales, peaks near
 $\lambda _x/h, \lambda _z/h \approx 2,1$, corresponding to the structures visible in the snapshots. The wall-normal location of the maximum of the streamwise energy component is in the buffer layer at
 $y^+ \approx 10$. With non-zero
 $E_{vv}$ at the wall and
 $E_{uu}$ peaking in the buffer layer, the Reynolds stress spectrum
 $E_{uv}$ also has a maximum in that area (figure 5d). As a result, we observe a significant increase in friction, which is reflected in an increase of the effective friction velocity and of
 $Re_\tau$ of the controlled flow. Notice a local minimum in the stress contours at about
 $y^+ \approx 50$, corresponding to the location of the minimum in r.m.s. of
 $v$ in figure 2(c). At the same time, some of the energy contours of the controlled flow are shifted towards the left from the uncontrolled case. This is most visible in the spectrum of the wall-normal component of energy (figure 5c).
(a,b) Spectrum of  $u$ as a function of wall-normal distance and streamwise (a) and spanwise (b) wavelength. (c) Spectrum of
 $v$ as a function of
 $y$ and
 $\lambda _x$. (d) The same for
 ${-uv}$. The spectrum in panel (b) was premultiplied with
 $k_z$, while the rest were premultiplied with
 $k_x$. All data are normalized with
 $u_\tau$ and integrated in the third spatial direction. Curves: dashed line, uncontrolled flow; solid line, controlled flow. The contours contain
 $97.5\,\%$,
 $80\,\%$,
 $45\,\%$,
 $23\,\%$ and
 $4\,\%$ of the total spectral mass. Control parameters are
 $|A| = 1$ and
 $x_0 = 0$; and the shaded regions denote controlled wavelengths from table 1.

The waves observed in figure 4 are not found in regular channel flows, suggesting that the applied control strategy can best be understood as a forcing on  $v$ at the wall. This forcing can be deleterious in terms of drag reduction, even if it creates a positive virtual-wall effect for large scales (figure 2c). The increase in drag created in DNS by large-scale control could signal the presence of either a linear instability, or an amplified linear response of the system to the control. In the next sections we employ the methods of § 2.2 to show that the oblique waves and spanwise rollers induced by the large-scale control can be explained by the linearized dynamics of the Navier–Stokes equations.
4. Linear stability of the inviscid channel flow
4.1. Analysis of the Rayleigh equation
We begin by exploring the stability of the inviscid flow subject to control, as it is the most simplified linear model of channel flow. The inviscid flow, linearized about the uncontrolled mean profile, is governed by the Rayleigh equation, which is (2.4) without viscosity,
 \begin{equation} (U-c) (\mathrm{D}^2 - \kappa^2) \hat{v} = U^{\prime\prime} \hat{v}, \end{equation}
where  $c = \omega /k_x= c_r + \mathrm {i} c_i$. This is a second-order problem with
 $y\to -y$ symmetry. Any general solution to (4.1) can be expressed as a linear combination of a symmetric and an antisymmetric solution. In the uncontrolled flow, the coefficients of (4.1) are real, and if
 $\hat {v}$ is an eigenfunction of (4.1) with eigenvalue
 $c$, so is its complex conjugate
 $\hat {v}^*$ with eigenvalue
 $c^*$. The boundary conditions (2.2), involving the complex coefficient
 $A$, destroy this property of the flow. Making the change of variables
 $\hat {v} = \tilde {V} (U-c)$, multiplying by the complex conjugate and integrating over the wall-normal coordinate (Schmid & Henningson Reference Schmid and Henningson2012, pp. 23–24), we get
 \begin{equation} \int_{0}^{2 h} (U-c)^2 \underbrace{( |\mathrm{D} \tilde{V}|^2 + \kappa^2 |\tilde{V}|^2 )}_{Q \geq 0} {\,\rm{d}} y = \tilde{V}^* (U-c)^2 \mathrm{D} \tilde{V} \big|_{0}^{2 h}, \end{equation}
where  $\tilde {V}^*$ denotes the complex conjugate of
 $\tilde {V}$. The real and imaginary parts of (4.2) are
 \begin{gather} \int_{0}^{2h} [ (U -c_r)^2 - c_i^2 ] Q {\,\rm{d}} y = \mathrm{Re}\left[\tilde{V}^* (U-c)^2\mathrm{D} \tilde{V}\big|_{0}^{2h}\right], \end{gather}
 \begin{gather}-2 c_i \int_{0}^{2h} (U - c_r) Q {\,\rm{d}} y = \mathrm{Im}\left[\tilde{V}^* (U-c)^2 \mathrm{D} \tilde{V}\big|_{0}^{2h}\right], \end{gather}
respectively.
In the case of homogeneous boundary conditions,  $\hat {v} = \tilde {V} \big |_{0}^{2h} = 0$, the right-hand side in (4.4) is equal to zero. Since
 $Q$ is non-negative,
 $(U-c_r)$ must change sign in the interval
 $[0, 2h]$ for non-trivial solutions. It follows that, in the case of impermeable walls, the advection speed of perturbations
 $c_r$ is bounded by the mean velocity profile,
 \begin{equation} U_{min} < c_r < U_{max}. \end{equation}
However, in the case of inhomogeneous boundary conditions, like those introduced by our control, the right-hand side in (4.4) is non-zero and we get
 \begin{equation} \int_{0}^{2h} (U - c_r) Q {\,\rm{d}} y ={-} \frac{\mathrm{Im}\left[\tilde{V}^* (U-c)^2 \mathrm{D}\tilde{V}\big|_{0}^{2h}\right]}{2 c_i} \equiv C_{\mathrm{Im}} \end{equation}
from (4.4). If  $C_{\mathrm {Im}}>0$, then
 $c_r \leq U_{max}$, or the integral would be negative, but
 $c_r$ can be smaller than
 $U_{min}$. On the contrary, if
 $C_{\mathrm {Im}}<0$, the integral cannot be positive, and
 $c_r \ge U_{min}$. Restriction (4.5) is not applicable here. Once we have non-zero vertical velocity at the wall, the lower (or the upper) boundary on the phase speed of perturbations in (4.5) is relaxed. As we will see below, this will result in
 $c_r < U_{min}$ or
 $c_r>U_{max}$ for some parameters of opposition flow control.
Assume a symmetric mean velocity profile  $U(y)$ such that
 $U_{0} = U_{2h} = 0$. With (2.2) in mind, the boundary conditions on
 $\tilde {V}$ become
 \begin{equation} \tilde{V}_0 = A \tilde{V}_{y_d} \frac{U_{y_d} -c}{c}, \quad \tilde{V}_{2h} = A \tilde{V}_{2h - y_d} \frac{U_{y_d} -c}{c}. \end{equation}
With the help of (4.7a,b), the right-hand side of (4.2) can be rewritten as
 \begin{equation} \tilde{V}^* (U-c)^2 \mathrm{D} \tilde{V} \big|_{0}^{2h} = c^2 \left( A \frac{U_{y_d} -c}{c}\right)^* \{ \tilde{V}^*_{2h - y_d} [\mathrm{D}\tilde{V}]_{2h} - \tilde{V}^*_{y_d}[\mathrm{D}\tilde{V}]_{0}\}. \end{equation}
It is not straightforward to figure out the sign of the real and complex parts of (4.8), since  $c^2$ and
 $A^*$ are complex numbers, and
 $\tilde {V}^*$ and
 $\mathrm {D} \tilde {V}$ are complex variables themselves. Some insight can be gained in a special case with
 $\phi = \pm {\rm \pi}$, which makes the control coefficient real,
 $A = A^* = -|A|$. Further simplification comes from considering neutrally stable eigenvalues,
 $c_i = 0$, related to control. When
 $c_i =0$, the right-hand side of (4.4) should be zero, i.e.
 $\mathrm {Im}\left [\tilde {V}^* (U-c)^2 \mathrm {D} \tilde {V} \big |_{0}^{2h}\right ] =0$, but this does not give us any information about
 $c_r$. Instead, (4.3) becomes the only condition on
 $c_r$. With the help of (4.8) this condition reads
 \begin{equation} \left. \begin{aligned} \int_{0}^{2h} (U -c_r)^2 Q {\,\rm{d}} y & ={-} c_r (U_{y_d} - c_r) |A| C_\mathrm{Re} , \\ \text{where} \quad C_\mathrm{Re} & = \mathrm{Re}\{ \tilde{V}^*_{2h - y_d} [\mathrm{D} \tilde{V}]_{2h} - \tilde{V}^*_{y_d}[\mathrm{D} \tilde{V}]_{0} \}. \end{aligned} \right\} \end{equation}
Since the left-hand side of (4.9) is always non-negative,  $C_\mathrm {Re} \geq 0$ if
 $c_r <0$ or
 $c_r > U_{y_d}$. Expanding (4.9), we get a quadratic equation for
 $c_r$,
 \begin{equation} c_r^2 \underbrace{\left[ \int_{0}^{2h} Q {\,\rm{d}} y - |A| C_\mathrm{Re} \right]}_{I_1} + \, c_r \underbrace{ \left[{-}2 \int_{0}^{2h} U Q {\,\rm{d}} y + U_{y_d} |A| C_\mathrm{Re} \right] }_{I_2} + \underbrace{\int_{0}^{2h} U^2 Q {\,\rm{d}} y}_{I_3} = 0, \end{equation}
with roots
 \begin{equation} c_{r}^{{\pm}} = \frac{-I_2 \pm \sqrt{I_2^2 - 4 I_1 I_3}}{2 I_1}. \end{equation}
For the eigenvalues with  $c_r^\pm$ to exist, the discriminant of (4.11) must be non-negative,
 $I_2^2 - 4 I_1 I_3 \geq 0$. To make further progress in understanding the roots of (4.10), we need to know
 $Q(y)$ and
 $C_\mathrm {Re}$ for the eigenvectors at each particular
 $|A|$, and therefore we have to invoke the numerical stability analysis of (4.1). The case
 $c_i = 0$ will be important later on.
4.2. Inviscid stability: numerical results
We begin by considering the stability of the longest wavelength of the flow, which, in our simulations, is  $k_x h =1$, which does not vary in the
 $z$-direction (
 $k_z=0$), employing the Chebyshev collocation method described in § 2.2. Figure 6(a,b) shows how the control influences the stability of this wave mode for
 $|A| =1$ as a function of the control phase
 $\phi$. Without control, all the eigenvalues of (4.1) are neutrally stable (
 $c_i =0$) and their phase velocity is restricted to
 $c_r \in [U_{min}, U_{max}]$. Pure opposition control with
 $\phi = 0$ does not change this property of the flow, which remains neutrally stable. With the introduction of a non-zero control phase, two eigenvalues depart from the real axis, while the rest remain unaffected. Recall that, since
 $A$ becomes complex when
 $\phi \neq 0$, these eigenvalues are not necessarily complex conjugate pairs. In fact, they appear together in either the
 $c_i >0$ or the
 $c_i<0$ half-planes. They correspond to a symmetric and an antisymmetric eigenmode with respect to
 $y$. In the case of increasing positive phase,
 $\phi >0$, the eigenvalues move anticlockwise in the plot, their imaginary part grows and the flow becomes unstable. If
 $\phi <0$, the eigenvalues move clockwise as the phase decreases, symmetrically with respect to the
 $\phi >0$ case, but have negative imaginary parts and the eigenvectors associated with them are stable.
(a) Eigenvalue spectrum of the inviscid problem as a function of control phase  $\phi$, for
 $|A| =1$. Negative phases are denoted by blue
 $\blacktriangledown$, and positive by red
 $\blacktriangle$. Colour intensity shows the increase in
 $|\phi |$ as
 $\phi$ spans the interval
 $(-{\rm \pi}, {\rm \pi})$. The black
 $\bullet$ symbols represent the eigenvalues of the uncontrolled flow. (b) The same as in panel (a) but with wider axes, to show the full spectral range. Both axes have the same scale. (c) Eigenvalue spectrum for
 $|A| =2$. Symbols and colours as in panel (a). (d) Inviscid stability map as a function of the control gain and phase. Contours, with increasing colour intensity:
 $c_i /U_b = [10^{-4}, 10^{-3}, 10^{-2}, 10^{-1}, 1 ]$. Dashed line,
 $|A| = 1$ and
 $|A|=2$ corresponding to panels (a,b) and (c), respectively. The
 $\bullet$ symbol denotes the most unstable
 $(|A|_f,\phi _f)$ pair of control parameters. For all panels,
 $k_x =1$ and
 $k_z =0$.

Near the threshold of instability, the dependence of the phase velocity seems to be parabolic, but, when a wider range of  $\phi$ is considered in figure 6(b), it becomes obvious that the affected eigenvalues execute a quasi-circular motion in the
 $(c_r, c_i)$ plane. The horizontal axis of this motion lies on the neutral stability line
 $c_i = 0$. The absolute value of
 $c_i$ grows with
 $|\phi |$ for both stable and unstable branches, resulting in large absolute values of growth rate as
 $|\phi |$ approaches
 ${\rm \pi}$ as well as large negative phase velocities,
 $c_r<0$. As mentioned in the previous section, these negative phase velocities are unusual compared to a normal channel flow, where
 $c_r$ is restricted by (4.5), i.e. the minimal mean velocity, which is zero at the channel walls. However, the periodicity of the complex control coefficient
 $A$ requires
 $A({\rm \pi} ) = A(-{\rm \pi} )$, and after reaching a maximum in
 $c_i$ the absolute value of the growth rate rapidly decreases, until the stable and unstable branches join at
 $\phi = \pm {\rm \pi}$ and
 $c_i=0$, and the flow recovers its neutral stability. This effect is visualized by the overlap of symbols of the two branches on the left in figure 6(b).
If we repeat the same numerical experiment with a larger control gain, for example,  $|A|=2$, the results are quite different. Figure 6(c) illustrates this on the same wave mode with
 $k_x h = 1$ and
 $k_z = 0$. Similarly to
 $|A|=1$, two unstable eigenvalues exist, with corresponding symmetric and antisymmetric eigenvectors. Positive phases result in unstable flow, and negative phases in stable, with corresponding increase in
 $|c_i|$ as
 $|\phi |$ increases. This time, however, the eigenvalues move towards increasing
 $c_r$ as
 $|\phi |$ increases, i.e. the unstable eigenvalues move clockwise and their stable counterparts move anticlockwise until they meet at
 $\phi =\pm {\rm \pi}$.
To further characterize the parametric dependence of the instability, figure 6(d) presents a two-dimensional inviscid stability map of  $k_x = 1$ and
 $k_z = 0$ as a function of
 $|A|$ and
 $\phi$. The dashed lines in the figure correspond to figure 6(a–c). As expected from the previous discussion, the unstable region is located in the range of
 $\phi \in (0, {\rm \pi})$. The region with
 $\phi \in (-{\rm \pi}, 0)$ is neutrally stable for all values of
 $|A|$. The isocontours of constant
 $c_i$ show that the instability growth rate increases with
 $\phi$, and peaks when
 $\phi$ is close to
 ${\rm \pi}$ for each
 $|A|$. Note that, in contrast with classic opposition control (
 $\phi = 0$),
 $\phi = \pm {\rm \pi}$ is equivalent to ‘reinforcement’ control where the flow velocity applied at the walls is in-phase with the flow velocity at the detection plane
 $y_d$. The point
 $\phi = \pm {\rm \pi}$ is nevertheless neutrally stable, as we saw in figure 6(b,c). As the control gain increases, the instability becomes more pronounced, and the maximum growth rate is attained for
 $|A|_f \approx 1.2$ and
 $\phi _f \approx {\rm \pi}$. The choice of nomenclature for this pair of control parameters, denoted by a blue circle, will become evident shortly. With further increase in
 $|A|$, the growth rate begins to decrease, and the flow becomes again almost neutrally stable for
 $|A| = 10^2$.
So far we have only been concerned with the wavenumber  $k_x h =1$,
 $k_z =0$, but wavenumbers as high as
 $k_{x,z} h = 20$ are also affected by the instability and exhibit similar circular motion. For all
 $k_{x,z}$, the effect of control manifests itself as a pair of eigenvalues with corresponding symmetric and asymmetric eigenvectors. However, the difference between the eigenvalues in the pair becomes smaller as
 $k_{x,z}$ increases, and their respective eigenvalues become identical. For example, each symbol in figure 7(a), presenting control-related eigenvalues for
 $k_x h = 6$,
 $k_z =0$, in reality stands for a pair of almost identical eigenvalues. This simplifies the visual inspection of the data since only one circle of the eigenvalue motion with
 $\phi$ has to be tracked, and we will use figure 7(a) further for convenience.
(a) The flip of the eigenvalue motion as the control gain increases from  $|A|< |A|_f$ (red) to
 $|A|> |A|_f$ (blue). Here
 $|A| \in [1.6, 1.75, 1.83, 1.84, 1.93, 2.1]$,
 $k_x h = 6$ and
 $k_z=0$. The black
 $\bullet$ symbols indicate eigenvalues with
 $\phi = \pm {\rm \pi}$. (b) The numerator and denominator of (4.13), calculated from the eigenvectors corresponding to black
 $\bullet$ in panel (a). Red solid line,
 $F_N^+$; red dashed line,
 $F_N^-$; black solid line,
 $F_D$. The dotted horizontal line marks zero. (c) Black
 $\bullet$ symbols, real part of the numerical eigenvalues with the largest
 $|c_r|$ in panel (a) as a function of
 $|A|$; together with the analytical expression (4.13): solid line,
 $c_r^+$; dashed line
 $c_r^-$. The thin grey rectangle marks the interval of
 $[U_{min}, U_{max}]$. (d) Solid line: zeros of the denominator
 $F_D$ (see panel b), as a function of
 $\kappa$. Symbols denote the control gain
 $|A|_f$, resulting in the flip of the eigenvalue motion: cyan
 $\bullet$, inviscid flow,
 $k_x h \in [1,20]$,
 $k_z = 0$; red
 $\bullet$, viscous flow,
 $k_x h \in [1,20]$,
 $k_z = 0$; black
 $\times$, viscous flow,
 $k_x h =1$,
 $k_z h\in [1,20]$. The data can be approximated with a linear fit
 $|A|_f = 1.2 + 0.016 \kappa ^2 h^2$.

4.3. Explaining the flip of the eigenvalue motion
We observe in figure 6(b,c) that the direction of eigenvalue motion, as well as the sign of  $c_r$ for the fastest-growing modes, depends on
 $|A|$, and we would like to understand this dependence better. For this purpose, figure 7(a) presents the eigenvalue spectrum of
 $k_x h =6$,
 $k_z = 0$ for several values of
 $|A|$. All the eigenvalues near
 $c_i = 0$, which are very weakly affected by the control and do not exhibit quasi-circular motion, are removed for clarity. Each circle, containing almost identical eigenvalue pairs, is analogous to those in figure 6(b,c), but represents the eigenvalue motion as
 $\phi$ changes in the interval of
 $[-{\rm \pi}, {\rm \pi}]$ with the same symbol and colour. When
 $|A|\ll 1$, the radius of the circle is very small, and so is
 $c_i$. With the increase of
 $|A|$, the growth rates become larger, and, equivalently, the circle that contains them expands. The widening of the circle goes on until
 $|A| \approx |A|_f$ (for this wave mode,
 $|A|_f \approx 1.835$). At
 $|A|_f$, the numerically obtained eigenvalues reach extremely large values, and the circle radius tends to infinity at this point. A tiny further increase in
 $|A|$ makes the eigenvalue motion flip towards the right of the imaginary axis, in the region with
 $c_r >0$, almost symmetrically. Hence the name
 $|A|_f$ for this ‘critical’ gain, short for
 $|A|_{flip}$. After the flip, the circle begins to shrink as
 $|A|$ grows, manifesting the weakening of the instability, and the magnitude of
 $c_i$ decreases after
 $|A| = |A|_f$. Eventually the flow comes back to a neutrally stable state.
During the flip, the real eigenvalue at  $\phi = \pm {\rm \pi}$, which is the advection velocity of that neutral mode (black dots in figure 7a), suddenly changes from
 $c_r < 0$ to
 $c_r >0$, and the whole circle follows it. Fortunately, we already developed the tools to explain this behaviour in § 4.1. Since we observed that before the flip
 $c_r < 0$, and after it
 $c_r \gg U_{y_d}$, it follows that
 $C_\mathrm {Re} \geq 0$ in (4.9) during the flip. Recall that
 $Q = |\mathrm {D} \tilde {V}|^2 + \kappa ^2 |\tilde {V}|^2 \geq 0$ from (4.2). Then the denominator of (4.11),
 \begin{equation} I_1 = \int_{0}^{2h} Q {\,\rm{d}} y - |A| C_\mathrm{Re} = I_q - |A| C_\mathrm{Re}, \end{equation}
has contributions from two positive competing terms, and can change sign as  $|A|$ grows. When
 $I_1 = 0$, there is a singularity in (4.11), and the eigenvalues
 $c_r^\pm$ in (4.11) approach infinity. It is instructive therefore to study numerically the denominator
 $2 I_1$ and the numerator
 $-I_2 \pm \sqrt {I_2^2 - 4 I_1 I_3}$ of (4.11), together with
 $c_r^\pm$. These quantities are functions of eigenvectors, and do not have a meaningful amplitude, so they must be normalized with a positive-definite quadratic function of
 $\tilde {V}$. The integral
 $I_q$ from (4.12) provides such a norm, and we can normalize both the numerator and the denominator of (4.11). This gives us an equivalent expression for
 $c_r^\pm$,
 \begin{equation} c_{r}^{{\pm}} = \frac{-\tilde{I}_2 \pm \sqrt{\tilde{I}_2^2 - 4 \tilde{I}_1 \tilde{I}_3} }{2 (1 - |A| \tilde{C}_\mathrm{Re})} = \frac{F^\pm_N}{F_D}, \end{equation}
where  $\tilde {\ }$ reflects our normalization, for example,
 $\tilde {C}_\mathrm {Re} = C_\mathrm {Re}/I_q$. Note that
 $C_\mathrm {Re}/I_q$ itself depends on
 $|A|$, decreasing through the flip. This dependence reflects the change in the shape of the eigenvector. While the integral
 $I_q$ has contributions from the whole channel height,
 $C_\mathrm {Re}$ represents terms from the boundary. The smaller their ratio is, the more the eigenvector spreads over
 $y$.
With this in mind, we go back to the numerical solutions of (4.1) in search of eigenvalues corresponding to (4.11). We seek the eigenvalues represented by black dots in figure 7(a). In order to do this, the phase of control is set to  $\phi ={\rm \pi}$ for each
 $|A|$, and the full set of real-valued eigenvalues
 $c$ and eigenvectors
 $\hat {v}$ is obtained numerically. They are then filtered to get the eigenvalue–eigenvector pair with the largest advection speed subject to conditions
 $c_r \le 0$ or
 $c_r \ge U_{max}$. Otherwise, when
 $0< c_r < U_{max}$, the eigenvalues with
 $\phi = \pm {\rm \pi}$ appear in the region already populated by the rest of the neutrally stable modes (like those marked with black dots in figure 6a,c), and it is difficult to identify them. This also implies that the range of control gains is limited by the values of
 $|A|$ near the flip. Using the corresponding eigenvectors, it is straightforward to calculate
 $C_\mathrm {Re}$ and
 $I_{1,2,3}$ from (4.10), and
 $c_r^\pm$ using (4.13).
Figure 7(b) presents both  $F^\pm _N$ and
 $F_D$ from (4.13) as functions of
 $|A|$ near the flip. The numerator
 $F^+_N$ is a positive increasing function of
 $A$, while the denominator
 $F_D$ changes sign from negative to positive as the gain crosses
 $|A|_f \approx 1.835$. Thus,
 $c_r^+$ is negative when
 $|A|<|A|_f$, and positive afterwards, going through a hyperbolic infinity at
 $|A|_f$. Figure 7(c) shows an excellent agreement between
 $c_r^+$ from (4.13) and the eigenvalues with the largest magnitudes of advection velocity from figure 7(a). This agreement is expected since we used the eigenvectors of (4.1) to evaluate (4.13); however, numerical analysis of (4.1) did not allow for qualitative explanation of the flow behaviour. With the help of (4.13), the inflation, flip and deflation of the eigenvalue circular motion can now be inferred from the relation between
 $F_D$ and
 $F^+_N$ in figure 7(b).
Unlike  $F^+_N$, the second numerator
 $F_N^-$ closely follows the behaviour of the denominator, so the related root
 $c_r^-$ stays bounded across
 $|A|_f$ and is of the order of unity. This root is in the range of ‘regular’ eigenvalues of the Rayleigh equation,
 $U_{min}< c_r^- < U_{max}$, and is unrelated to the eigenvalues that undergo the flip. The results in figure 7(a–c) were given for
 $k_x h =6$,
 $k_z = 0$, but qualitatively similar results can be obtained for other wave modes. In fact, (4.1) depends only on the square of the effective wavenumber,
 $\kappa ^2$, and not on a particular realization of
 $k_x$,
 $k_z$. In figure 7(d) we show the dependence of
 $|A|_f$ on
 $\kappa$, together with the zeros of the function
 $I_1 (|A|)$. The agreement is again very good; we observe that
 $|A|_f$ increases linearly with
 $\kappa ^2$. This results in the upward shift of the unstable regions, analogous to that in figure 6(d), as
 $\kappa$ grows and the wavelength becomes smaller.
Further progress can be made if we relate the analytical form of the integrals in (4.10) to the control gain through boundary conditions (4.7a,b), but that non-trivial task will not be pursued here. From this point on, we will include viscosity in our analysis in order to make it more comparable to channel flow in DNS. Channel flow is wall-bounded and viscosity becomes important near the channel walls, so one can expect the inviscid instability observed above to be modulated by viscous effects.
5. The effect of turbulent viscosity
5.1. Eigenvalue spectra and similarity with the inviscid flow
Compared to the inviscid flow, the eigenvalue spectrum of the viscous problem is more complex. In the conventional linear stability analysis of plane Poiseuille flow close to transition to turbulence, where linearized equations include only molecular viscosity, the eigenvalues are located on three branches: A ( $c_r/U_{max} \to 0$), P (
 $c_r/U_{max} \to 1$) and S (
 $c_r/U_{max} \approx 2/3$ for
 $k_x h =1$,
 $k_z =0$) (Mack Reference Mack1976; Schmid & Henningson Reference Schmid and Henningson2012, p. 64). In that case, the unstable eigenmode originates from the A branch, and is called a Tollmien–Schlichting wave. This Y-shaped eigenvalue spectrum, typical of transitional wall-bounded flows, is preserved under the influence of the eddy viscosity in the flow without control.
In figure 8(a), we use the eigenspectrum of the uncontrolled flow with  $k_x h =6$,
 $k_z =0$ (black dots) to illustrate this. There are also some differences with respect to the flow with only molecular viscosity. Only two eigenvalues remain on branch A, branch P is slightly deformed, and branch S is shifted towards
 $U_{max}$ (and larger
 $c_r$). More importantly, the uncontrolled turbulent mean profile is stable in the presence of turbulent viscosity, as found by Reynolds & Tiederman (Reference Reynolds and Tiederman1967). With control, most of the eigenvalues move slightly from their uncontrolled locations. If the control with
 $|A| =1$,
 $\phi = 0$ is applied, two identical eigenvalues appear in the vicinity of the branch P (see point 1 in figure 8a). When the phase is positive and increasing, they move towards the left in figure 8(a), and their
 $c_r$ becomes smaller. As their growth rate becomes larger, they cross
 $c_i = 0$, and the flow becomes unstable. At the same time, another pair of identical stable eigenvalues appears near the branch S (point 2 in figure 8a). When
 $\phi <0$ and is decreased further, these eigenvalues also move to the left towards smaller
 $c_r$, until they join the eigenvalues with
 $\phi >0$ at
 $\phi = \pm {\rm \pi}$, which are stable. The dependence of the eigenvalues on
 $\phi$ resembles a circular motion, like in the inviscid case (figure 6b).
(a,b) Eigenvalue spectrum of the viscous problem as a function of  $\phi$, for
 $k_x h =6$ and
 $k_z=0$: (a)
 $|A| = 1$ and (b)
 $|A|=2$. Colour and symbols are as in figure 6(a). The black
 $\bullet$ symbols indicate the uncontrolled flow. See text for the description of the branches A, P and S, and the points 1 and 2. Some eigenvalues from the branches P and S were removed or made more transparent for clarity. Both axes have the same scale. (c,d) Imaginary part,
 $c_i$, of the eigenvalues as a function of control phase
 $\phi$: (c)
 $|A| = 1$ and (d)
 $|A|=2$. Solid line, viscous problem; dashed line, inviscid flow. Colour, from dark to light:
 $k_x h\in [1,6]$.

For  $|A|=2$ the circular motion of the eigenvalues changes its direction (figure 8b). Here, the eigenvalues move towards increasing
 $c_r$ as
 $|\phi |$ increases, i.e. the unstable eigenvalues move clockwise and their stable counterparts move anticlockwise until they meet at
 $\phi =\pm {\rm \pi}$. Similarly to the inviscid flow (figure 6b,c), the eigenvalues follow quasi-circular paths that flip their direction as
 $|A|$ increases. The axis of symmetry of these paths, however, is now located below
 $c_i = 0$, where the flow is stable. We observed a similar behaviour of eigenvalues for all large wave modes of the viscous flow.
Figures 6(b,c) and 8(a,b) give a qualitative overview of the eigenvalue behaviour under the change of control phase  $\phi$, but provide few quantitative details. To further clarify the dependence of the instability on
 $\phi$, we plot the imaginary part
 $c_i$ of the eigenvalue with the largest growth rate as a function of
 $\phi$ and
 $k_x$ in figure 8(c,d). Both viscous (solid lines) and inviscid (dashed lines) growth rates are presented. Again, we set the control gain to be
 $|A|=1$ (figure 8c) or
 $|A| =2$ (figure 8d). At these values of
 $|A|$, there are no unstable eigenvalues when
 $\phi <0$, so the data are plotted only in the half-plane
 $[0, {\rm \pi}]$. In the case of
 $|A| =1$, there is a well-defined maximum in
 $c_i$, which moves towards smaller
 $\phi$ as
 $k_x$ decreases, and its amplitude decreases with
 $k_x$. For example, for
 $k_x h= 1$ the maximum instability growth is attained near
 $\phi _{max} = 3.1$, while for
 $k_x h= 6$ it is around
 $\phi _{max} = 2.5$. In the case of
 $|A|=2$, there still exists a pronounced maximum in
 $c_i$, but the most unstable phase now increases with
 $k_x$. For example,
 $\phi _{max} \approx 2.6$ for
 $k_x h =1$, and
 $\phi _{max} \approx 3.04$ for
 $k_x h =6$. Similar trends can be seen in the real part of the eigenvalue
 $c_r$ (not shown here), with one important addition: negative values of
 $c_r$ are observed for
 $|A| = 1$, while
 $|A| = 2$ results in positive
 $c_r$, as expected from the eigenvalue flip in figures 6(b,c) and 8(a,b). The similarity of the eigenvalue behaviour in the viscous and inviscid cases in figure 8(c,d) is remarkable, indicating that we observe the same instability of inviscid origin.
To probe this similarity further, we plot in figure 9(a) the isocontours of viscous growth rate for various  $k_x$, and
 $k_z =0$, as a function of
 $|A|$ and
 $\phi$. With the help of this plot, we will first discuss the common features of the viscous and inviscid stability. Visual inspection shows that the shape of viscous isocontours with large
 $c_i$ resembles the shape of inviscid ones in figure 6(d). For each
 $A$, the growth rate increases with
 $\phi$. We marked by circles the pairs
 $(|A|_f,\phi _f)$ where the instability reaches its maximum growth. Analogously to the inviscid case, the eigenvalue motion flips its direction at
 $|A| = |A|_f$, as discussed above. The phase
 $\phi _f$ is near
 ${\rm \pi}$ for all observed wave modes, the gain
 $|A|_f$ shifts upwards with increasing
 $k_x$, at the same time as the unstable region shifts upwards itself. We search again for
 $|A|_f$ as a function of the effective wavenumber
 $\kappa ^2 = k_x^2 +k_z^2$, and plot it in figure 7(d) together with the inviscid data. Two cases are considered: first, setting
 $k_z=0$, while varying
 $k_x h\in [1,20]$; and second, fixing
 $k_x h =1$, and varying
 $k_z h \in [1,20]$. One can appreciate that
 $|A|_f$ again depends linearly on
 $\kappa ^2$ in the viscous flow, with the results being almost identical to those in the inviscid case. Therefore, the shift of the instability region towards higher control gains at large wavenumbers is an inviscid phenomenon, suggesting that (4.1) governs the instability behaviour in a substantial part, even in presence of turbulent viscosity.
(a) Stability maps for the viscous problem, analogous to figure 6(d), with  $c_i /U_b \in [0, 0.1, 0.5]$. Solid line,
 $k_x =1$; dash-dotted line,
 $k_x = 2$; and dashed line,
 $k_x = 20$; with
 $k_z = 0$ for all. For each
 $k_x$, the red
 $\bullet$ symbol denotes the most unstable
 $(|A|_f,\phi _f)$ pair. Vertical coloured lines represent
 $\phi = [-3{\rm \pi} /4, 0, 3{\rm \pi} /4]$ for panel (b). (b) Eigenvalue spectrum of the viscous problem as the function of
 $|A|$ along the vertical lines in panel (a), for
 $k_x = 2$,
 $k_z=0$. Symbols: red,
 $\phi = 3 {\rm \pi}/4$; green,
 $\phi =0$; and blue,
 $\phi = -3 {\rm \pi}/4$; with colour intensity increasing with
 $|A|$. The black
 $\bullet$ symbols show the spectrum of the uncontrolled flow with branches A, P and S. Stable eigenvalues from the branches P and S were made more transparent. (c) A zoom into the black rectangle marked in panel (b). Stable eigenvalues of the branch P were removed for clarity. (d) The maximum growth rate
 $c_i$ as a function of
 $|A|$:
 $\phi = -3 {\rm \pi}/4$ (blue) and
 $\phi = 3 {\rm \pi}/4$ (red). Solid line, viscous flow; dashed line, inviscid;
 $k_x =20$,
 $k_z = 0$.

5.2. Saturation of eigenvalues at large control gains
Now back to the notable differences between the stability maps in figures 6(d) and 9(a). Recall that the instability is confined to the region with  $\phi \in [0,{\rm \pi} ]$ for the inviscid flow. In that region, the growth rate
 $c_i \to 0$ when
 $|A| \ll 1$, and it increases with
 $|A|$. After reaching the maximum at
 $|A|_f$,
 $c_i$ decays, and the inviscid flow becomes neutrally stable again when
 $|A| \gg 1$. In contrast to this, viscosity has a damping effect on the instability at low values of
 $|A|$, and no eigenvalue has a positive growth rate in the bottom half-plane of figure 9(a). The viscous flow becomes unstable when
 $|A|\sim O(1)$, and the instability is confined to the region with
 $\phi \in [0,{\rm \pi} ]$ for low
 $|A|$. As
 $|A|$ increases further, the instability does not cease to exist for most of the wave modes, except for the special case of
 $k_x h =1$. Unlike in inviscid flow, unstable eigenvalues also appear for the negative phases,
 $\phi \in [-{\rm \pi}, 0]$, where inviscid flow would be stable, as indicated by the neutral isocontours of
 $c_i = 0$. In other words, some parameter regions in figure 9(a), characterized by large
 $|A|$, are unstable for all
 $\phi$.
Concerned with this issue, we fix three phases  $\phi = [-3 {\rm \pi}/4, 0, 3 {\rm \pi}/4]$ and compute the eigenvalue spectrum, now as a function of
 $|A|$. The results are presented in figure 9(b) for
 $k_x h=2$ and
 $k_z=0$. For each amplitude, the eigenvalues again come in pairs. In this case,
 $k_x h=2$ is large enough and the eigenvalues of these pairs are not identical, but the difference between them is already much smaller than, say, for
 $k_x h = 1$. It becomes apparent that the eigenvalues affected by control at
 $\phi = \pm 3{\rm \pi} /4$ are connected to the branch A rather than branch P of the uncontrolled flow. At first, the real part of the eigenvalues decreases with the increase of
 $|A|$, indicating the motion of eigenvalues towards the left half of the complex plane, and the expansion of the eigenvalue circle. As
 $|A|$ passes through
 $|A|_f$, this dynamics is reversed and the real part of the eigenvalue begins to increase. The difference between
 $\phi = 3{\rm \pi} /4$ and
 $\phi = -3 {\rm \pi}/4$ is, obviously, that the growth rates of the eigenvalues exhibiting circular motion become positive in the first case, and even more negative in the second. In the inviscid flow, the case of
 $\phi = 0$ is neutrally stable and the eigenvalues do not depart from
 $c_i =0$. In the viscous flow,
 $\phi = 0$ eventually becomes unstable, although its eigenvalues have increasing
 $c_r$ for all
 $|A|$, unlike when
 $\phi = \pm 3 {\rm \pi}/4$.
Figure 9(c) shows a zoom in an area where the unstable eigenvalues for all  $\phi$ approach each other asymptotically as
 $|A| \to 10^2$ (the rest of the eigenvalues have been removed for clarity). As this happens, the eigenvalues for all three values of
 $\phi$ saturate at a small but positive value. These eigenvalues are not spurious, as our numerical resolution tests confirm in Appendix C. The case of
 $\phi = - 3 {\rm \pi}/ 4$ has a particularly interesting behaviour. There, the unstable eigenvalues originate from the branch P rather than the branch A moving upwards as
 $|A|$ increases. Note that
 $\phi = 0$ is still connected to the branch
 $|A|$, and an approximate threshold of the change in the origin from the branch A to the branch P is at about
 $\phi = - {\rm \pi}/16$.
Finally, in figure 9(d) the phenomenon of eigenvalue saturation is addressed quantitatively, with the maximum growth rate  $c_i$ as a function of
 $|A|$. The growth rates are calculated for
 $k_x= 20$ and
 $k_z = 0$, to highlight that shorter wavelengths have a similar behaviour, and also because the maximum in
 $c_i$ is weaker, and therefore fits better for visualization purposes. We can think of the solid curves in figure 9(d) with respective colours as following the red upper path in figure 9(b) and the blue path in figure 9(c) (except for the small values of
 $|A|$, when the growth rates on branch P are larger). For
 $\phi = 3{\rm \pi} /4$, the peak in
 $c_i$ correlates well in the viscous and inviscid cases, with
 $c_i$ decaying asymptotically to zero in the latter, and saturating at a small value in the former. In contrast to this, when
 $\phi = -3 {\rm \pi}/4$, the inviscid case is always neutrally stable, as expected, and the viscous
 $c_i$ slowly saturates to a positive level with the increase in
 $|A|$. This saturation indicates that when magnitude of the input at the walls is very strong, the flow becomes relatively insensitive to the control phase.
5.3. The effect of control on the shape of the eigenvectors
Finally, we show the influence of the control gain on the wall-normal shape of the eigenvectors as  $|A|$ increases, and
 $\phi$ remains fixed. It is reasonable to track the evolution of the eigenvectors with
 $|A|$ along one of the paths in figure 9(b,c), rather than by a simple criterion of the maximum growth rate, where eigenvectors can belong to different branches. We consider here the eigenvectors with
 $k_x h = 2$,
 $k_z = 0$, associated with the eigenvalues along the red upper path with
 $\phi = 3{\rm \pi} /4$ in figure 9(b), as it is the most unstable one. For simplicity, only symmetric eigenmodes are presented, because the near-wall behaviour of the antisymmetric modes is quite similar.
Figure 10(a) shows the absolute value of  $|\hat {v}|$ close to the wall, normalized with its maximum, for
 $|A| < 1$. Small values of the gain barely affect the eigenvector, which is very similar to the respective uncontrolled eigenvector from the A branch. For
 $|A| = 0.05$ the flow is still stable. As
 $|A|$ increases to
 $0.5$, the flow becomes unstable, and
 $|\hat {v}|$ increases at the wall and the bulk of the flow. The shape of the eigenvector at the wall flattens when
 $|A|$ is increased further.
(a) Normalized eigenvectors of wall-normal velocity as a function of  $y$ along the red upper path in figure 9(b), for
 $\phi = 3 {\rm \pi}/4$,
 $k_x h =2$ and
 $k_z = 0$. Colour intensity increases with
 $|A| \in [0.05, 0.52, 0.91]$. The black dashed line shows the eigenvector of the uncontrolled flow from the A branch (
 $|A| = 0$). (b) As in panel (a) but for
 $|A| \in [0.91, 1.9, 5, 100]$. The vertical dash-dotted line in panels (a) and (b) denotes the detection plane
 $y_d/h = 0.1$. (c) The unstable eigenvectors of the viscous problem (solid lines) as a function of wavenumber
 $k_x h \in [1,2,4,6,8,12,20]$ (decreasing), for
 $k_z = 0$,
 $\phi = 3 {\rm \pi}/4$ and
 $|A| = |A|_f (k_x)$ (see figure 7d). The dotted lines are the eigenvectors of the inviscid flow at the same control parameters. Only symmetric eigenvectors are shown.

Figure 10(b) shows the evolution of eigenvectors for larger  $|A|$. Now
 $\hat {v}$ decreases in the bulk of the flow, and at large enough
 $|A|$ changes sign with respect to its value at the walls. In the plot for
 $|\hat {v}|$, it is reflected by a developing minimum between the wall and the middle of the channel, which tends to
 $y_d/h = 0.1$ when
 $|A|\gg 1$. Apparently, for these extreme gains, the linear system adjusts the velocity at
 $y_d$ to be zero, following condition (2.2). Effectively, this creates a ‘narrower’ channel and the instability is weakened as the control gain increases; the respective growth rate saturates at
 $c_i =0.03$ for
 $|A|=100$ (see figure 9c).
A note of caution must be placed here: the eigenvectors fill the whole height of the channel because the harmonic we show here is quite long ( $k_x h = 2$). This does not happen to shorter modes with larger
 $k_x$, which peak near the walls and decay towards the centre of the channel. We show this effect in figure 10(c) comparing the shape of eigenvectors at the control gains
 $|A|_f (k_x)$ that result in the largest growth, and
 $\phi =3 {\rm \pi}/4$, as in the previous plot. The choice of
 $|A|_f$ to represent the behaviour of eigenvectors with
 $k_x$ is motivated by the fact that the instability is the strongest there and the instability isocontours for different wavenumbers scale better with
 $|A|= |A|_f$ (figure 9a). The eigenvector with
 $k_x h=1$ fills the entire channel, as in the previous case. The eigenvectors with
 $k_x h = 2,4$ still fill the entire channel, but their absolute value in the bulk of the flow decreases with
 $k_x$. As
 $k_x$ is further increased, the eigenvectors no longer occupy the middle of the channel, and are bounded to a region near the wall. The width of this region decreases with
 $k_x$. The eigenvectors of the viscous flow are in reasonable agreement with those of the inviscid flow, and this agreement becomes better with increasing
 $k_x$, indicating again that the instability is largely inviscid at its peak.
5.4. Wavenumbers affected by the instability
The above discussion emphasizes the effect of large control gains  $|A|>1$, but gains larger than
 $O(1)$ are unlikely to be beneficial in terms of drag reduction. Besides the negative effects of the linear instability discussed above, large gains imply a large energy input at the walls and therefore a large cost of the control. In the following, we perform an optimization that aims to find out which wavenumbers are the most affected by the instability of the viscous flow for reasonably small values of
 $|A| \in [10^{-2}, 1]$. The importance of this optimization stems from the necessity to exercise caution with these length scales in future numerical and laboratory experiments. We seek the wavenumbers that have the maximum growth rate in this range of
 $|A|$, and also maximize
 $c_i$ over
 $\phi \in [-{\rm \pi}, {\rm \pi}]$.
Figure 11(a) shows the resulting stability map as a function of  $k_x h$,
 $k_z h \in [0,15]$, each point of it corresponding to a pair of
 $(|A|, \phi )$ that results in maximum
 $c_i$ for the wave mode of
 $k_x, k_z$. The control appears to be more dangerous for longer waves with smaller
 $k_x$. The contours of
 $c_i$ are centred around
 $k_x h = 1$,
 $k_z=0$, indicating that the instability there grows faster. Large wavenumbers are not affected by the instability when the gain is small enough, and the wavenumbers with
 $k_x h \geq 13$,
 $k_z h \geq 7$ remain stable.
(a) Contours of the maximum imaginary part of the eigenvalue  $c_i/U_b$ as a function of wavenumbers,
 $k_x$ and
 $k_z$. (b) Contours of corresponding
 $c_r/U_b$. For each
 $k_{x,z}$ pair we search for the maximum growth rate and its respective
 $c_r$ in a range of amplitudes
 $A \in [10^{-2},1]$ and phases
 $\phi \in [-{\rm \pi}, {\rm \pi}]$. The dash-dotted line is the neutral stability curve with
 $c_i = 0$.

Figure 11(b) shows the phase velocity  $c_r$ of the modes with the largest
 $c_i$. As discussed in § 4, the unusual effect of this instability is the appearance of negative phase velocities. For the most unstable modes, they are up to four times faster than the maximum of the mean profile (which on the scale of the colour bar is approximately
 $1$). These upstream-travelling modes, in the form of spanwise rollers, can be observed in the DNS during the linear growth phase in the corresponding parameter regimes. Lastly, we see in figure 11 that high
 $k_x$ harmonics with infinite spanwise extent (
 $k_z = 0$) are more affected by the instability than harmonics with higher
 $k_z$. In fact, the growth rates of wavenumbers with
 $k_z>0$ are smaller than those with
 $k_z = 0$. We note that the range of unstable wavenumbers in figure 11 partially coincides with the wavenumbers controlled in our DNS (
 $k_x h\in [0,6]$,
 $k_z h \in [0,10]$ in table 1).
In the following, we will compare the linearized controlled flow to the DNS results, employing the wavelengths with  $k_z = 0$ as a proxy for the linear dynamics of the channel. This comparison will be done for
 $|A| \leq 1$, as discussed above. But before we move on, we should emphasize the potential importance of our results with
 $|A|>1$ in §§ 4.3 and 5.2. Large control gains, although not very promising for drag reduction, are not unphysical and should be explored for enhancement of friction and mixing. In addition, the flip of the eigenvalue motion happens for gains just slightly above
 $|A| =1$ for very large wavelengths, which are of the same order of magnitude as in the ‘classic’ opposition control, and therefore may potentially affect its experimental implementations. More importantly, the flip itself is an exciting physical phenomenon of the linearized controlled flow, which has not been explored before.
6. Reconciling DNS and linear dynamics.
6.1. Instability and the drag increase in the DNS
Equipped with the findings from the previous section, we are in a position to explain some of our DNS results. In the DNS, we focused on relatively small control gains  $|A| \leq 1$, where the instability is active for positive phases and does not exist for negative ones (figure 9a). Positive control phases correspond to negative streamwise shifts, and therefore a drag increase at large upstream shifts,
 $x_0 < 0$, in figure 3(a) is intuitively expected. It is more surprising that the simulations also diverge on the right of figure 3(a) where
 $x_0 >0.55$, without a preceding gradual increase in friction. This seemingly odd result can be explained if the
 $2{\rm \pi}$-periodicity of the control coefficient
 $A$ is taken into account, namely, a negative phase
 $-{\rm \pi} <\phi _1 < 0$ and a positive phase
 $\phi '_1 = 2{\rm \pi} + \phi _1$ result in the same value of
 $A$.
To eliminate this redundancy, we project the phases of the streamwise modes controlled in our DNS on the  $(-{\rm \pi}, {\rm \pi})$ unit circle and plot them in figure 12(a) as a function of the streamwise shift
 $x_0$. Let us first focus our attention on the left half of the plot,
 $x_0<0$. As the shift decreases from
 $x_0=0$, the phase applied to the controlled harmonics grows, indicating that they may become unstable. The unstable interval of
 $x_0$ for each
 $k_x$ is drawn dotted in figure 12(a), computed for
 $|A| =1$ with linear stability analysis from § 5. The exact threshold depends on
 $k_x$, but the dashed horizontal line
 $\phi = 0.06{\rm \pi}$ approximately separates the stable and unstable regimes. The first wavenumbers to become unstable are
 $k_x h =3$,
 $4$ and
 $5$ at the shift
 $x_{cr} \approx -0.05$, immediately followed by
 $k_x h = 6$. Longer modes with
 $k_x = 1,2$ become unstable one after the other shortly after as
 $x_0$ decreases further.
(a) The control phase  $\phi$ as a function of streamwise wavenumber and the shift
 $x_0/h$. The red dotted lines highlight the presence of the instability for
 $|A|=1$. The horizontal thin dashed black line is the minimum phase for the onset of the instability. Colour, from dark to light, represent:
 $k_x h\in [1, 2,3,4,5,6]$. Shaded regions are the same as in figure 3(a). (b) Plot of
 $c_i$ as a function of
 $x_0$ and
 $k_x$; dashed line,
 $c_i = 0$; colours as in panel (a);
 $|A|=1$. (c) The
 $\bullet$ symbols are the friction factor normalized with its minimum (DNS results). Linear instability growth rates: solid line,
 $k_x h = 6$; dash-dotted line,
 $k_x h= 5$; dotted line,
 $k_x h = 4$. Blue colour is
 $|A| = 1$, and red is
 $|A| = 0.7$. The horizontal dashed black line is the neutral stability line
 $c_i = 0$. The
 $x$-axis is shifted by the minimum
 $x_0$ required to trigger the instability,
 $x_{cr} = (-0.05, -0.15)$ for
 $|A| = (1, 0.7)$. (d) The dashed lines show the most rapidly growing wavenumbers in the diverging DNS cases. The blue circles correspond to the wavenumbers with maximum growth rate in the linear stability analysis. In all cases,
 $k_z = 0$.

To simplify the following discussion, let us focus on the wavenumber  $k_x h = 6$ with the most rapidly growing phase (larger
 $k_x$ implies larger
 $\phi$ for the same
 $x_0$). With further decrease of
 $x_0$, the phase of
 $k_x h= 6$ reaches
 $\phi = {\rm \pi}$ at
 $x_0/h \approx -0.5$, beyond which the phase of
 $A$ becomes negative (bottom left corner in figure 12a), and
 $k_x h= 6$ becomes stable again. The situation is different for
 $x_0>0$. As expected, the phase of
 $k_x h = 6$ is negative at first and further decreases as
 $x_0$ increases, until it reaches
 $-{\rm \pi}$ at
 $x_0 \approx 0.5$. When the streamwise shift is increased further, the value of
 $\phi$ changes from
 $-{\rm \pi}$ to
 ${\rm \pi}$. Now it is equivalent to a large positive phase shift and the flow becomes unstable again. The phases of the rest of the streamwise wavenumbers vary in a similar manner.
It is worth mentioning here that approaching the instability on the left side in figure 12(a) is different from approaching it on its right-hand side, because the behaviour of the two limits of the instability range is different. Figure 12(b) shows how the growth rate  $c_i$ of the most unstable eigenvalues varies for each wavenumber
 $k_x$ along the lines in figure 12(a). Linearly unstable wavenumbers are those for which
 $c_i >0$, corresponding to the dotted segments in figure 12(a). Note that this plot is similar to figure 8(c) in § 5.1, but with
 $x_0$ instead of
 $\phi$ as an argument, so that the
 $c_i$ curves are shifted with respect to each other. If we again follow
 $k_x h =6$ as we make
 $x_0$ increasingly negative (i.e. approaching the instability on the left), the instability growth rate changes slowly, progressively increasing from negative to slightly positive values.
A different picture emerges if we begin to increase  $x_0$, starting from
 $x_0 = 0$ (i.e. approaching the instability on the right). Here at the onset of instability,
 $x_0 = 0.55$, the
 $c_i$ curve is almost perpendicular to the
 $x$-axis and grows sharply. This reflects an abrupt transition of the flow to the instability when the phase of control changes from
 $-{\rm \pi}$ to
 ${\rm \pi}$. A further small increase in
 $x_0$ brings the flow to its maximum
 $c_i$. In fact, the unstable ‘bumps’ in
 $c_i$ on the left and on the right of the plot are exactly the same, arising from control with identical
 $\phi$ (and
 $A$), and it is their asymmetry that matters for the development of the instability. This asymmetry is also visible in figure 8(a), where the growth rates increase progressively as the control phase is increased from zero, but would rapidly reach their maximum if the control phase is decreased from
 ${\rm \pi}$.
Another important observation is that whether we approach instability on the left or on the right, at its onset the growth rate of  $k_x = 6$ is larger than that of the rest of the controlled wavenumbers. This is either because the control phase of
 $k_x =6$ grows faster as
 $x_0$ decays (on the left), or because its phase has a shorter period on
 $x_0$ (on the right), as seen in figure 12(a). Besides that,
 $k_x h = 6$ has the largest effective growth rate,
 $\omega _i = k_x c_i$, given comparable values of
 $c_i$ for the rest of the unstable wavenumbers in figure 12(b). Therefore, one would expect the unstable flow to be dominated by this wavelength close to the onset of instability. For example, the onset of the instability of
 $k_x h =6$ on the right correlates with the unexpected increase in friction on the right in figure 3(a), and the resulting divergence of our DNS.
In figure 12(a,b), the onset of the instability on the left correlates with the steep friction increase on the left in figure 3(a). Thus, we next focus our attention on the relation between the instability growth and the increase in friction in the DNS at negative streamwise shifts.
Figure 12(c) presents both  $C_f$ and
 $c_i$ as functions of streamwise shift, similarly to figure 3(a). But unlike in figure 3(a), the
 $x$-axis is shifted by the minimum
 $x_0$ leading to the instability. In the following, we will refer to this minimum as the critical value of the streamwise shift
 $x_{cr}$. Its value is not universal and depends on the most unstable wavenumber and on the control gain. In the linearized flow corresponding to our DNS,
 $x_{cr}\approx -0.05$ for
 $|A|=1$ and
 $x_{cr}\approx -0.15$ for
 $|A|=0.7$. Presented in this way, positive values on the
 $x$-axis are linearly stable, and negative ones are unstable. When the flow is linearly stable,
 $c_i$ stays at a relatively constant level, which depends more on
 $k_x$ than on the control gain. We focus on
 $k_x h = 6$ again, as it quickly attains the largest growth due to its fastest-growing control phase, and dominates the flow dynamics. Approaching
 $x_0 - x_{cr}= 0$ from the right, the imaginary part of the eigenvalue begins to increase shortly before the critical point until the flow becomes unstable. After a further growth,
 $c_i$ reaches its maximum and then quickly decays to the previous stable levels. The DNS behaviour is remarkably similar. Although the friction rises slightly before
 $c_i$ experiences growth itself, i.e. before
 $x_{cr}$, the pronounced growth in friction factor for
 $|A| = 1$ on the left of the plot correlates well with the increase in
 $c_i$. After some point, however, we are unable to advance our DNS further and the behaviour of
 $C_f$ past the growth rate maximum is unclear. Figure 12(b) suggests that the instability at
 $k_x =6$ would be subsequently overtaken by
 $k_x =5$, then by
 $k_x=4$ and so on as we shift the control further upstream, towards more negative
 $x_0$.
To support this conjecture, we performed additional simulations with  $|A| = 0.7$. Here the linear analysis predicts a slower instability growth (compare the red and blue solid lines in figure 12c), and, indeed, we can explore a wider range of
 $x_0$ in the DNS. The
 $C_f$ curves collapse well both in the stable regime and close to the onset of instability for the two values of control gain. Again, the friction factor growth correlates with the onset of instability. The instability at
 $|A| = 0.7$,
 $k_x h =6$ is observed in a narrower range of
 $x_0$, its growth rate reaches its maximum at smaller
 $|x_0 - x_{cr}|$ than when
 $|A| =1$, and also decays faster with
 $x_0$. As the control shifts towards more negative
 $x_0$, the phase of the next longer mode,
 $k_xh=5$, becomes positive enough so that eventually its growth rate becomes larger than that of
 $k_x h=6$. When
 $c_i(6)$ reaches its maximum and begins to decay,
 $c_i(5)$ is still growing, and
 $k_x h=5$ becomes the dominant mode. This is reflected in the change of slope in
 $C_f$ at about this location, and also in the spectrum of
 $v$ (not shown here). At even larger shifts,
 $k_xh=4$ becomes dominant.
Finally, to confirm that the linear instability is the cause of significant drag increase and the failure to converge the DNS at larger  $x_0$, we show in figure 12(d) the wavenumbers that grow faster as the DNS diverges, and compare them to the controlled wavenumbers with the largest linear growth rate. Those wavenumbers should outgrow the rest when the instability develops, and this is indeed observed in the DNS. As explained above, the wavelength governing the instability becomes longer for larger
 $|x_0|$. Note that all these wave modes have
 $k_z =0$ and therefore represent a spanwise roller, similar to that in figure 4(b).
6.2. The influence of control gain on transition to instability
Further comparison between the linear stability analysis and the DNS gives valuable information about the nature of the flow transition to a new state at both stability edges of figure 12(a,b). We draw our attention again to the relation between friction levels in DNS and the linear instability growth rates, but now as a function of  $|A|$.
Figure 13(a) shows the DNS time history of  $Re_\tau$ for
 $x_0 = -0.3$, close to the onset of instability on the left-hand side of figure 12(b). The initial growth of
 $Re_\tau$ is stronger with increasing
 $|A|$. It can be clearly discerned for
 $A= 1.0$ and
 $0.8$, accompanied by less robust but still noticeable initial increase in
 $Re_\tau$ at
 $|A|=0.7$ and
 $0.6$. After the initial growth phase, the flow saturates to a new turbulent state with higher
 $Re_\tau$ than that of the uncontrolled flow. The amplitude of the
 $Re_\tau$ fluctuations also intensifies, compared to the uncontrolled flow or parameter regimes where the instability is inactive, i.e.
 $|A| = 0.5$. The saturation of the initial growth takes place on a time scale of the order of the eddy turnover time (
 $u_{\tau 0}t/h \approx 1$), which explains the choice of normalization factor in this plot.
(a,b) Friction Reynolds number, normalized with  $Re_{\tau 0}$ of the uncontrolled case, as a function of time. Time is normalized with the eddy turnover time
 $h/u_{\tau 0}$. The control gain
 $|A|$ grows with colour intensity. (c,d) The largest growth rates of eigenmodes as a function of controlled
 $k_x$,
 $\phi$ and
 $|A|$, with
 $k_z =0$. The horizontal dashed line is the neutral stability border with
 $c_i = 0$. The smaller the symbol size, the larger is
 $|A|$. The
 $x_0$ and
 $A$ values are as follows: (a,c)
 $x_0 = -0.3$,
 $A \in (0.5, 0.6, 0.7, 0.8, 1)$; (b)
 $x_0 = 0.55$,
 $|A| \in (0.5, 0.9, 0.95, 0.96, 0.97)$; and (d)
 $x_0 = 0.55$,
 $\bullet$,
 $|A| \in (0.5, 0.9, 0.95, 0.96, 0.97)$, and
 $\bigcirc$,
 $|A| \in (1.0, 1.1, 1.15)$.

Now let us compare the behaviour of  $Re_\tau$ to the growth rates obtained with linear analysis. In figure 13(c) these growth rates are calculated at
 $x_0 = -0.3$, for the same values of
 $|A|$ as in figure 13(a). The growth rates of the longest, most unstable wavenumbers continuously increase with
 $|A|$ and cross the neutral stability line
 $c_i = 0$ when
 $|A| \in [0.5, 0.6]$. This interval correlates with the onset of drag increase in the DNS in figure 3(b). The gradual increase in wall friction in figure 13(a), attributed to the presence of instability in figure 13(c), indicates a supercritical transition occurring at negative streamwise shifts.
In figure 13(b), we show the time history of  $Re_\tau$ for
 $x_0 = 0.55$, the right-hand side limit in figure 3(a). The initial growth of
 $Re_\tau$ here is much shorter than in figure 13(a). When
 $|A|$ is relatively small, the simulations saturate on a low friction level, where
 $Re_\tau$ increases only by 10–20 % with respect to the base flow, as opposed to the 100–200 % increase in figure 13(a). At
 $|A| \approx 0.95$, two well-discernible frequencies appear and modulate the flow evolution. Further increase in
 $|A|$ makes the flow wander away from this modulated state. Although we cannot reach the final high-frequency flow state with our DNS, during the transition we observed that the most rapidly growing wavelengths are roller-type structures (figure 12d). This suggests that the final state is also dominated by large-scale rollers, similar to those in figure 4(b).
Again, we continue by plotting the growth rates corresponding to  $x_0 = 0.55$, as a function of
 $k_x$ and
 $|A|$ (figure 13d). Here the flow remains linearly stable at the amplitudes corresponding to figure 13(b), and there is no noticeable change in
 $c_i$ until
 $|A| \approx 1$. This control gain value is higher than
 $|A| = 0.96$, already resulting in transition to a high-frequency state in the DNS in figure 13(b). If we keep increasing
 $|A|$, the longest wavenumber
 $k_x =6$ becomes unstable, as the only wavenumber with positive phase. Its
 $c_i$ grows more rapidly with
 $|A|$ than for
 $x_0 = -0.3$, reaching similar levels with a smaller relative increase in the control gain. The appearance of additional frequencies, modulating the flow, and also the fact that the transition occurs earlier in the DNS, suggest that the transition to the new state for
 $x_0 = 0.55$ in figure 12(a,b) is subcritical.
7. Response to the forcing
Figure 12 shows that the flow is linearly stable in the range of  $0 \leq x_0<0.55$ for the control parameters corresponding to our DNS. Therefore, the near-wall oblique waves from figure 4(c) are caused by another physical mechanism. We explore here the possibility of their amplification through a response of the linear system to forcing at a certain frequency. Using the mathematical formalism outlined in the end of § 2.2, we consider the norm (2.10) of the resolvent operator (2.9) as the maximum amplification factor for the responses of the linearized controlled flow, and corresponding to it the most amplified flow modes. A necessary modification to the approach in § 2.2 is needed before we compare it to the DNS results. Before, we took the mean profile and the turbulent viscosity of the uncontrolled flow as the base state for the linear analysis. Now, since we consider time-periodic responses with real frequencies
 $\omega _f$, neither growing nor decaying, we need to replace the uncontrolled base state with the parameters of the statistically steady controlled flow. This was achieved by extracting the mean velocity
 $U_c$ and total shear stress profiles from the DNS with control, and replacing
 $\nu _t$ in (A1) with the ratio of the total shear stress and the
 $y$-derivative of
 $U_c$. The turbulent mean profile and viscosity are different for each
 $|A|$ and
 $x_0$. We considered here
 $x_0 =0$ for brevity, although the conclusions of this section hold for the entire interval of
 $0 \leq x_0<0.55$.
The operator (2.9) requires a frequency  $\omega _f$, or phase velocity of the forcing
 $c_f$, as a parameter. Our control method acts by measuring large scales of
 $v$ at
 $y_d/h = 0.1$ and applying them with a corresponding constant factor at the wall. Thus
 $v$ structures at the wall must have the same advection velocity as the structures of
 $v$ at
 $y_d$. The advection velocity of different flow modes varies with their size, but for large structures in the logarithmic layer it can be approximated by the mean velocity at their wall-normal location (Jiménez Reference Jiménez2018). In the following, we adopt
 $c_f = U_c(y_d/h = 0.1)$ as the phase speed of resolvent forcing. This translates into relatively fast advection,
 $c_f/U_b \approx 0.75$–
 $0.78$, when scaled with the bulk velocity. This approach is different from approximating the response velocity field through a sum of the left singular vectors of the operator (2.9) with different phase speeds (Luhar et al. Reference Luhar, Sharma and McKeon2014; Toedtli et al. Reference Toedtli, Luhar and McKeon2019). Rather than observing a cumulative effect of the forcing with all possible phase speeds, we want to capture responses to the specific phase speed of the detection plane.
In figure 14 we compare the wall-normal profile of the most amplified response to the wall-normal distribution of energy in the DNS. The length of the harmonic is set to  $\lambda _x/h = 2$,
 $\lambda _z/h =1$, corresponding to the approximate size of the oblique wave in figure 4(c). The critical layer for each of the modes is located at
 $y_d =0.1$ (
 $y^+_d \approx 100$) for the uncontrolled flow, and is only slightly shifted upwards in wall units when the flow is controlled. In the uncontrolled case, the response modes peak near the critical layer, where the advection velocity of forcing is equal to the advection velocity of the mean profile. In the controlled case, the linear response to the forcing, besides the expected peak at
 $y^+ \approx 100$, has a second peak in
 $E_{uu}$ around
 $y^+ \approx 10$ (figure 14a). Figure 14(b) shows that both the linear response in
 $v$ and the energy of the selected mode in the DNS exhibit a minimum in
 $v$ around
 $y_0^+ = 50$, as already indicated by the minimum in the contribution to the r.m.s. of
 $v$ from the large scales in figure 2(c). There is also a maximum of
 $v$ in the logarithmic layer as in the uncontrolled case.
Responses to forcing of the linearized Navier–Stokes operator for the mode with  $\lambda _x \sim 2h$,
 $\lambda _z \sim h$ and
 $c_f = U(y_d)$: (a) energy of the streamwise velocity component; (b) energy of the wall-normal velocity component; and (c) tangential Reynolds stresses. Dashed line, without control; solid line, with control;
 $\bullet$, the energy of the corresponding mode in the DNS. Results for
 $|A|=1$, in blue;
 $|A| = 0.7$, in red; with
 $x_0 = 0$. The horizontal black dotted line,
 $y^+_d$, is the location of the critical layer for the uncontrolled flow. All energies are normalized with the maximum of
 $E_{uu}$, and
 $y^+$ is normalized with the wall units of each case.

Finally, figure 14(c) shows the contribution to the Reynolds stress by this particular mode. Unlike in the uncontrolled case, where the Reynolds stress has only one pronounced maximum in the logarithmic layer, in the controlled flow interaction of the new peak in  $E_{uu}$ in the buffer layer and non-zero
 $E_{vv}$ at the wall generates a second peak in
 $E_{uv}$. This peak is also located in the buffer layer and its magnitude is comparable to the logarithmic-layer maximum (compare to the two-peak distribution in figure 5d). Responses obtained with our linear amplification model capture the shape of the DNS energies reasonably well for both
 $|A| = 1$ and
 $0.7$, indicating that oblique waves observed in the DNS are indeed the amplified linear responses of the flow subject to the forcing with
 $c_f = U_c(y_d)$. Note that the resolvent analysis will give the same amplification and modal structure for modes with
 $\pm k_z$, due to the symmetry of the linearized Navier–Stokes operator under transformation
 $k_z \to -k_z$, and therefore cannot predict whether the waves will be travelling in the positive or the negative direction of the
 $z$-axis in the DNS. However, maximum resolvent amplification, quantified by the largest singular values, could explain the energy build-up on the scale of oblique waves,
 $\lambda _x/h \approx 2$,
 $\lambda _z/h \approx 1$.
Figure 15 shows contours of the first singular values  $\sigma _0$ of the operator in (2.9), or equivalently its norm (2.10), as a function of
 $k_x$ and
 $k_z$. In the linear analysis, we can employ much larger wavelengths than permitted by our computational domain in DNS. This allows us to capture the general trend in
 $\sigma _0$ for very large structures. Note that neither infinitely long waves,
 $k_x = 0$, nor infinitely wide waves,
 $k_z = 0$, are included in this logarithmically scaled plot. The gradual increase in the response intensity with increase of the length scale indicates that the large scales are more sensitive to the forcing through the nonlinearity, which represents an additional challenge for their control. The contours shift towards smaller
 $k_z$ as
 $k_x$ decreases, meaning that the most amplified response gets wider as it gets longer. At very long wavelengths, of the order of
 $k_x \approx 0.1$ or
 $\lambda _x/h = 2{\rm \pi} /0.1 = O(10^2)$, this trend saturates at
 $k_z \approx 1.5$ (
 $\lambda _z/h \approx 4.2$), which is larger than the width of the computational box in our DNS. The wavenumbers that are observed and controlled in the DNS are highlighted by the dashed rectangle in figure 15. The distribution of
 $\sigma _0$ contours in this area indicates that the amplification maximum should happen on the largest possible flow scale, especially in
 $x$. This prediction is in agreement with the mechanism of transient growth, which predicts larger amplification and longer lifetimes of the perturbations with longer streamwise wavelengths (Del Alamo & Jiménez Reference Del Alamo and Jiménez2006). However, the wavelengths
 $\lambda _x/h \approx 2$,
 $\lambda _z/h \approx 1$, marked by the black cross in figure 15, are smaller than the largest controlled streamwise length scale, in contradiction with the linear prediction.
Maximum amplification of the resolvent response  $\sigma _0$ as a function of streamwise and spanwise wavenumbers. The controlled DNS wave band is
 $k_x h \in [1,6]$,
 $k_z h \in [2, 10]$, which is highlighted by the dashed rectangle. The
 $\times$ marks the length scale of oblique waves from figure 4(c) (
 $\lambda _{x,z}/h \approx 2,1$). Control parameters:
 $c_f = U(y_d)$,
 $x_0 = 0$ and
 $|A| = 1$.

In figure 15, all scales are affected by control, while only a limited range of scales is controlled in the DNS. To compare the resolvent analysis to the DNS, let us take a closer look at these scales. Figure 16(a) gives the values of  $\sigma _0$ for the wavenumbers that are contained in the dashed rectangle in figure 15, augmented with
 $k_x = 0$,
 $k_z \in [2,10]$ and
 $k_z =0$,
 $k_x h\in [1,6]$, which were also controlled. The flow produces a very large linear response at
 $k_x=0$, which is equivalent to a non-periodic in time forcing with
 $k_x c_f =0$. For the rest of the controlled scales, the response energy is gradually increasing with scale, which is highlighted by the logarithmically spaced colour map. Since the resolvent norm (2.10) was weighted by the kinetic energy of the flow, as in Schmid & Henningson (Reference Schmid and Henningson2012), a reasonable quantity to compare with it is the total kinetic energy of the DNS flow. Figure 16(b) presents this quantity,
 $E_{tot} = E_{uu} + E_{vv} + E_{ww}$, integrated over the channel height. The maximum in
 $E_{tot}$ does not capture the location of oblique waves in figure 5, because the energy spectra of
 $u$ and
 $v$ in figure 5 were premultiplied and integrated over
 $\lambda _x$ or
 $\lambda _z$ instead of
 $y$. Although figure 16(b) shows a preference of the flow towards larger scales, the trend is not very clear, and infinitely long or wide wavelengths are less energetic than suggested by figure 15.
(a) Maximum linear response  $\sigma _0$ to forcing at
 $c_f = U (y_d)$ as a function of wavenumbers. The dashed rectangle contains the same wavenumbers as in figure 15. (b) Total kinetic energy of the flow
 $E_{tot}$, integrated over channel height. (c) Energy contribution
 $E_{vv,wall}$ of wall-normal velocity at the wall. (d) Plot of
 $\sqrt {E_{tot}/E_{vv,wall}}$, the ratio of (b) to (c). Here
 $k_{x,z}=0$ was not controlled in the DNS and was removed from the plots for clarity. Energies in (b,c) were normalized with
 $u^2_\tau$. Here
 $x_0 = 0$ for all panels.

Alternatively to the resolvent analysis, we can also view the resulting controlled DNS flow in an input–output framework, as a system forced with the wall-normal velocity from the wall. The amplitude of this forcing is unevenly distributed across the scales, since the r.m.s. of  $v$ at the detection plane increases as the length scale becomes smaller. This way, a particular energy distribution in the flow favouring oblique length scales could stem from the inhomogeneous distribution of control intensity over scales. Figure 16(c) shows the distribution of the wall-normal component of the energy at the wall,
 $E_{vv, wall}$, acting on the flow. It shows a tendency of energy increase towards short scales in
 $x$, and a peak at
 $k_{x,z} h =(3,2)$. We take the energy of
 $v$ at the wall in figure 16(c), and normalize the total energy response
 $E_{tot}$ with it. The square root of this result, estimating the response amplification, is given in figure 16(d), and the tendency of the flow to produce an amplified response at larger scales becomes much more apparent.
Moreover, the DNS responses, normalized this way, also allow for a weighted comparison with our resolvent model. The latter relates  $v_w$ and
 $v(y_d)$ in a way where all wavenumber pairs
 $(k_x,k_z)$ are treated equally, without taking into account that different scales of wall-normal velocity receive different amounts of energy at the wall through control, as in the DNS. Normalizing the total DNS flow response with the wall-normal velocity distribution at the wall allows one to correct for this factor. The distribution of response magnitudes in figure 16(d) is similar to figure 16(a), with a preference of the flow response towards the large scales in both cases. There is an intense peak at
 $k_x = 0$,
 $k_z h= 2$, which can be a signature of the
 $\sigma _0$ maximum in figure 15, but a larger computational domain would be required to prove this point. Overall, figures 16(d) and 16(a) correlate reasonably well and support the hypothesis of the proportionality of flow response to the intensity of
 $v$.
8. Discussion and conclusions
In this work, we performed an analysis of large-scale opposition control targeting structures in the logarithmic layer of the fully turbulent channel flow. The control, applied on the largest Fourier modes of wall-normal velocity in the DNS, creates a virtual-wall effect on these modes, and simultaneously provokes a large response in streamwise velocity in the buffer layer. This effect is accompanied by the appearance of a near-wall peak in Reynolds stresses and therefore a pronounced and undesired increase of friction. Since advancing the detection upstream with respect to actuation was shown to be beneficial for drag reduction in opposition flow control by Lee (Reference Lee2015), we introduced a streamwise shift between sensing and control input as a new parameter. Shifting control in the streamwise direction, as depicted in figure 3(a), divides the flow behaviour into two parameter regions. The first one, of approximately  $x_0/h \in [0, 0.55)$, features a moderate and roughly constant drag increase, approximately 50–100 % more than in the uncontrolled flow. It is accompanied by the appearance of oblique waves. In the second parameter region, of approximately
 $x_0/h \in [-0.35, 0)$, spanwise rollers develop. The drag here increases dramatically, up to four times larger than in the uncontrolled flow. Outside these regions, the turbulence was enhanced to such an extent that the simulations diverged. To explain this behaviour, we explored the linear dynamics of the channel flow with boundary conditions adapted for opposition flow control.
We have shown that in the second parameter region,  $x_0/h \in [-0.35, 0)$, all wavelengths of the channel flow, with or without viscosity, are affected by a linear instability. The instability is manifested as a pair of unstable eigenvalues that migrate along a circular path in the complex plane, as the phase of the complex control coefficient
 $A$ changes. The direction of the eigenvalue motion in the complex plane depends on the control gain
 $|A|$. When
 $|A|$ is small, the control-related eigenvalues move towards the left, and we observe eigenmodes with unusually large negative phase speeds,
 $c_r<0$. As
 $|A|$ increases, the eigenvalues experience a hyperbolic growth, going from
 $-\infty$ to
 $\infty$ when
 $|A| = |A|_f$,
 $\phi = \pm {\rm \pi}$. At
 $|A|_f$, the circle containing the eigenvalue motion flips to the right in the complex plane.
We revisited the analysis of the Rayleigh equation for inviscid channel flow, and derived a semi-analytical expression for  $c_r (|A|, \phi = \pm {\rm \pi})$ explaining this behaviour. In the inviscid case, unstable eigenvalues are encountered for positive phases
 $\phi = (0, {\rm \pi})$ for all
 $|A|$. The presence of viscosity modulates the instability, dampening it for small control gains (figure 9a). The instability behaviour is also different at large
 $|A|$ as the instability eventually weakens; the inviscid flow becomes marginally stable, while the growth rates of the viscous problem saturate at small but positive levels. Physically, the large gains force the eigenvectors to be zero at the detection plane (figure 10b), effectively creating a narrower channel. As the effective wavenumber
 $\kappa$ increases, and the related structures become smaller, the instability region is displaced towards larger values of
 $|A|$, as indicated in figure 9(a). Therefore, long and wide wave modes are more dangerous for control than short and narrow ones, given the same control gain. Considering moderate
 $|A|\leq 1$, as in our DNS, we find that only the largest flow scales remain a concern and may become unstable (figure 11).
These findings are easily applied to the DNS results if the linear relation  $\phi = - k_x x_0$ between the streamwise shift and the phase of the control coefficient is considered. Since the instability region is defined by
 $\phi$ instead of
 $x_0$, and the control coefficient
 $A$ is
 $2{\rm \pi}$-periodic, the instability can be approached in two ways in the DNS. The obvious way is to shift control upstream, applying negative
 $x_0$, until one of the controlled wavenumbers becomes unstable at the ‘critical’ control shift
 $x_{cr}$. In the case of
 $|A|=1$, several controlled wavenumbers become unstable simultaneously, but
 $k_x h = 6$ has the largest growth rate among them, and therefore defines the flow evolution near the onset. We relate its growth rate to the steep increase in friction at
 $x_0/h \in [-0.35, 0)$ in figure 12(c). As
 $x_0$ decreases further,
 $k_x h = 6$ becomes stable again, but the instability is overtaken by lower
 $k_x$, so the friction remains high.
On the other hand, it is also possible to approach the instability by shifting control downstream, i.e. beyond  $x_0/h>0.55$ (figure 12a,b), where the phase for
 $k_x h = 6$ changes from
 $-{\rm \pi}$ to
 ${\rm \pi}$. Periodicity of
 $A$ also implies that the regions of stability and instability are repeated periodically as the control is moved further upstream or downstream. As the result of the linear instability, the altered steady-state flow takes the form of spanwise rollers while remaining turbulent (figure 4b). The flow gradually approaches this high-drag state at negative streamwise shifts, indicating a supercritical transition in figure 13(a). The positive streamwise shift
 $x_0/h \approx 0.55$ features abrupt transition to the high-drag state, accompanied by two modulating frequencies as
 $|A|$ increases, and occurs at smaller
 $|A|$ than predicted by the linear analysis. This suggests the presence of a subcritical bifurcation in figure 13(b), although more data are needed to confirm this. Our results are in agreement with the recent work of Toedtli et al. (Reference Toedtli, Yu and McKeon2020), who link the deterioration of the ‘classic’ opposition control with the detection plane in the buffer layer,
 $y_d^+ = 15$, to the formation of spanwise rollers. Toedtli et al. (Reference Toedtli, Yu and McKeon2020) find unstable eigenmodes of the linearized Navier–Stokes equations for control phases
 $\phi \in [{\rm \pi} /4, 3 {\rm \pi}/4]$, and they are probably of the same physical origin as those reported here.
The uniform structure of the high-friction flow state in the form of spanwise rollers in figure 4(b) resembles an instability of Kelvin–Helmholtz type. Such instabilities have a profound effect on wall-bounded flows that allow wall transpiration, for example, channels with porous walls or riblets (Jiménez et al. Reference Jiménez, Uhlmann, Pinelli and Kawahara2001; García-Mayoral & Jiménez Reference García-Mayoral and Jiménez2011). As in the case of Kelvin–Helmholtz instability, the advection of vorticity with  $\hat {v}$ in (4.1) (
 $U^{\prime \prime } \hat {v}$) is the necessary ingredient for the instability observed here, and if it is removed from equations, the positive growth rates are no longer observed. However, the control instability has two important differences. First, a Kelvin–Helmholtz instability requires two interacting eigenvalues to form a complex conjugate pair, as illustrated by a simple example of the piecewise-linear mixing layer (Schmid & Henningson Reference Schmid and Henningson2012, pp. 26–29). In our case, each of the two control eigenvalues is associated with control at one of the channel walls. The control eigenvalues do not interact, and only one of them appears if the control is applied only to one wall. Second, when the eigenvalues go through a hyperbolic infinity in (4.13), they become essentially independent from the only velocity scale of the flow,
 $U_b$. The simplest interpretation is that the instability observed here is the instability of the control, in the sense of an unstable feedback loop. This is supported by the observation that the growth rates become larger as
 $\phi \to {\rm \pi}$, which represents reinforcement instead of opposition, since the control at the wall is in phase with the detection plane.
In the region of  $x_0/h \in [0, 0.55)$, the linear instability is inactive, but the friction is still increased, and oblique waves with a large contribution to the Reynolds stress near the wall appear (figure 4c). We used a linear resolvent model to explore the possibility of these waves arising from amplified responses of the linearized Navier–Stokes operator to forcing. Our model captures correctly the shape of oblique waves in the DNS on the length scales
 $\lambda _x$,
 $\lambda _z=2h,h$, if the advection speed of the forcing is set the same as the advection speed of structures at the detection plane
 $y_d /h = 0.1$, supporting the suggestion above.
On the other hand, resolvent analysis does not predict the largest responses on the scale of oblique waves (figure 15). We rescaled the total kinetic energy of the flow by the energy of the wall-normal velocity at the wall to obtain a weighted magnitude of the flow response at each flow scale. Normalized this way, the magnitude of response increases with the length scale, and the maximum response is obtained at the largest possible scales, in line with the linear prediction of the response norm in figure 15. Therefore, the visually apparent build-up of energy at this particular scale is an artefact of the distribution of the r.m.s. of  $v$ at the detection plane. In our work, the focus was on phase velocities of
 $c_f /U_b \approx 0.75$–
 $0.78$, or
 $c^+ \in [11,13]$ in wall units, corresponding to ‘detached’ resolvent modes. Luhar et al. (Reference Luhar, Sharma and McKeon2014) showed that the ‘detached’ modes with
 $12< c^+<16$ will be amplified but create significant blowing and suction at the wall, i.e. are in principle controllable. A comprehensive analysis of the principal forcing frequencies in the controlled DNS, together with a more involved resolvent model with varying
 $c_f$, treating controlled and uncontrolled length scales separately, could clarify further questions.
Unfortunately, reducing the control gain and therefore inhibiting the possible instabilities does not reduce drag, as shown by the DNS results in figure 3(b). A successful control strategy therefore should optimize both control gain and control phase, as suggested by Luhar et al. (Reference Luhar, Sharma and McKeon2014) and Toedtli et al. (Reference Toedtli, Luhar and McKeon2019). It should also take into account the contribution to friction from all flow length scales, because nonlinearity transfers energy from the large scales affected by control to the uncontrolled small scales. In the current set-up, at least two routes for optimization are possible: first, minimizing the total stress of each resolvent response, and second, reducing the maximum of  $u$ near the wall. Our preliminary results (not shown here) indicate that the first strategy results in a relatively smaller drag increase in comparison to the second one. Nevertheless, we leave this optimization for a future work, which should ideally be tailored to approximate an experimental flow. In a real experimental set-up, the opposition control is implemented via local blowing and suction (Abbassi et al. Reference Abbassi, Baars, Hutchins and Marusic2017). This requires an adaptation of wave-opposition control, which is global and occupies the whole spatial domain, to spatially local opposition, and, as a result, a different type of optimization problem (Pastor et al. Reference Pastor, Vela-Martin and Flores2020).
We note here that the most straightforward way of relaxing turbulence is to reduce the non-normality of the linearized Navier–Stokes operator at the wall. The non-normality is responsible for the near-wall cycle, generating streaks of  $u$ from quasi-streamwise vortices. It is known that, if the non-normal coupling between
 $\omega _y$ and
 $v$ in the operator is removed or weakened, the turbulence decays (Jiménez & Pinelli Reference Jiménez and Pinelli1999). Kim & Lim (Reference Kim and Lim2000) compared the results of this weakening to classic opposition control of Choi et al. (Reference Choi, Moin and Kim1994) and suggested that it acts on the flow in a similar manner. In the large-scale opposition control implemented here, the forcing is too large to interfere with quasi-streamwise vortices of the near-wall cycle, and therefore this physical mechanism of drag reduction is inactive. Our results suggest executing caution in applying large-scale control, especially with a lagging delay between sensors and actuators, equivalent to shifting control upstream. Nevertheless, the increase of near-wall activity in the form of oblique structures of streamwise and wall-normal velocities and resulting momentum transport opens the possibility of using this form of control when enhancing turbulence is beneficial, such as in mixing or in separation control.
Funding
This work was supported by the European Research Council under the Coturb grant ERC-2014.AdG-669505.
Declaration of interests
The authors report no conflict of interest.
Appendix A. The role of turbulent viscosity
In turbulent flows, momentum transport induced by Reynolds stresses modifies the velocity profile to adopt a flatter shape, compared to a laminar one. There have been attempts to explain the specific shape of the turbulent mean profile using the principle of maximum dissipation rate and the assumption of neutral stability of the mean profile (Malkus Reference Malkus1956). Nevertheless, later linear stability analysis of experimentally observed mean profiles in channels showed that these profiles are far from being neutrally stable and their perturbations decay (Reynolds & Tiederman Reference Reynolds and Tiederman1967), if the turbulent viscosity is taken into account. Reynolds & Hussain (Reference Reynolds and Hussain1972) demonstrated that including turbulent viscosity gives a much better prediction of experimental results.
In this work, we also incorporate it into the linear stability analysis. The idea behind it is that, on a single wave harmonic, the background turbulence acts directly (through Reynolds stresses) and indirectly (through the turbulent mean profile). Turbulent viscosity, introduced into the viscous term, is merely a closure for the mean Reynolds stresses arising in the perturbation equations, and represents the interaction between the wave harmonic and background turbulence. In simple closures, it acts on the wave as an additional damping. Note that, in the resolvent analysis of McKeon & Sharma (Reference McKeon and Sharma2010) and many further works, turbulent viscosity is not included in the linear model since nonlinear terms are treated as unknown forcing to the linear part of the Navier–Stokes equations. Morra et al. (Reference Morra, Semeraro, Henningson and Cossu2019) show, however, that the resolvent model based on turbulent viscosity performs much better at predicting the velocity spectrum. This suggests that, in the absence of additional information about the forcing shape or amplitude, it is justified to incorporate the turbulent viscosity in the linear model to get more precise results.
Below we give the Cess analytic approximation for turbulent viscosity,
 \begin{equation} \nu_t = \frac{\nu}{2} \left\{ 1 + \frac{K^2 Re_\tau}{9} [2 \eta -\eta^2] [3-4 \eta + \eta^2]^2 \left[1 - \exp\left( \frac{- \eta Re_\tau}{A}\right)\right]^2 \right\}^{0.5} + \frac{1}{2}, \end{equation}
where  $\nu$ is the kinematic viscosity,
 $\eta = y/h$, and
 $A = 25.4$ and
 $K = 0.426$ are parameters. The turbulent viscosity is later incorporated into (2.6a–c), where the Orr–Sommerfeld (
 $L_{OS}$), Squire (
 $L_{SQ}$) and wall-normal derivative (
 $\mathrm {D}$) operators are given by:
 \begin{equation} \left. \begin{aligned} L_{OS} & = \mathrm{i} k_x U (\kappa^2 - \mathrm{D}^2) + \mathrm{i} k_x U^{\prime\prime} + \nu_t (\kappa^2 - \mathrm{D}^2)^2 + 2 \nu_t^{\prime} (\mathrm{D}^3 - \kappa \mathrm{D}) + \nu_t^{\prime\prime} (\mathrm{D}^2 + \kappa^2),\\ L_{SQ} & = \mathrm{i} k_x U + \nu_t (\kappa^2 - \mathrm{D}^2) +\nu_t^{\prime} \mathrm{D} \\ \mathrm{D} & = \frac{\partial}{\partial y}. \end{aligned} \right\} \end{equation}
Here primes denote derivatives of  $U$ and
 $\nu _t$ with respect to
 $y$, and
 $\kappa ^2 = k_x^2 + k_z^2$. The mean profile
 $U$ can be reconstructed using turbulent viscosity, as well as obtained empirically from the DNS.
Appendix B. Boundary conditions for the linearized problem
Imposing boundary conditions for the eigenvalue problem (2.8) is equivalent to implementing additional algebraic constraints on the system. Consider a generalized eigenvalue problem  $\omega \boldsymbol{\mathsf{M}} v = \boldsymbol{\mathsf{L}} v$. Suppose
 $v \in \mathbb {C}^n$, where
 $n$ corresponds to the spatial discretization of the domain in
 $y$-direction, and assume finite-difference discretization for simplicity. The most general boundary conditions for the Orr–Sommerfeld problem are the clamped boundary conditions:
 \begin{equation} v_{0,n} = 0, \quad \left( \partial v /\partial y \right)_{0,n} = 0. \end{equation}
Recalling that the left-hand side of the problem  $\omega \boldsymbol{\mathsf{M}} v$ is related to the time derivative
 $\partial v/\partial t$, a way to implement conditions (B1) is to set the first and the last row of
 $\boldsymbol{\mathsf{M}}$ to zero. This operation, however, reduces the rank of matrix
 $\boldsymbol{\mathsf{M}}$ and makes the problem ill-conditioned. Moreover, it produces two infinite eigenvalues corresponding to conditions (B1), since physically these conditions mean that the perturbation on the boundary propagate infinitely fast.
To avoid numerical issues, by manual filtering of the infinite (not spurious) eigenvalues, or developing manual matrix-reduction algorithms, Goussis & Pearlstein (Reference Goussis and Pearlstein1989) and Schmid & Henningson (Reference Schmid and Henningson2012) offer a mapping of the infinite eigenvalues to an arbitrary point in the eigenvalue space. Instead of setting the corresponding rows of  $\boldsymbol{\mathsf{M}}$ to zero, the respective rows of the problem are set to satisfy an equation for
 $v_{0,n}$ with exponentially decaying solutions:
 \begin{equation} \omega {\mathsf{M}}_{0,\ldots} v_0 ={-} |C| \mathrm{i} v_0. \end{equation}
The constant  $|C|$ is set large enough to map infinite eigenvalues related to boundary conditions into the stable part of the complex plane, way below the line
 $\omega _i = 0$. For the controlled problem, condition (B2) reads as
 $\omega {\mathsf{M}}_{0,\ldots} (v_0 - v_d) = - |C| \mathrm {i} (v_0-v_d)$, which sets the difference between the perturbation at the wall and the detection plane to decay exponentially. The resulting eigenvectors satisfy the control law (2.2).
Appendix C. Numerical resolution test for § 5.2
It is important to make sure that the numerical resolution of the linear stability analysis is sufficient for the large control gains in § 5.2, and that the saturation of eigenvalues is not a spurious effect. We performed resolution tests on various wavenumbers, increasing the number of Chebyshev polynomials  $N$ used to discretize the matrices
 $\boldsymbol{\mathsf{M}}$ and
 $\boldsymbol{\mathsf{L}}$ in (2.7). The tests in figure 17 show consistency in eigenvalue positions above
 $c_i =0$ of the unstable wavenumbers for both small and large
 $k_x$ with increasing
 $N$. Since a small variation is nevertheless observed, we increased the numerical resolution in § 5.2 to
 $N=512$.
Numerical resolution test for the linear stability problem with viscosity. (a) Eigenvalue spectrum for  $k_x = 2$,
 $k_z = 0$: blue,
 $|A| = 60$,
 $\phi = -3 {\rm \pi}/4$; red,
 $|A| = 10$,
 $\phi = 3 {\rm \pi}/4$. (b) Eigenvalue spectrum for
 $k_x = 20$,
 $k_z = 0$ and
 $|A| = 100$: blue,
 $\phi = -3 {\rm \pi}/4$; red,
 $\phi = 3 {\rm \pi}/4$. The number of Chebyshev polynomials is
 $N \in [256, 512, 800, 1024]$, indicated by decreasing symbol size and colour intensity.


 Open access

