1 Introduction
The classical Kelvin–Helmholtz instability (KHI), discovered independently by Lord Kelvin and von Helmholtz, has been shown to play a major role in a large variety of physical systems, often much more complex when compared to the original hydrodynamic (HD) one. In the context of astrophysical plasmas, the KHI has been investigated in the solar corona (Lapenta & Knoll Reference Lapenta and Knoll2003; Bettarini et al. Reference Bettarini2006), accretion disks (Li & Narayan Reference Li and Narayan2004; Lovelace et al. Reference Lovelace2010) and relativistic jets associated with active galactic nuclei and gamma-ray bursts (Alves et al. Reference Alves2012; Hamlin & Newman Reference Hamlin and Newman2013). KH billows have been observed during coronal mass ejections in the Sun’s atmosphere (Foullon et al. Reference Foullon2011) and detected by in situ spacecraft at the magnetosphere of the Earth (Fairfield et al. Reference Fairfield2000; Hasegawa et al. Reference Hasegawa2004; Foullon et al. Reference Foullon2008), and of several solar system planets (see Johnson et al. (Reference Johnson2014) and references therein) and their moons (Kivelson Reference Kivelson1998). In laboratory plasmas, KH activity has been measured and characterized in linear magnetized columns (Perez et al. Reference Perez2006; DuBois et al. Reference Dubois2014) and its role has been theoretically investigated in order to explain strong asymmetries of turbulent fluctuations in toroidal configurations (Scott et al. Reference Scott1988; Garbet et al. Reference Garbet1999). Even more exotic is to observe this fluid instability during the interaction between solid matter and laser pulses, creating at the same time the plasma medium and the conditions suitable for the instability to develop (Harding et al. Reference Harding2009; Hurricane et al. Reference Hurricane2009, Reference Hurricane2012; Raman et al. Reference Raman2012).
It could be surprising to find an HD instability acting in a dilute space plasma, a collisionless medium that should be described adopting a pure kinetic approach by solving the Vlasov equation. Nevertheless, in the presence of a background magnetic field and looking at motions at ‘large scales’ (when compared to the characteristic kinetic scales, such as the ion skin depth
 $d_{i}$
and the ion Larmor radius
 $\unicode[STIX]{x1D70C}_{i}$
), the ions and the electrons drift at nearly the same velocity (the so-called
 $\boldsymbol{E}\times \boldsymbol{B}$
velocity), perpendicular to the local magnetic field. In this condition, the plasma exhibits a single fluid, magnetohydrodynamic (MHD) behaviour. This is the case of the KHI at the Earth’s magnetosphere, at least during its early evolution, when the observed wavelength is tens of times greater than the kinetic scales (Fairfield et al.
Reference Fairfield2000; Hasegawa et al.
Reference Hasegawa2004; Foullon et al.
Reference Foullon2008).
The first suggestion that the Earth’s magnetopause, the frontier between the flowing solar wind and stagnant magnetospheric plasma, could be a ‘good’ location for the development of the KHI, was outlined by Dungey (Reference Dungey1955) when the idea of a magnetosphere around the Earth was introduced using a ‘closed’ model. In this context, Axford & Hines (Reference Axford and Hines1961) proposed that the KHI instability could mediate the interaction between the two different media, thus providing an effective viscosity that could explain the momentum transfer between them and the consequent convection of the magnetospheric plasma observed by satellites. This model was historically abandoned in favour of the ‘open magnetosphere model’ (Dungey Reference Dungey1961), certainly more suitable for explaining the magnetospheric dynamics during periods when the interplanetary magnetic field (IMF), advected by the solar wind, is directed southward, thus providing the conditions for magnetic reconnection to occur at the dayside magnetosphere (Furth Reference Furth1963; Coppi Reference Coppi1964; Wesson Reference Wesson1990). On the other hand the so-called low-latitude boundary layer (LLBL) (Eastman et al. Reference Eastman1976), a transition region with mixed plasma properties in between the solar wind and the magnetospheric ones, is also observed during northward periods (Mitchell et al. Reference Mitchell1987), when the IMF is nearly parallel to the Earth’s dipole and thus when reconnection at low latitude should be ineffective. Furthermore, the observed entry of solar wind particles into the magnetosphere can be even more important during these periods, generating a plasma sheet (the low-latitude region of the near tail) colder and denser that its nominal values (Terasawa et al. Reference Terasawa1997).
Understanding the origin of this transport is quite puzzling: collisional cross-field diffusion is totally negligible and collisionless diffusion processes, associated with wave activity measured by satellites at the magnetopause, appear to be too weak to provide a reasonable explanation for the mixing (Labelle & Treumann Reference Labelle and Treumann1988; Le et al.
Reference Le1994). On the other hand, during northward periods, large-scale KH vortices sufficiently far away from the stagnant sub-solar point, can easily form along the low-latitude magnetopause, where the velocity shear drives the instability and where the magnetic tension is too weak to preclude them from growing and rolling up since the KH wave vector
 $\boldsymbol{k}$
is approximately aligned with the flow and thus nearly perpendicular to the local magnetic field (Hasegawa et al.
Reference Hasegawa2004). From an HD point of view, these vortices would provide the required anomalous diffusivity and create the LLBL, but in a magnetized plasma the dynamics is more complex. Indeed, although large-scale KH vortices are able to transfer momentum and energy between the two different regions (Miura Reference Miura1982, Reference Miura1992), in an ideal MHD evolution the particle motion is linked to the magnetic field dynamics. Vortices can thus fold and roll up the unperturbed magnetopause, but without permitting particles to cross the ‘magnetic frontier’ and thus not allowing for a mass transfer between the solar wind and the magnetosphere. Nevertheless, during its nonlinear evolution, the large-scale KHI instability is able to create, in a self-consistent way, local regions where the spatial scales are comparable to or smaller than the kinetic scales. As a result, the MHD constraints can be violated and finally particles can cross the frontier.
For these reasons, during the last twenty years, researchers have focused their theoretical and numerical efforts on the nonlinear dynamics of these vortices. They have shown different possible mechanisms that go beyond the MHD evolution and finally can explain the observed transport. Without any doubt, the most investigated one is magnetic reconnection occurring at magnetopause current layers pinched by the structures created by the growing KHI or in current layers created by the vortex dynamics itself. It is worth to underline that reconnection, despite being a very localized process, has the unique capability of changing the global magnetic topology thus allowing the solar wind and magnetospheric plasmas, previously ‘not connected’, to mix. Depending on the shear between the advected IMF and the magnetospheric magnetic field, reconnection can occur because of the convergent flow generated by the KH instability around the hyperbolic point even during its exponential growth before entering in the full nonlinear regime (Liu & Hu Reference Liu and Hu1988; Chen et al. Reference Chen1997) or can occur only during the nonlinear regime (Frank et al. Reference Frank1996; Min & Lee Reference Min and Lee1996; Jones et al. Reference Jones1997; Baty et al. Reference Baty2003). The former case was named Type I vortex induced reconnection (VIR) by Nakamura & Fujimoto (Reference Nakamura and Fujimoto2008) and creates field lines that directly connect the solar wind and the magnetospheric regions (Knoll & Chacón Reference Knoll and Chacón2002; Nakamura & Fujimoto Reference Nakamura and Fujimoto2006; Nakamura et al. Reference Nakamura2006). As a result, particles can stream along the reconnected lines, causing the vortex region to become homogeneous and forming an extended mixing layer (Nakamura et al. Reference Nakamura2011; Nakamura & Daugthon Reference Nakamura and Daughton2014). On the contrary, during the latter case, named Type II VIR (Nakamura & Fujimoto Reference Nakamura and Fujimoto2008), reconnection creates large-scale blobs of solar wind plasma that are injected into the magnetosphere (Otto & Fairfield Reference Otto and Fairfield2000; Nykyri & Otto Reference Nykyri and Otto2001; Nakamura & Fujimoto Reference Nakamura and Fujimoto2005; Faganello et al. Reference Faganello2008c ), without really mixing the two different plasmas. In both cases the actual topology of the magnetospheric system is not taken into account and, in particular, two main ingredients are missed, which are essential in order to investigate the system dynamics. First of all, the variations of the plasma conditions along field lines allow for the KHI to develop efficiently at low latitude while tend to stabilize it more and more at high latitude (Taylor et al. Reference Taylor2008). Furthermore, although one can imagine that, once the instability conditions are locally fulfilled, the low-latitude quasi-two-dimensional KHI will rule the evolution, this is not true when the connection length between stable and unstable regions is not too large as compared with the KH wavelength (Brackbill & Knoll Reference Brackbill and Knoll2001; Hashimoto & Fujimoto Reference Hashimoto and Fujimoto2006; Takagi et al. Reference Takagi2006). The second ingredient is the fact that the field lines are connected, far away from the unstable region, to the flowing solar wind on one side and to the Earth at rest on the other side, thus strongly altering the dynamics. This ‘line-tying’ effect (Sun et al. Reference Sun2008; Lovelace et al. Reference Lovelace2010), combined with the KHI dynamics around the equatorial region, acts as a momentum driver region and creates current layers in the off-equatorial region and finally induces reconnection to occur there (Faganello et al. Reference Faganello2012b ). The fact that those current layers and reconnection are ‘localized’ in latitude suggests that the reconnected field could exhibit a more complex structures compared to a quasi-two-dimensional (2-D) magnetic islands (or magnetic flux ropes), that are obtained in models neglecting line tying. Finally, if the final goal of these nonlinear studies is to evaluate the mass flux toward the magnetosphere (i.e. the quantity of solar wind particles entering the region of ‘closed’ field lines connected to the Earth at both poles), the line connectivity at high latitudes must be definitively included in the model. In this context, it has been shown (Faganello et al. Reference Faganello2012b ) that magnetic reconnection can occur almost simultaneously in both hemispheres, at mid-latitude, thus creating magnetic lines that are topologically part of the magnetosphere, but that are embedded in the solar wind at low latitude, i.e. a new type of ‘closed’ flux tubes, partially populated by solar wind particles. Numerical simulations suggests that the mass transfer associated with this process can account for the observed transport at the magnetospheric flanks.
Actually the nonlinear dynamics of KHI is far richer and magnetic reconnection is only one of the phenomena triggered by the development of the KHI. Indeed the perturbed magnetopause, folded by the dynamics of the KH vortex structures, can become unstable against a variety of secondary HD, MHD or two-fluid instabilities. All these ‘secondary’ instabilities, such as Rayleigh–Taylor instability (Matsumoto & Hoshino Reference Matsumoto and Hoshino2004; Faganello et al.
Reference Faganello2008a
; Tenerani et al.
Reference Tenerani2011), KHI (Smyth Reference Smyth2003; Matsumoto & Hoshino Reference Matsumoto and Hoshino2004), magnetorotational instability (Matsumoto & Seki Reference Matsumoto and Seki2007) and current sheet kink instability (Nakamura et al.
Reference Nakamura2004), can become effective during the nonlinear phase of the primary KHI. Indeed the energy source that feeds these secondary instabilities is provided by the flow and by the spatial non-uniformities generated by the vortical motion of the primary KH billows. The main effect of these instabilities is to transfer energy and momentum toward smaller and smaller scales, leading to the disruption of the vortices and to the development of a turbulent layer (Matsumoto & Hoshino Reference Matsumoto and Hoshino2004; Faganello et al.
Reference Faganello2008a
; Wan et al.
Reference Wan2012; Karimabadi et al.
Reference Karimabadi2013; Rossi et al.
Reference Rossi2015). As noted before, the generation of spatial scales comparable to the kinetic one can finally allow for an important collisionless diffusion and thus to the development of an extended mixing layer, as confirmed by kinetic simulations (Matsumoto & Hoshino Reference Matsumoto and Hoshino2006; Cowee et al.
Reference Cowee2009; Nakamura & Daugthon Reference Nakamura and Daughton2014). From a theoretical point of view, the nonlinear evolution described above represents a textbook example of the complex dynamics of collisionless magnetized plasmas where small-scale dynamics can affect the global, large-scale fluid-like evolution, via a non-trivial ‘multi-scale instability cascade’ (Cho et al.
Reference Cho2008; Moser & Bellan Reference Moser and Bellan2012). This cascade can be local in space, as for the case of secondary instabilities acting at the same place as the KH vortices, or non-local in space thanks to the capability of magnetic fields to channel away momentum and energy (Wedemeyer-Böhm et al.
Reference Wedemeyer-Böhm2012), as for the case of reconnection acting in current layers created far away from the equatorial plane. It can also be local or non-local in the
 $\boldsymbol{k}$
-space, leading to a more classical turbulent picture or to a system where secondary instabilities occur at spatial scales far smaller than the primary one.
In summary, well-developed KH vortices have been proposed as good candidates at the origin of plasma transport at the flanks of the magnetosphere. From an experimental point of view, it is not easy to demonstrate the existence of such structures and to have a sufficiently large set of magnetopause crossings in order to determine their occurrence rate. Indeed a single satellite, acting as a local plasma probe that surveys the moving structures, can hardly distinguish between rolled-up patterns and simpler irregular ‘linear’ waves. Furthermore, the spacecraft spends only a small fraction, if any, of its orbit time at the magnetospheric flanks, where vortices are supposed to form. Nevertheless, the four satellites of the Cluster mission, moving on near orbits closer than one KH wavelength, have provided unambiguous signatures of rolled-up vortices (Hasegawa et al. Reference Hasegawa2004). A few years after, the development of single-spacecraft techniques for the detection of rolled-up vortices (Takagi et al. Reference Takagi2006) and their validation using multi-spacecraft data (Hasegawa et al. Reference Hasegawa2006), allowed us to exploit also single-satellite crossings of the magnetopause thus giving access to a far larger number of events as compared to the Cluster ones. As a result, Hasegawa et al. (Reference Hasegawa2006) took advantage of nine years of observations made by Geotail and concluded that ‘rolled-up’ events are not at all rare, setting at approximately 11 % the lower limit of their occurrence during northward periods. Using a similar approach and THEMIS data, Kavosi & Raeder (Reference Kavosi and Raeder2015) not only found an occurrence rate approximately or even greater than 30 % for northward periods, but also an important KH activity when the IMF is southward or lies in the equatorial plane, thus confirming that KHI is one of the main actors in the interaction between the solar wind and the Earth’s magnetosphere.
In this context, two other important actors are at play, which must not be considered as alternative to the KHI while being able to cooperate altogether. The first one, known as double lobe reconnection (DLR) (Gosling et al. Reference Gosling1991; Song & Russel Reference Song and Russel1992; Le et al. Reference Le1994), consists of two different high-latitude reconnection processes that occur along the same IMF line, draped around the nose of the magnetosphere. In this way a new ‘closed’ flux tube, populated by solar wind plasma, is added to the external part of the dayside magnetosphere. This mechanism can explain the formation of the LLBL at dayside (Fujimoto et al. Reference Fujimoto1998; Onsager Reference Onsager2001; Lavraud Reference Lavraud2005, Reference Lavraud2006; McFadden et al. Reference McFadden2008; Fuselier et al. Reference Fuselier2014), where the KHI is ineffective. However, this mechanism cannot account for more than 50 % of the total mass entry (Wing et al. Reference Wing2006; Taylor et al. Reference Taylor2008; Hasegawa et al. Reference Hasegawa2009). At the same time DLR can favour KHI via the densification of the inner, stagnant part of the dayside LLBL. In this way, the KHI can grow more vigorously along the flanks since the growth rate increases when the density difference between the flowing solar wind and the stagnant magnetosphere plasma decreases. A combination of DLR and KHI has thus been proposed for accounting of the total mass flux (Taylor et al. Reference Taylor2008). The second proposed mechanism concerns the presence of kinetic Alfvén waves (KAWs), observed in situ at the magnetopause (Johnson et al. Reference Johnson2001a ; Chaston et al. Reference Chaston2007, Reference Chaston2013), and that can explain the particle transport across the frontier via a stochasticization of their orbits (Johnson & Chen Reference Johnson and Chen2001b ). KAWs can be excited either by magnetosonic fluctuations (Johnson et al. Reference Johnson2001a ), always present in the magnetosheath (the solar wind region inside the bow shock, close to the Earth) or by the KHI itself (Chaston et al. Reference Chaston2007). The interplay between these three mechanisms can finally generate the LLBL along the whole magnetopause and the observed densification of the plasma sheet.
Looking at finer structures inside the vortices, in particular at those related to the magnetic field, ion fluid velocity or particle fluxes, it is possible to find observational signatures of magnetic reconnection. Unfortunately where and how reconnection occurs has not been clarified and is still controversial. In fact in situ observations of ‘local’ reconnection, occurring at the same location as vortices, have been found, adopting 2-D reconstruction techniques (Nikutowski et al. Reference Nikutowski2002; Eriksson et al. Reference Eriksson2009; Hasegawa et al. Reference Hasegawa2009) but, at the same time, the same authors stressed the three-dimensional character of these observed structures. Furthermore, analysing different rolled-up events, Hasegawa et al. (Reference Hasegawa2004) and Bavassano Cattaneo et al. (Reference Bavassano Cattaneo2010) excluded for these events that reconnection has occurred locally, showing that the observed profiles of plasma quantities are not compatible with reconnection occurring at the same place where vortices are. On the contrary, Bavassano Cattaneo et al. (Reference Bavassano Cattaneo2010) and Faganello et al. (Reference Faganello2014) showed that particle fluxes are compatible with ‘ongoing’ remote reconnection, acting far away from the vortex location either at high latitude or at mid-latitude.
A possible way to discern where reconnection mainly occurs and to look at a possible dominant mechanism between KHI, DLR or KAWs, is to investigate the Dawn/Dusk asymmetry of the magnetosphere. Indeed the LLBL, the inner magnetosphere and the plasma sheet have different plasma properties at the Dawn and at the Dusk flanks, meaning perhaps that the mechanisms that rule the solar wind entry could be different. Furthermore the local plasma conditions in the magnetosheath are different at the two sides and thus the development of KHI, DLR and KAWs can, in principle, be different. Looking at simultaneous observations at different locations or to a large data set, and comparing the expected asymmetries produced by the different mechanisms and the observed ones Wing et al. (Reference Wing2005), Johnson & Wing (Reference Johnson and Wing2009) and Dimmock et al. (Reference Dimmock2015) have tried to determine the relative weight of each process, but their final conclusions are not always in agreement.
This review is organized as follow: in § 2 we resume the linear theory of magnetized KHI and its applications to the study of the stability of the Earth’s magnetopause. In §§ 3 and 4 we present the nonlinear evolution of KHI, as investigated in fluid and kinetic numerical simulations, in particular during northward IMF periods. Section 5 focusses on the impact of the high-latitude stabilization on the KH dynamics. In § 6 we briefly discuss the nonlinear simulations regarding southward IMF periods and finally we conclude in § 7.
2 Linear theory
Here we summarize the results of the linear analysis of the magnetized KHI obtained in a slab configuration and thus corresponding to a local stability analysis of the magnetospheric system. We define here the coordinates of the slab configuration and the properties of the equilibrium fields. In the following we will always refer to this coordinate system, except if specifically cited, as for example for the geocentric solar magnetospheric one (GSM). We consider a unidimensional equilibrium configuration, whose fields change their values along the
 $x$
-direction only. On the contrary
 $y$
and
 $z$
are ignorable coordinates and are defined along the flow direction and the third direction, which in general represents the latitude coordinate. In the MHD framework, the equilibrium quantities are defined as follow
 $$\begin{eqnarray}\displaystyle n_{\text{eq}}=n_{\text{eq}}(x);\quad \boldsymbol{U}_{\text{eq}}=U_{\text{eq}}(x)\,\hat{\boldsymbol{y}};\quad P_{\text{eq}}=P_{\text{eq}}(x);\quad \boldsymbol{B}_{\text{eq}}=B_{\text{eq},y}(x)\,\hat{\boldsymbol{y}}+B_{\text{eq},z}(x)\,\hat{\boldsymbol{z}}, & & \displaystyle \nonumber\\ \displaystyle & & \displaystyle\end{eqnarray}$$
where
 $n_{\text{eq}},\boldsymbol{U}_{\text{eq}},P_{\text{eq}}$
and
 $\boldsymbol{B}_{\text{eq}}$
are the equilibrium number density, velocity, thermal pressure and magnetic field respectively. Since the velocity and magnetic field are perpendicular to the inhomogeneity direction
 $\hat{\boldsymbol{x}}$
, the condition required for time independence is a constant total pressure profile, that reads
 $$\begin{eqnarray}P_{\text{eq}}(x)+\frac{|\boldsymbol{B}_{\text{eq}}(x)|^{2}}{8\unicode[STIX]{x03C0}}=\text{const}.\end{eqnarray}$$
At the magnetospheric flanks the inhomogeneity in the
 $x$
-direction corresponds to the normal direction of the unperturbed magnetopause and
 $\hat{\boldsymbol{y}}$
to the magnetosheath flow direction. The third coordinate
 $z$
is equivalent, at the equators, to
 $Z_{\text{GSM}}$
, defined as the direction perpendicular to the equatorial plane, i.e. parallel to the dipole magnetic field at low latitude. Thanks to the translational symmetry of this description, it is convenient to perform a Fourier analysis with respect to
 $y,~z$
and
 $t$
. The normal modes of the system are given by
 $$\begin{eqnarray}f(x,y,z,t)=\tilde{f}_{k_{y},k_{z},\unicode[STIX]{x1D714}}(x)\,\text{e}^{\text{i}k_{y}y+\text{i}k_{z}z-\text{i}\unicode[STIX]{x1D714}t}+\text{c.c.}\end{eqnarray}$$
It is worth noticing that, once boundary conditions are imposed, the set of equations describing the HD or MHD evolution reduces to a singular Sturm–Liouville problem, where the complex frequency
 $\unicode[STIX]{x1D714}$
represents the unknown eigenvalue. This means that, for any fixed
 $k_{y}$
and
 $k_{z}$
, the existence and the completeness of the set of eigenfunctions
 $\{\tilde{f}_{k_{y},k_{z},\unicode[STIX]{x1D714}},\unicode[STIX]{x1D714}\in \mathbb{C}\}$
is not guaranteed. This finite set can be completed, in order to describe the temporal evolution of any initial perturbation, by considering the continuous spectrum of singular normal modes. It is possible to show (Case Reference Case1960) that the continuum contribution is algebraically damped, meaning that, in the unstable case, we can focus our attention on the non-singular modes only, in particular to those with the larger imaginary part of their eigenvalues. Thus a single value of
 $\unicode[STIX]{x1D714}=\unicode[STIX]{x1D714}(k_{y},k_{z})$
can be used for describing the linear KHI.
2.1 Linear MHD theory
The linear analysis in a slab configuration of two uniform inviscid fluids in relative motion, one with respect to the other, has been undertaken by Chandrasekhar (Reference Chandrasekhar1961) in the context of an incompressible HD and MHD descriptions. This simplified configuration is known in literature as the ‘vortex sheet’, as its vorticity distribution is described by a
 $\unicode[STIX]{x1D6FF}$
-function supported by a discontinuity in the velocity field at the sheet location. Although this configuration poses several mathematical and physical problems, it has the useful virtue of clearly showing the role of the different actors at play, governing the stability of the system. In the slightly refined version of Axford (Reference Axford1960) and Sen (Reference Sen1963), considering different magnitudes and directions of the magnetic field on the two sides of the vortex sheet, but still assuming a discontinuity between the two incompressible plasmas, the square of the growth rate reads
 $$\begin{eqnarray}\unicode[STIX]{x1D6FE}^{2}=\frac{n_{1}n_{2}}{(n_{1}+n_{2})^{2}}[\boldsymbol{k}\boldsymbol{\cdot }(\boldsymbol{U}_{2}-\boldsymbol{U}_{1})]^{2}-\frac{1}{4\unicode[STIX]{x03C0}(n_{1}+n_{2})m_{i}}\left[(\boldsymbol{k}\boldsymbol{\cdot }\boldsymbol{B}_{1})^{2}+(\boldsymbol{k}\boldsymbol{\cdot }\boldsymbol{B}_{2})^{2}\right],\end{eqnarray}$$
where
 $m_{i}$
is the ion mass,
 $\boldsymbol{k}=(0,k_{y},k_{z})$
is the wave vector,
 $n_{j},~\boldsymbol{U}_{j}$
and
 $\boldsymbol{B}_{j}$
are the equilibrium number density, velocity and magnetic field, on the left (
 $j=1$
) and on the right (
 $j=2$
) of the vortex sheet. This equation shows how the driver for the instability is provided by the velocity jump along the wave vector direction and how the magnetic tension, generated by the distortion of the magnetic field component parallel to
 $\boldsymbol{k}$
, stabilizes the mode. In the simplified case of uniform density and magnetic field, the stability condition simplifies to the well-known expression
 $M_{A,\Vert }\leqslant 2$
, where
 $M_{A,\Vert }$
is the Alfvén Mach number, defined as the ratio between the parallel velocity jump
 $\unicode[STIX]{x0394}U=\boldsymbol{k}\boldsymbol{\cdot }(\boldsymbol{U}_{2}-\boldsymbol{U}_{1})/|\boldsymbol{k}|$
and the Alfvén velocity associated with the parallel component of the magnetic field with respect to the wave vector directionFootnote
1
. In the case of non-uniform
 $\boldsymbol{B}_{\text{eq}}$
, the mode can have a positive growth rate either maximizing the driver (i.e. aligning its wave vector with the velocity field) or minimizing the second term of (2.4), or in between. At the same time, Sen (Reference Sen1964) pointed out a gradual stabilization of the mode when the compressibility of the plasma, not included in (2.4), is increased. In a magnetized system the degree of compressibility is determined by the Mach number
 $M_{f}$
associated with the fast magnetosonic mode, that is supported by thermal and magnetic pressure. Indeed, as in the HD system where the growth rate drastically drops as the sonic Mach number
 $M_{s}$
approaches one (Michalke Reference Michalke1964), in the magnetized system the growth rate decreases more and more as
 $M_{f}$
goes to one.
Although it is simple, the vortex sheet model is not suitable for investigating any real system with finite thickness as the Earth’s magnetopause. In fact it corresponds to the long wavelength approximation of a continuous shear layer with half-thickness
 $a$
, i.e. the vortex sheet analysis is valid in the limit of vanishing
 $ka$
. From a mathematical point of view, the vortex sheet problem is ill posed, having a growth rate that increases linearly with the wave vector. The correct description of a continuous shear layer not only leads to a complete stabilization of short wavelengths but also to a maximum growth rate, corresponding to the fastest growing mode (FGM) having
 $\boldsymbol{k}=k_{\text{FGM}}\,\hat{\boldsymbol{y}}$
with
 $2k_{\text{FGM}}a\simeq 0.8$
, that is limited by the maximum value
 $\unicode[STIX]{x1D6FA}_{\text{max}}$
of the equilibrium vorticity field. This has been pointed out, in an incompressible HD description with uniform density, by Rayleigh (Reference Rayleigh1880) for a linear piecewise velocity profile and by Michalke (Reference Michalke1964) for an hyperbolic tangent profile. In the case of a linear piecewise velocity profile, and neglecting any magnetic field contribution or density variation, the growth rate reads (Drazin & Reid Reference Drazin and Reid1981)
 $$\begin{eqnarray}\unicode[STIX]{x1D6FE}^{2}=\frac{\unicode[STIX]{x0394}U^{2}}{16\,a^{2}}\left[\text{e}^{-4ka}-\left(1-2ka\right)^{2}\right]\end{eqnarray}$$
showing a complete stabilization for
 $2ka\gtrsim 1.2$
, a maximum growth rate for
 $2k_{\text{FGM}}a\simeq 0.8$
and the usual vortex sheet behaviour (
 $\unicode[STIX]{x1D6FE}^{2}\simeq 1/4\,k^{2}\unicode[STIX]{x0394}U^{2}$
) only in the long wavelength approximation
 $ka\ll 1$
. It is worth noticing that the maximum growth rate
 $\unicode[STIX]{x1D6FE}_{\text{FGM}}\simeq 0.2\unicode[STIX]{x1D6FA}_{\text{max}}\simeq 0.2\unicode[STIX]{x0394}U/2a\simeq 0.25k_{\text{FGM}}\unicode[STIX]{x0394}U$
is smaller, by a factor of two, than the growth rate given by the vortex sheet analysis for
 $k_{y}=k_{\text{FGM}}$
. In the MHD framework, similar results have been recovered for a piecewise linear or cubic profile (Ong & Roderick Reference Ong and Roderick1972; Walker Reference Walker1981).
In conclusion, adopting a correct model based on a smooth profile allows us to predict the correct growth rate of the KHI in a continuous system such as the solar wind–magnetospheric one and to explain why a given wavelength emerges from a white noise perturbation. Furthermore it has been shown that a blind application of the stability condition given by (2.4) to the magnetopause, or other continuous systems, can lead to misleading conclusions. Indeed in many situations where the density, magnetic and velocity field profiles would be stable according to (2.4), the local variations of the fields make the system actually unstable because of the finite width of the layer that separates the two plasmas and/or because of the peculiar shape of the profiles into the transition region (Gratton et al. Reference Gratton2004). Using (2.4) which takes into account the asymptotic values of the fields only, is therefore not a sufficient condition to assert stability.
In the case of a velocity field aligned with the magnetic field are aligned, the most unstable mode naturally develops with a wave vector parallel to them. On the contrary, when they are far from being aligned, as is the case mainly during northward periods (when the IMF is predominately, but not strictly, perpendicular to the velocity field) the picture is more complex. In particular Southwood (Reference Southwood1968) and Walker (Reference Walker1981) pointed out that that the growth rate of the KHI is larger for the modes that minimize the stabilizing term related to
 $\boldsymbol{k}\boldsymbol{\cdot }\boldsymbol{B}_{\text{eq}}$
, instead of maximizing the driver one given by
 $\boldsymbol{k}\boldsymbol{\cdot }\boldsymbol{U}_{\text{eq}}$
Footnote
2
. As a results, the most unstable mode is flute-like (Rosenbluth & Longmire Reference Rosenbluth and Longmire1957) with a wave vector perpendicular to the mean magnetic field. In the limit of a unidirectional
 $\boldsymbol{B}_{\text{eq}}$
,
 $\boldsymbol{k}\boldsymbol{\cdot }\boldsymbol{B}_{\text{eq}}$
is zero everywhere and the KHI grows in a ‘transverse’ configuration. On the contrary, in the case of a sheared magnetic fieldFootnote
3
, the condition
 $\boldsymbol{k}\boldsymbol{\cdot }\boldsymbol{B}_{\text{eq}}=0$
can be satisfied only locally, into the magnetospheric region, in the magnetosheath or in between, depending on the relative strength of the magnetic field (Southwood Reference Southwood1968; Contin et al.
Reference Contin2003). Finally, when the magnetic rotation is too important, the magnetic tension, whose importance gradually grows away the location where
 $\boldsymbol{k}\boldsymbol{\cdot }\boldsymbol{B}_{\text{eq}}=0$
, can completely stabilize the mode. In the actual magnetospheric system the
 $\boldsymbol{k}$
-vector does not has the freedom to be exactly perpendicular to
 $\boldsymbol{B}_{\text{eq}}$
, because the northward direction is not an ignorable coordinate as in the reduced 2-D limit we are discussing. Therefore, it could be that
 $\boldsymbol{k}\boldsymbol{\cdot }\boldsymbol{B}_{\text{eq}}\neq 0$
everywhere even for a mode that minimizes the magnetic tension.
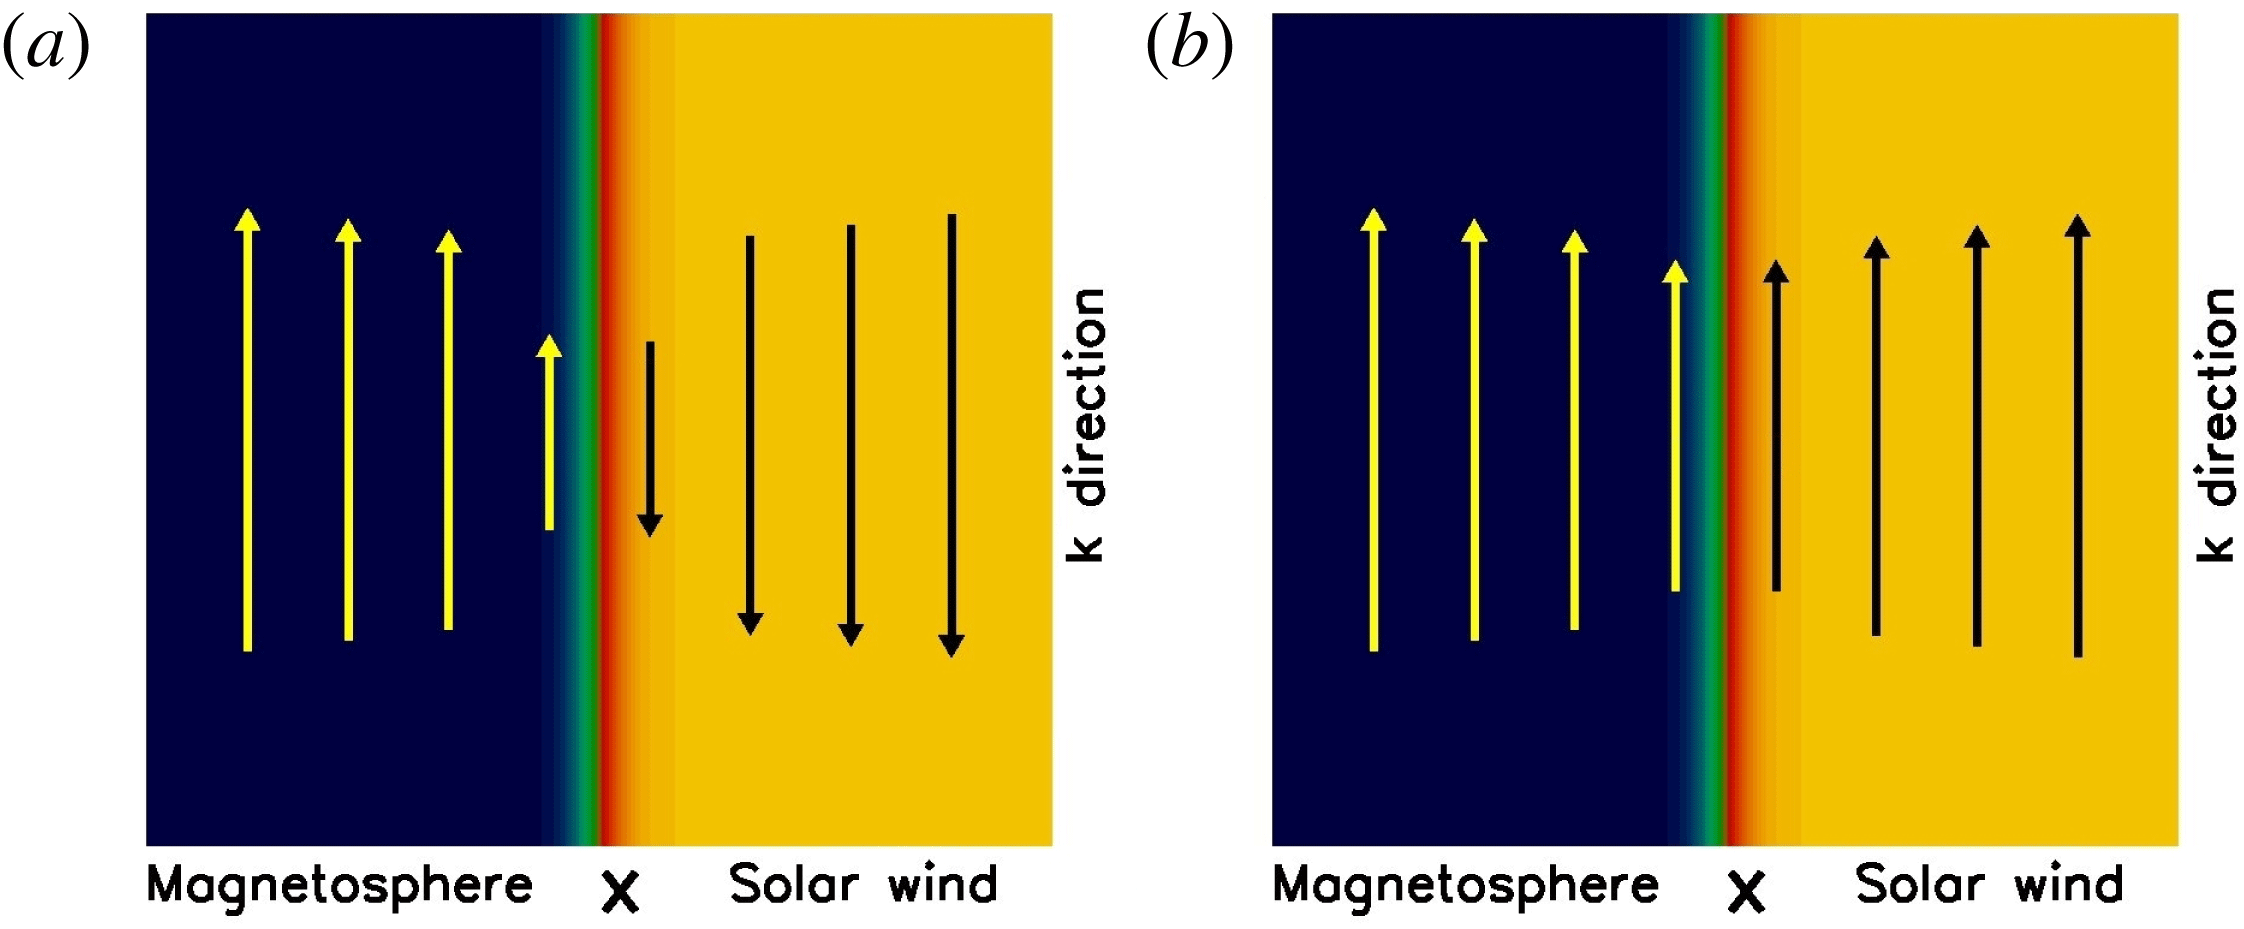
(a) Type I VIR configuration. Arrows represent the component of the equilibrium magnetic field lying in the dynamical plane defined by
 $\hat{\boldsymbol{x}}$
and
 $\boldsymbol{k}$
, which inverts its direction across the velocity shear layer the separates the two plasmas (blue and yellow regions) in relative motion. (b) Type II VIR configuration. The in-plane component is not necessary uniform but does not change its direction across the velocity shear layer.

This flute-like configuration has two important consequences: first of all, in a sheared magnetic field, the same place where the KHI grows can be a resonant surface for magnetic reconnection, leading to a possible coupling between the tearing instability (Furth Reference Furth1963; Coppi Reference Coppi1964; Wesson Reference Wesson1990) and the KHI (details are given in § 2.3). Furthermore, if we want to reduce the KH study to a 2-D problem, whose dynamical plane is defined by the inhomogeneity direction of the velocity shear,
 $x$
-axis, and by the wave vector of the most unstable mode (mainly aligned with the flow direction), we can expect to have two different configurations. In Type I VIR configuration (see figure 1) the in-plane component of the magnetic field
 $\hat{\boldsymbol{k}}\boldsymbol{\cdot }\boldsymbol{B}_{\text{eq}}$
becomes zero somewhere in the domain. For the sake of simplicity, in literature the null line is usually considered to be at the place where the maximum vorticity is. On the contrary, in Type II VIR configuration the in-plane component always differs from zero but, as in the first case, it is subdominant compared to the perpendicular one.
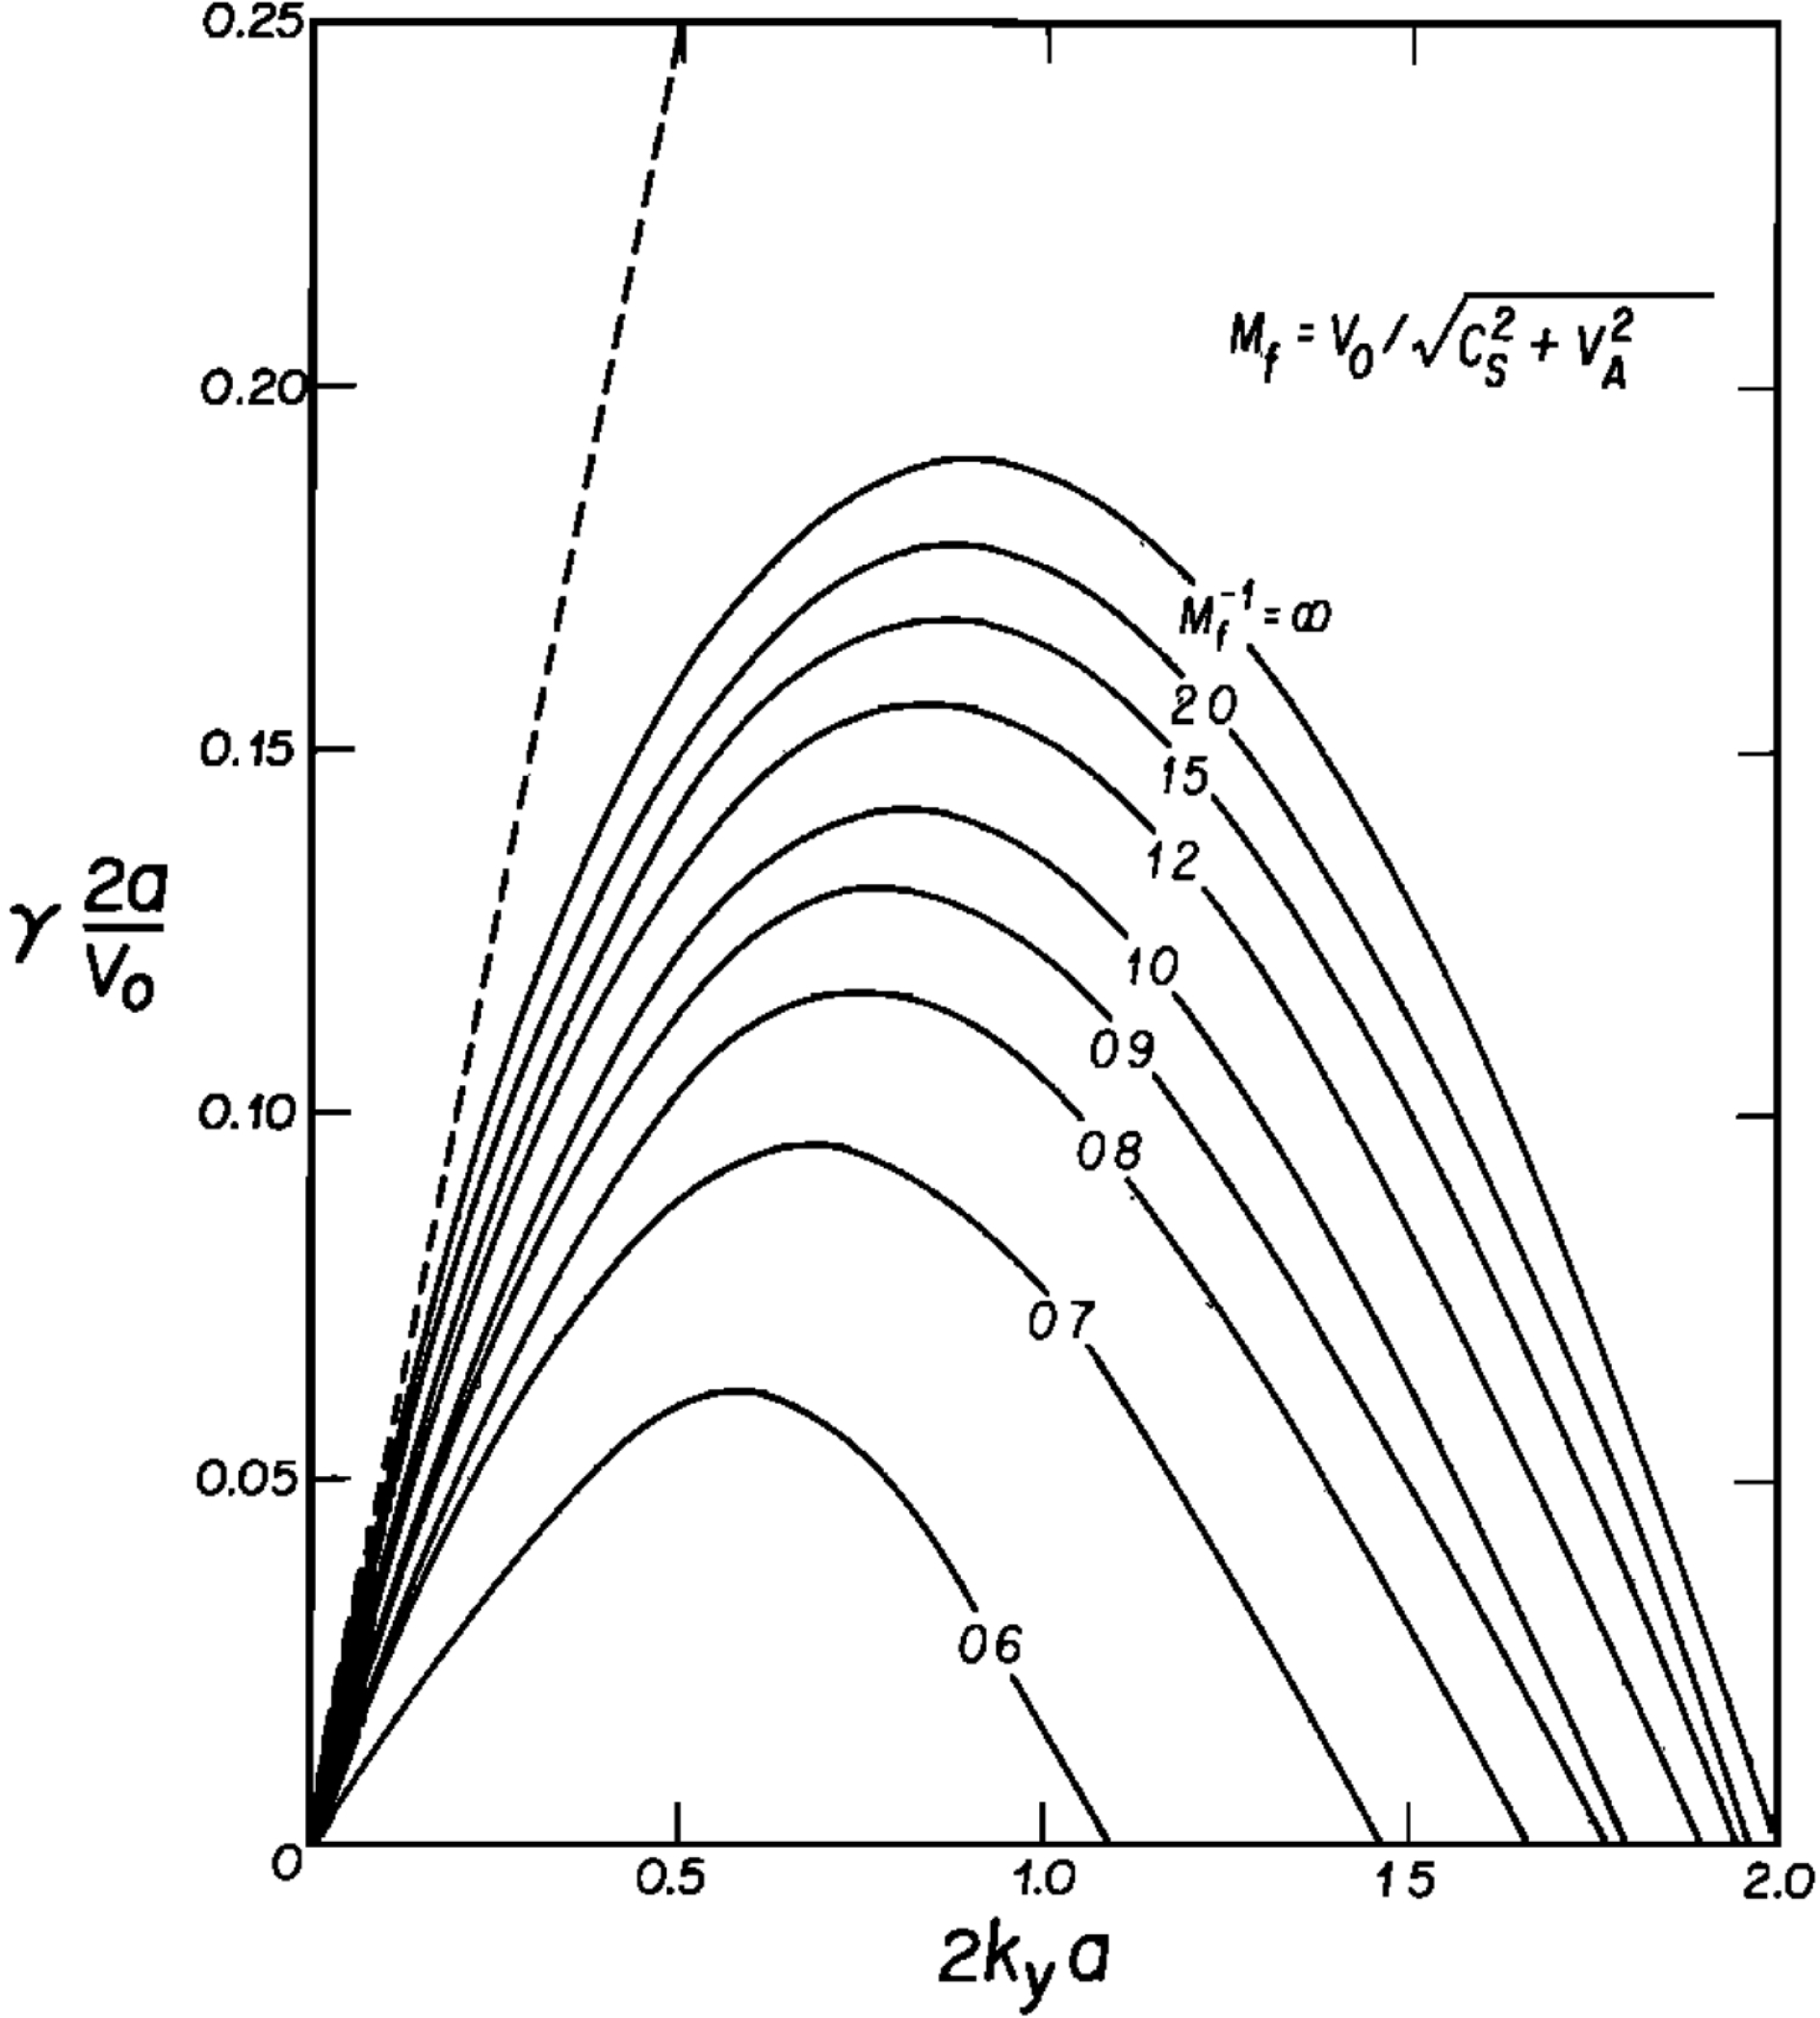
The normalized growth rate versus the normalized wave vector for the transverse case (
 $\boldsymbol{B}_{\text{eq}}\bot \boldsymbol{U}_{\text{eq}}$
).
 $M_{f}$
is the magnetosonic Mach number defined by
 $V_{0}/(c_{s}^{2}+V_{A}^{2})^{1/2}$
, where
 $\boldsymbol{U}_{\text{eq}}=V_{0}/2\tanh (x/a)\hat{\boldsymbol{y}}$
,
 $c_{s}$
is the sound speed and
 $V_{A}$
the Alfvén velocity associated with the transverse magnetic field. The dashed line is the growth rate for the incompressible case with the discontinuous velocity profile.

On these grounds, Miura & Pritchett (Reference Miura and Pritchett1982) performed a parametric study of the stability of an hyperbolic tangent velocity profile in the presence of an uniform magnetic field, with different orientations as compared to the flow direction showing a complete stabilization of the mode for
 $M_{f}>2$
in the transverse configuration and for
 $M_{A,\Vert }<2$
when the fields are aligned. In the unstable cases he obtained the bell-shaped dispersion relation shown in figure 2. At the same time, in a vortex sheet configuration Pu et al. (Reference Pu1983) showed that for super-magnetosonic flow the KH growth rate drops but that the mode is still unstable. Furthermore the mode changes its nature from a surface wave, evanescent along the inhomogeneity
 $x$
-direction, to a radiating mode with an oscillatory behaviour still along the
 $x$
-direction. In some sense an important part of the free energy associated with the gradient of the equilibrium flow is converted into radiating magnetosonic waves, instead of feeding the instability. On the other hand the oscillatory mode is not confined to the shear region and penetrates deep inside the magnetosphere/magnetosheath regions. When the density difference between the two regions is taken into account, the pointing vector of the mode has a component toward the tenuous region, transferring energy to the magnetosphere. This behaviour has been confirmed adopting a more realistic continuous profile and radiating boundary conditions (Miura Reference Miura1990).
It is worth noticing that a density variation between the two streaming fluids decreases the growth rate and, more importantly, modifies the phase velocity of the mode. For a magnetospheric application, the phase velocity of linear waves or of the resulting vortices is directly related to the observed frequency of the measured fluctuations (in the usual case when the vortex evolution time is far greater than the transit time they take for passing a satellite). In an incompressible vortex sheet the phase velocity is given by the centre of mass velocity of the two fluids, nevertheless this value can change due to either a finite layer thickness and a non-uniform magnetic configuration (Walker Reference Walker1981) or to supersonic non-homogenous flow (Lai & Lyu Reference Lai and Lyu2006; Palermo et al. Reference Palermo2011a ) or even to finite Larmor radius (FLR) effects (Nagano Reference Nagano1979). In the first two cases the asymmetry of the velocity, magnetic or density profiles causes the mode to develop with a greater amplitude inside one of the two fluids. The precise shape of the mode is given by the ‘natural’ minimization of the stabilizing effects, due to magnetic tension or fluid compressibility, that are not equal inside the two fluids. As a consequence, the phase velocity of the mode is closer to the equilibrium velocity of the fluid which advects the largest part of the perturbations. In the last case FLR effects naturally introduce drift velocities, such as the ion diamagnetic one, that contribute to the advection of the perturbation and thus to the phase velocity of the mode.
2.2 Two-fluid and kinetic corrections to linear theory
When the shear layer thickness
 $a$
becomes of the order of the ion length scale (ion skin depth and/or ion gyroradius) ion inertia effects or FLR effects are expected to cause a departure from the linear MHD behaviour. These effects can still be described in a fluid framework considering the Hall term in the generalized Ohm’s law, for the former, and ion gyroviscosity in the motion equation, for the latter. In this context, Fujimoto & Terasawa (Reference Fujimoto and Terasawa1991) showed that, for
 $a=2d_{i}$
the Hall term introduces oscillations at the
 $d_{i}$
scale in the
 $x$
profile of the eigenfunctions. Nevertheless the values of the growth rate and of the real frequency are only slightly modified in this regime.
On the other hand, the growth rate and frequency of the wave mode can be significantly modified by FLR effects, as shown by the analytical solutions of an incompressible vortex sheet configuration. In particular, it has been shown that gyroviscosity can cause a complete stabilization of the mode at small wavelengths (Hans Reference Hans1968). Furthermore Nagano (Reference Nagano1978) has shown that such stabilization depends on the sign of
 $\unicode[STIX]{x1D734}_{\text{eq}}\boldsymbol{\cdot }\boldsymbol{B}_{\text{eq}}$
, the scalar product of the equilibrium vorticity and magnetic field: the mode is partially stabilized for
 $\unicode[STIX]{x1D734}_{\text{eq}}\boldsymbol{\cdot }\boldsymbol{B}_{\text{eq}}>0$
but, on the contrary, it is further destabilized for
 $\unicode[STIX]{x1D734}_{\text{eq}}\boldsymbol{\cdot }\boldsymbol{B}_{\text{eq}}<0$
. Adding a thermal pressure jump across the sheet, i.e. a diamagnetic drift velocity supported by this variation, stabilizes or destabilizes the large wavelength modes for positive or negative values of
 $\unicode[STIX]{x1D734}_{\text{eq}}\boldsymbol{\cdot }\boldsymbol{B}_{\text{eq}}$
, respectively, and completely stabilizes small wavelengths in both cases (Nagano Reference Nagano1979). Although the choice of a zero thickness vortex sheet can be questionable when FLR effects are retained, this simplified configuration can give important hints for the KH dynamics at the magnetopause. From a theoretical point of view, gyroviscosity must be calculated by expanding the full pressure tensor in power of the small parameter
 $\unicode[STIX]{x1D70C}_{i}/L$
, where
 $L$
is the characteristic spatial scale of plasma variations (see Cerri et al. (Reference Cerri2013) and references therein), so that this parameter cannot be taken as small in the vortex sheet limit. Nevertheless, vortex sheet models including FLR effects were able to suggest a possible explanation of the LLBL asymmetry observed at the Dawn and Dusk sides, having the opposite sign of
 $\unicode[STIX]{x1D734}_{\text{eq}}\boldsymbol{\cdot }\boldsymbol{B}_{\text{eq}}$
. This behaviour has been confirmed by numerical simulations considering a compressible plasma and a shear layer with
 $a\gg \unicode[STIX]{x1D70C}_{i}$
(Huba Reference Huba1996)Footnote
4
, for which the gyroviscous approximation is justified.
The vortex sheet configuration has been investigated using the drift kinetic equations, able to include wave–particle interaction effects. In this context the main result is that the thermal ions can resonate with the KH mode with a phase velocity of the order of the thermal velocity. This is the case at the Earth’s magnetopause where the sonic Mach number is of order one and the phase velocity is of the order of the flow velocity. The effect of this interaction is a reduction of the KH growth rate and of the energy flux associated with the KHI toward the magnetosphere. Indeed part of the free energy provided by the flow is employed in heating the background plasma, instead of feeding the instability (Pu Reference Pu1989).
2.3 Coupling with other modes
As suggested before the KHI could couple with other kinds of modes. In particular, when the conditions for magnetic reconnection to occur are satisfied somewhere inside the velocity shear layer, the tearing mode could be unstable at the same place of the KHI and the two instabilities may couple, even if the main driver remains the KHI. These conditions are given by, first of all, the presence of a sheared magnetic field as well as by the existence of at least one resonant surface defined by
 $\boldsymbol{k}\boldsymbol{\cdot }\boldsymbol{B}_{\text{eq}}=0$
. The simplest suitable configuration (monotonic
 $\boldsymbol{k}\boldsymbol{\cdot }\boldsymbol{U}_{\text{eq}}$
and
 $\boldsymbol{k}\boldsymbol{\cdot }\boldsymbol{B}_{\text{eq}}$
profiles) is the one adopted for investigating Type I VIR (see figure 1). In the context of a MHD description including a small resistivity or a finite electron mass, it has been shown that the KHI and the tearing mode are never unstable at the same time instant and thus do not couple at all. In fact, the tearing mode is strongly modified by the presence of the velocity shear layer but it is completely stabilized when the conditions for the KHI are fulfilled, i.e. when the magnetic tension associated with the sheared field is overwhelmed by the velocity driver (Hofmann Reference Hofmann1975; Einaudi & Rubini Reference Einaudi and Rubini1986; Chen & Morrison Reference Chen and Morrison1990; Faganello et al.
Reference Faganello2010).
On the other hand, when the width of the magnetic and velocity shear layer is of the order of the ion skin depth, the Hall term changes the MHD dynamics and allows the tearing mode to be unstable above the KHI threshold (Chacón et al. Reference Chacón2003). The hybrid mode resulting from the coupling disappears well above the threshold, when the surviving pure KHI can develop vigorously. This is the usual regime that is investigated in the magnetospheric context, meaning that magnetic reconnection occurring in the Type I VIR configuration is not associated with a hybrid mode but it is simply forced by the KH velocity perturbations that pinch the current layer (see § 3.2 for details).
A different kind of coupling can occur between the KHI and Alfvén waves having a small component of their wave vector parallel to the magnetospheric magnetic field. This coupling is possible when the KHI changes its nature from a surface to a radiating one, i.e. around the threshold transition for super-magnetosonic KHI. Indeed, although its growth rate is far smaller, the super-magnetosonic mode can ‘explore’ deeper region inside the magnetosphere, where the magnitude of the magnetic field drastically increases. Indeed, at the location where the phase velocity matches the local Alfvén frequency, the mode can resonate with the magnetospheric lines. This possibility has been investigated by adopting a simplified slab geometry showing that this coupling can produce oscillations of the high-altitude magnetic field in the ultra low frequency (ULF) range (Fujita et al. Reference Fujita1996; Mann et al. Reference Mann1999; Mills & Wright Reference Mills and Wright1999).
2.4 Local stability analysis of the magnetopause
The first local stability analysis of the magnetospheric system has been performed by Sen (Reference Sen1965), applying the vortex sheet analysis to the ‘equilibrium’ fields of a model magnetopause. This study highlights the important role played by the magnetic shear between the IMF and the magnetospheric field for stabilizing the KHI and pointed out that the low-latitude region of the magnetopause is indeed unstable in the case that the shear between the IMF and the magnetospheric field is low enoughFootnote 5 .
More recently Farrugia et al. (Reference Farrugia1998) and Gratton et al. (Reference Gratton2003) applied the analytical results of both the vortex sheet and the continuous shear layer to a more refined model of the magnetopause. In this case the ‘equilibrium’ magnetic field advected by the solar wind is evaluated, at an imposed paraboloid boundary representing the magnetopause, using a global MHD code, once the upstream conditions are imposed, i.e. intensity and orientation of the IMF, as well as the unperturbed wind parameters. Looking at the stability of the layer, they showed that the tension associated with the (sheared) magnetic field dominates the velocity driver at high latitudes and completely stabilizes these regions, while the low-latitude regions remain unstable. At the same time, exploring different conditions for the IMF, they showed how local stability conditions change and how the unstable region migrates away from the equatorial region when the IMF deviates from a purely northward direction. In particular, it is shown that for a clock angle equal to
 $30^{\circ }$
, corresponding to a duskward component of the IMF equal to
 $1/3$
of the northward one, the unstable regions are in the northern and southern hemispheres at the Dawn and Dusk flanks, respectively. Indeed, these are the regions where the IMF and the magnetospheric field are parallel, and where KHI can grow by minimizing the magnetic tension.
3 Fluid nonlinear evolution
We discuss now the results of ‘ab initio’ numerical simulations concerning the nonlinear dynamics of a magnetized velocity shear layer, including density variations, when fully rolled-up vortices are generated by the KHI. These results are obtained in the framework of a MHD, Hall-MHD or two-fluid plasma model. In this approach the plasma dynamics is usually described by a continuity equation for the density
 $n$
, a momentum equation for the centre-of-mass fluid velocity
 $\boldsymbol{U}\simeq \boldsymbol{u}_{i}$
(
 $\boldsymbol{u}_{i}$
is the ion fluid velocity) and by closure equations for ion and electron thermal pressures. The magnetic field dynamics is calculated by coupling Faraday’s Law
 $$\begin{eqnarray}\unicode[STIX]{x2202}_{t}\boldsymbol{B}=-c\unicode[STIX]{x1D735}\times \boldsymbol{E},\end{eqnarray}$$
with a generalized Ohm’s law, approximately describing the electron dynamics. In the case of massless electrons the ideal MHD and the Hall-MHD Ohm’s law, equations (3.2) and (3.3), respectively, read
 $$\begin{eqnarray}\displaystyle & \displaystyle \boldsymbol{E}=-\frac{\boldsymbol{U}}{c}\times \boldsymbol{B} & \displaystyle\end{eqnarray}$$
 $$\begin{eqnarray}\displaystyle & \displaystyle \boldsymbol{E}=-\frac{\boldsymbol{u}_{e}}{c}\times \boldsymbol{B}-\frac{1}{ne}\unicode[STIX]{x1D735}P_{e}, & \displaystyle\end{eqnarray}$$
where
 $\boldsymbol{u}_{e}=\boldsymbol{u}_{i}-\boldsymbol{J}/ne$
is the electron fluid velocity,
 $\boldsymbol{J}=(c/4\unicode[STIX]{x03C0})\unicode[STIX]{x1D735}\times \boldsymbol{B}$
is the current density (neglecting the displacement current),
 $P_{e}$
is the scalar electron pressure and
 $e$
the electron charge. Magnetic reconnection can be described either by adding a small but finite (artificial) resistive term
 $\unicode[STIX]{x1D702}\boldsymbol{J}$
to (3.2) or (3.3), or by taking into account the electron inertia in Ohm’s law
 $$\begin{eqnarray}\boldsymbol{E}-d_{e}^{2}\unicode[STIX]{x1D6FB}^{2}\boldsymbol{E}=-\frac{\boldsymbol{u}_{e}}{c}\times \boldsymbol{B}-\frac{1}{ne}\unicode[STIX]{x1D735}P_{e},\end{eqnarray}$$
where
 $d_{e}$
is the electron skin depth.
The large majority of the results using a fluid approach have been obtained adopting a 2-D description, where all fields are three-dimensional but depend only on two coordinates (also known as
 $2{\textstyle \frac{1}{2}}D$
description), mapping the dynamical plane defined by the inhomogeneity in the
 $x$
-direction of the equilibrium quantities and by a selected
 $\boldsymbol{k}$
direction. The
 $x$
-direction can be identified as the direction when passing from the magnetopause towards the magnetosphere. Furthermore, for the sake of simplicity, we take
 $\boldsymbol{k}$
aligned with the ‘solar wind’ flow,
 $y$
-direction, unless otherwise specified, meaning that the simulation plane corresponds to the equatorial plane and that all quantities (equilibrium, perturbations) are independent of the northward
 $z$
-direction, the so-called ignorable coordinate. Although less realistic than adopting a full three-dimensional geometry, the 2-D configuration allows for a rigorous and deep study for the understanding of the physics underlying the dynamics of the magnetized KHI when varying the main physical parameters. There are two main advantages of this approach. First of all, the invariance of the system along the
 $z$
-direction permits a description of the in-plane magnetic field using only the
 $z$
-component of the vector potential
 $\boldsymbol{A}$
. In this limit, magnetic surfaces are well defined and described by a scalar flux function
 $A_{z}(x,y)$
, greatly simplifying the analysis of the magnetic dynamics, the identification of the reconnection sites and the evaluation of the reconnection growth rate. Furthermore, the use of a generalized Ohm’s law (3.2), (3.3) or (3.4), in the limit
 $\unicode[STIX]{x2202}_{z}=0$
, allows for a complete decoupling of the in-plane and transverse magnetic dynamics. For example, in the case of an initial strictly perpendicular magnetic field (i.e. including the fluctuations),
 $\boldsymbol{B}(t=0)=B_{z}(x,y)\hat{\boldsymbol{z}}$
, the magnetic field remains perpendicular to the dynamical plane at all times.
3.1 Transverse configuration
The transverse configuration is characterized by a magnetic field strictly perpendicular to the flow direction corresponding to the simplest possible geometry describing the magnetized KH evolution. In this case the instability naturally develops with a wave vector
 $\boldsymbol{k}$
perfectly aligned with the velocity field
 $\boldsymbol{U}$
and perpendicular to the magnetic field. As a consequence, the 2-D plane of the dynamics is identified by the two perpendicular vectors
 $\hat{\boldsymbol{x}}$
and
 $\boldsymbol{k}$
, where
 $\hat{\boldsymbol{x}}$
is the direction of the shear assumed perpendicular to the flow direction.
Although extremely schematic, this configuration allows for a relatively deep study of the KHI where the field-aligned dynamics associated with Alfvén waves, whistler waves and magnetic reconnection is completely neglected. In the MHD framework only the fast magnetosonic waves survive for a strictly transverse configuration, leading to a nearly HD evolution of the system, once the sound speed is replaced by the fast magnetosonic velocity.
This system has been studied during the linear and nonlinear phase (Miura Reference Miura1982) by adopting a single-vortex configuration by taking a numerical box length
 $L_{y}$
along the flow direction equal to the FGM wavelength. In particular, when
 $M_{f}<2$
the usual KH surface mode can grow. The FGM grows and dominates, and eventually saturates in a single-vortex structure. As in the HD case, the vortex is characterized by a minimum of the total pressure inside the vortex and a maximum at the hyperbolic point of the velocity field, in between two consecutive vortices (note that a single-vortex configuration corresponds to a periodic chain of identical vortices). The saturated configuration, corresponding to a fully rolled-up vortex, can be seen as a nearly stationary equilibrium with a balance between the centrifugal force and the gradient of the total pressure. In this transverse configuration only the Reynolds stress contributes to the average stress, generated by the vortex, tangential to the unperturbed frontier. This effective eddy viscosity generates a momentum transfer between the two flowing plasmas and, as a consequence, a gradual broadening of the initial velocity profile, i.e. an effective viscous drag between the flowing solar wind and the magnetosphere. Anyway it is important to underline that the choice of
 $L_{y}=\unicode[STIX]{x1D706}_{\text{FGM}}=2\unicode[STIX]{x03C0}/k_{\text{FGM}}$
precludes the most important natural evolution of a nearly 2-D HD system, that is an inverse cascade process where close vortices merge generating larger and larger vortex structures (Winant & Browand Reference Winant and Browand1974).
Vortex pairing has been shown to be effective in 2-D magnetized simulations adopting an electrostatic kinetic description for the ions (Pritchett & Coroniti Reference Pritchett and Coroniti1984) or a classical MHD description of the shear layer (Wu Reference Wu1986) (see § 4.1 or hereafter). However, the first quantitative analysis of this process has been carried out by Miura (Reference Miura1997), adopting an MHD description with a periodic box along the flow direction
 $\hat{\boldsymbol{y}}$
and taking all the equilibrium quantities but the velocity as homogeneous. In this case, taking
 $L_{y}=4\,\unicode[STIX]{x1D706}_{\text{FGM}}$
, the process is described by the linear evolution, saturation and nonlinear coupling of the FGM, with mode number
 $m=m_{\text{FGM}}=4$
, and its subharmonics. Initially the FGM emerges but, after saturation, the
 $m=2$
amplitude becomes dominant (first vortex pairing) and finally the
 $m=1$
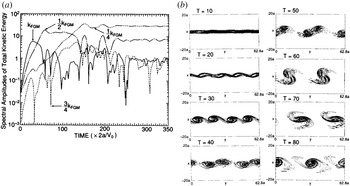
mode reaches the greatest amplitude (second vortex pairing). In figure 3 we show the long-time evolution of the mode driven by the interaction between couples of close vortices, namely vortex pairing, resulting in a progressive generation of larger and larger vorticesFootnote
6
. It is worth noticing that the effective viscosity associated with the Reynolds stress is far greater during each pairing process as compared to that observed during the linear evolution or early saturation of the FGM only. This means that vortex pairing can mediate the interaction between the flowing solar wind and the magnetosphere more efficiently than a chain of single saturated vortices. Indeed the broadening of the initial velocity profile is enhanced as pairing goes on. Using an even longer numerical box with
 $L_{y}=8\,\unicode[STIX]{x1D706}_{\text{FGM}}$
Miura (Reference Miura1999a
,Reference Miura
b
) extrapolated the dominant wavelength as a function of time. Since the magnetopause vortices, while growing, move tailward at approximately one half of the solar wind speed and eventually merge, a linear relation between wavelength and time should correspond to an observed dominant wavelength growing with the distance from the subsolar point. Miura (Reference Miura1999b
) thus proposed an indirect method for inferring the velocity shear width near the subsolar point, by looking at the dominant KH wavelength at different locations along the magnetopause, an useful technique when vortex pairing is assumed to be effective (Foullon et al.
Reference Foullon2008; Hasegawa et al.
Reference Hasegawa2009; Lin et al.
Reference Lin2014).
(a) Temporal evolution of the amplitudes of the fundamental mode
 $m=4$
with
 $k=k_{\text{FGM}}$
(solid curve), the first subharmonic
 $m=2$
with
 $k=k_{\text{FGM}}/2$
(dot-dashed curve), the second subharmonic
 $m=1$
with
 $k=k_{\text{FGM}}/4$
(triple dot-dashed curve) and the Fourier mode
 $m=3$
with
 $k=3k_{\text{FGM}}/4$
(dotted curve) of the total kinetic energy integrated along
 $x$
, in a transverse configuration (Miura Reference Miura1997). (b) Contour lines of the
 $z$
component of the vorticity at eight different times (Miura Reference Miura1997). All amplitudes are normalized using
 $a$
,
 $V_{0}$
and the ion mass, where
 $\boldsymbol{U}_{\text{eq}}=V_{0}/2\tanh x/a\hat{\boldsymbol{y}}$
.

Relating the temporal evolution of a periodic vortex chain to the actual evolution of the KH modes propagating at the magnetopause is not trivial. Manuel & Samson (Reference Manuel and Samson1993) discussed the difference between the usual shear layer description, also known as ‘temporally developing’ shear layer and the ‘spatially developing’ shear layer. In the first case a periodic box is initiated with wave-like, non-localized perturbations, resulting in a layer that evolves in time but that, finally, is similar to itself all along the box. In the latter, inflow and outflow conditions for the flowing solar wind are imposed at the
 $y$
-boundaries (flow direction) of the numerical box and localized wavepackets are perturbed close to the inflow boundary. These packets evolve while moving along the flow direction, possibly giving rise to a perturbed layer that greatly varies along this direction since at the end the evolved wavepacket must get out from the simulation box. As discussed by Miura (Reference Miura1999b
), we can relate, via the phase velocity, what we observe in the periodic system, at a given time, to what would happen at a given spatial position in the corresponding ‘spatially developing’ layer. Nevertheless, one must bear in mind that no event is capable of affecting the prior development of the system. Therefore, adopting a ‘temporally developing’ layer, the dynamics occurring at a given magnetopause position (corresponding to a given time of the layer evolution) can influence the downstream dynamics only (corresponding to a later time of the layer evolution). On the contrary, in a ‘spatially developing’ layer a given event, at a given position, can influence the dynamics of the system also in the upstream region, compared to its position, and thus alter the development of the instability itself. Anyway, different HD and MHD ‘spatially developing’ simulations (Wu Reference Wu1986; Wei et al.
Reference Wei1990; Manuel & Samson Reference Manuel and Samson1993; Wei & Lee Reference Wei and Lee1993), adopting a very long box as compared to
 $\unicode[STIX]{x1D706}_{\text{FGM}}$
and imposing the inflow at the upstream
 $y$
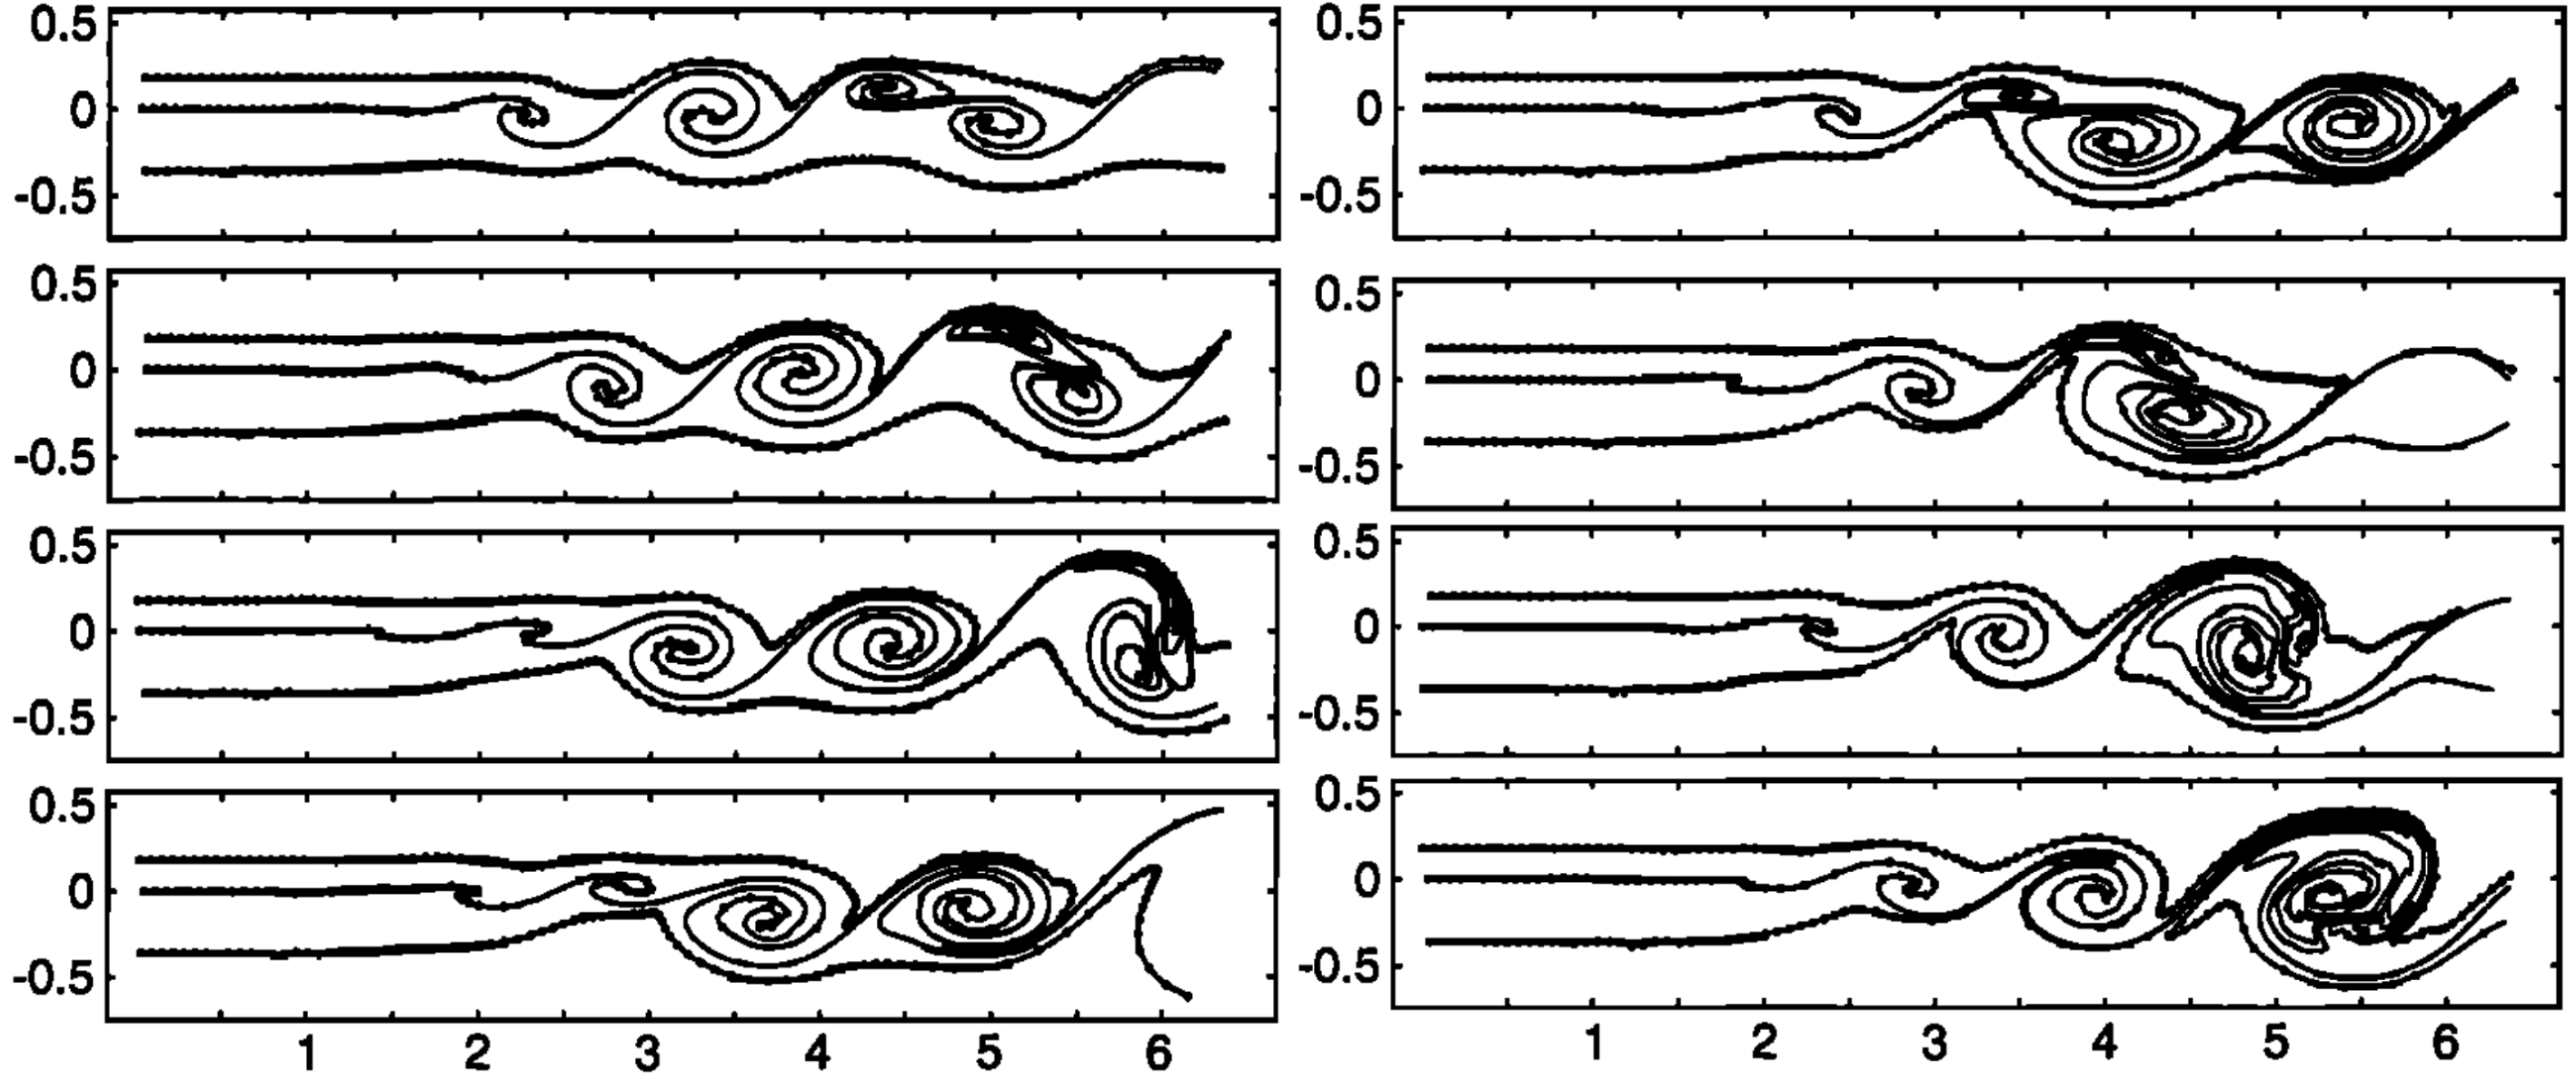
-boundary, show that the spatial evolution of the shear layer is similar to the one inferred from periodic simulations: localized perturbations grow moving along the flow giving rise to fully developed vortices that merge together eventually leading to a ‘nearly stationary’ perturbed layer where the average vortex length and amplitude grow linearly with distance from the initial perturbed location, as shown in figure 4. In a more rigorous way, Mills (Reference Mills2000) and Wright et al. (Reference Wright2000) demonstrated that the KHI changes its nature from ‘absolute’ to ‘convective’ instability depending on the adopted reference frame, the one moving at the group velocity of the mode or the Earth’s rest frame. In the first case, any point of a perturbed wavepacket grows in time and it is straightforward to define a temporal growth rate for a localized perturbation. In the second case, it does not because the localized perturbation moves away while growing. In this ‘convective’ case, it is more convenient to define a spatial growth rate by relating the distance covered by the wavepacket and its amplitude. In a similar way they defined the
 $e$
-folding distance, the spatial length a wavepacket takes to become nonlinear, showing that it is sufficiently short to allow the subsonic KHI to roll up at the dayside magnetopause and for the pairing process to be effective in the near tailFootnote
7
.
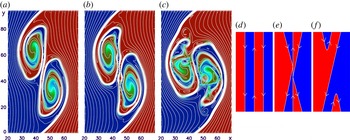
Snapshots of streamlines for a ‘spatially developing’ shear layer at different times (Manuel & Samson Reference Manuel and Samson1993). In each panel the top streamline is in the magnetosheath, the middle one at the centre of the shear layer and the bottom one in the magnetosphere. Note that the equilibrium flow is along the horizontal axis. Lengths are given in Earth’s radii.

Actually, the nonlinear evolution of the KHI can follow a totally different evolution, depending on the spatial non-uniformities of the initial equilibrium, in particular of the density field. Indeed once a single-vortex configuration has reached its saturation stage, the combined action of the spatial non-uniformities distorted by the folding motion and the vortical motion itself, can provide the favourable conditions for secondary instabilities to develop locally. On this point, when an equilibrium density variation across the shear layer is taken into account (as when passing from the magnetopause to the magnetosphere), it has been shown (Matsumoto & Hoshino Reference Matsumoto and Hoshino2004) that the primary KHI can drive secondary Rayleigh–Taylor and KH instabilities growing along the vortex arms. The former is related to the combined action of rotation, acting as en effective gravity
 $\boldsymbol{g}_{\text{eff}}$
, and density variations. In particular, depending on the relative orientation of
 $\boldsymbol{g}_{\text{eff}}$
and
 $\unicode[STIX]{x1D735}n$
, the folded boundary between the two plasmas alternating into the spiral arms of the vortices can be stable or unstable. The latter instead is related to the formation of velocity shear layers developing inside the vortex, due to the fact that, under the influence of the same centripetal force determined by the total pressure gradient, the denser plasma must rotate slower as compared to the tenuous one. These two instabilities can completely disrupt the vortex structure leading to the formation of a turbulent mixing layer, whose spectrum slope is determined by the initial density jump across the shear layer (Matsumoto & Hoshino Reference Matsumoto and Hoshino2004).
A different secondary instability that tends to reduce the vortex coherence was found by Nakamura et al. (Reference Nakamura2004) who showed that the in-plane current at the hyperbolic point can be unstable to a kink-like instability, once the electron inertia is included in the model. Per se this instability cannot disrupt the vortex but the perturbation generated can serve as a seed for secondary KHI. Depending on the sign of
 $\unicode[STIX]{x1D734}_{\text{eq}}\boldsymbol{\cdot }\boldsymbol{B}_{\text{eq}}$
the seed is quickly advected (as compared to the vortex evolution time) from the hyperbolic point to regions of the primary vortex that are unstable against secondary KHI or that are stable. This different behaviour suggests a possible Dawn/Dusk asymmetry resulting from the nonlinear evolution of KHI instability, with a vortex disruption far more pronounced at the Dusk side. A different reason for asymmetry can arise from the Hall term in the generalized Ohm’s law. In the quite extreme and unrealistic case when
 $a/d_{i}\ll 1$
(where
 $a$
represents both the width of the velocity and density shear layer), a new drift mode related to
 $\unicode[STIX]{x1D735}n\times \boldsymbol{B}$
could develop and influence the nonlinear evolution of a single vortex via the development of small-scale fluctuations (Huba Reference Huba1994). Depending on the relative direction of the phase velocity of the drift mode, proportional to
 $\unicode[STIX]{x1D735}n_{\text{eq}}\times \boldsymbol{B}_{\text{eq}}$
, and of the KH mode, the broadening of the velocity profile at the single-vortex saturation can be more or less pronounced when compared to the usual MHD evolution. At the magnetopause the sign of
 $(\unicode[STIX]{x1D735}n_{\text{eq}}\times \boldsymbol{B}_{\text{eq}})\boldsymbol{\cdot }v_{\text{ph,KH}}$
is exactly the same as
 $\unicode[STIX]{x1D734}_{\text{eq}}\boldsymbol{\cdot }\boldsymbol{B}_{\text{eq}}$
and corresponds to a Dusk or Dawn flank configuration.
Density isocontour after the saturation of the
 $m=2$
FGM, in the case of moderate density jump (a,
 $n_{\text{sh}}-n_{\text{sph}}=0.6\,n_{\text{sh}}$
) and of larger density jump (c,
 $n_{\text{sh}}-n_{\text{sph}}=0.8\,n_{\text{sh}}$
), in a transverse configuration. (b,d) Represents a cut of the simulation domain at
 $x=45$
, after pairing (b) or disruption (d) have taken place. It corresponds to the temporal profile of density, measured by a stationary synthetic spacecraft surveying the moving structures. Lengths are normalized using the ion skin depth and density using the
 $n_{\text{sh}}$
(Faganello et al.
Reference Faganello2008a
).

Adopting a ‘more realistic’ configuration (i.e. using a numerical box longer than
 $\unicode[STIX]{x1D706}_{\text{FGM}}$
) secondary instabilities developing inside each vortex compete with the merging process. In this context it was clearly shown that the system evolution presents a bifurcation depending on the magnitude of the equilibrium density jump across the initial shear layer (Faganello et al.
Reference Faganello2008a
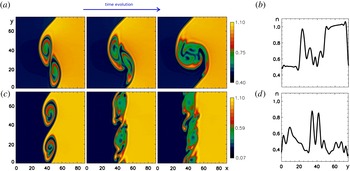
). In the case of a moderate density jump, the pairing process naturally proceeds. On the contrary, for a larger jump the secondary Rayleigh–Taylor instability takes over and the vortices are completely disrupted. As discussed before, this kind of schematic study (transverse configuration, neglecting the out-of-plane dynamics and adopting a one-dimensional equilibrium) does not pretend to quantitatively predict the KHI evolution at the magnetopause but to show and analyse the different processes at play in such a system that can be selected by the different physical parameters. This approach therefore intends to suggest possible different evolutions of the system, that are qualitatively different and would be characterized by totally different observational signatures (e.g. see figure 5 for the signatures that would emerge by a satellite crossing either merged or disrupted structures). Looking at satellite data, it should be possible to determine the evolution path of the system and the mechanisms that should be effective at the magnetopause. In particular, the density pattern of a merged vortex, as measured by a stationary satellite surveying the moving structure, is similar to that of a single-vortex configuration, but have a bigger wavelength compared to the one expected to emerge from a typical magnetopause profile. This pattern exhibits a typical step-like profile, corresponding to a sharp density variation at the hyperbolic point (see figure 5
b, at
 $y=24\unicode[STIX]{x03C0}\simeq 75$
) and to nearly flat profiles corresponding to the magnetospheric and magnetosheath arms of the vortex, together with finer structures related to the internal region of the vortex. On the contrary disrupted vortices, eventually forming a mixing layer, would show only filamentary, turbulent-like structures without any given periodicity as shown in figure 5(d).
When the dynamics along the
 $z$
-direction is switched on, HD secondary instabilities develop in a similar way, having the tendency to develop with a wave vector perpendicular to the magnetic field, as in the 2-D purely transverse configuration. However, a new kind of secondary instability can emerge (Matsumoto & Seki Reference Matsumoto and Seki2007), acting on the shoulder of a saturated single vortex seen as a rotating and axisymmetric equilibrium configuration. This instability can be seen as a generalization of the magnetorotational instability (Velikhov Reference Velikhov1959; Chandrasekhar Reference Chandrasekhar1961; Balbus & Hawley Reference Balbus and Hawley1991, Reference Balbus and Hawley1998), having a finite
 $k_{z}$
but also a finite azimuthal mode number. Nevertheless for
 $\unicode[STIX]{x1D6FD}=8\unicode[STIX]{x03C0}P_{\text{eq}}/|\boldsymbol{B}_{\text{eq}}|^{2}$
of the order of the unity, as is the case at the Earth’s magnetopause, the vertical wavelength
 $\unicode[STIX]{x1D706}_{z}$
of this secondary instability is of the same order as the connection length between KH stable (high-latitude) and unstable (low-latitude) regions. This fact suggests that equilibrium variations along the
 $z$
-direction and line tying should be taken into account. In this case the plasma and magnetic dynamics seem to be dominated by totally different phenomena as compared to magnetorotational instability (see § 5 and Faganello et al. (Reference Faganello2012b
) for further details). The importance of the line-tying effect, completely missed in a 2-D geometry, can be easily understood by noticing that the Earth’s field lines and the solar wind field lines, both connected and anchored in the vortices developing in the equatorial region, are stuck at the Earth or free to move, respectively.
3.2 Type I VIR configuration
The equilibrium configuration leading to a Type I VIR is shown in figure 1(a). The in-plane component of the equilibrium magnetic field inverts its direction across the velocity shear layer. As discussed before this configuration corresponds to a 2-D projection of the full three-dimensional system having a sheared magnetic field on the 2-D plane defined by
 $\hat{\boldsymbol{x}}$
and
 $\boldsymbol{k}$
. Indeed, at least in the idealized case where the equilibrium does not vary along the
 $z$
-coordinate, the FGM has a wave vector that is not perfectly aligned with the flow direction
 $\hat{\boldsymbol{y}}$
but naturally orients itself such that
 $\boldsymbol{k}_{_{\text{FGM}}}\boldsymbol{\cdot }\boldsymbol{B}_{\text{eq}}\simeq 0$
, in order to limit as much as possible the impact of magnetic tension. For the sake of simplicity, in the literature the null line of the in-plane magnetic field is usually located where the maximum vorticity is, assuming that the system is fairly symmetric with respect to the shear layer (Southwood Reference Southwood1968; Contin et al.
Reference Contin2003). This configuration allows us to explore the linear and nonlinear behaviour of magnetic reconnection, possibly occurring at the resonant surface where the in-plane magnetic field goes to zero, in the regime where the KHI grows vigorously. From the magnetospheric point of view it corresponds to a configuration where the IMF is not perfectly aligned with the Earth’s dipole and
 $\boldsymbol{k}$
takes a finite
 $z$
-component for minimizing the magnetic tension effect exactly at the magnetopause, at low latitude.
The first numerical studies on Type I VIR where performed in the resistive reduced-MHD framework and, although barely resolved, clearly showed that reconnection at the null line is forced by the velocity field generated by the growing KHI (Liu & Hu Reference Liu and Hu1988; Fu et al.
Reference Fu1995a
,Reference Fu
b
). Indeed when the in-plane Alfvénic Mach number
 $M_{A,\Vert }$
, defined using the asymptotic value of the in-plane Alfvén velocity
 $V_{A,\Vert }$
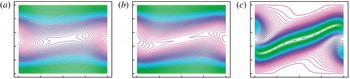
, is greater than a critical value (let say order one), the velocity driver wins over magnetic stabilization and the KHI can grow, nearly independently from a small value of the resistivity. In this case the velocity field around the KH hyperbolic point has the same structure of the usual inflow/outflow pattern that characterizes a reconnection X-point but, this time, imposed by the growing ideal instability. The result is that field lines belonging at the two different regions are pushed together at the hyperbolic point where a small but finite resistivity acts to break the frozen-in condition and eventually allows for reconnection, as shown in figure 6. This process is characterized by a reconnection growth rate comparable to that of the KHI (far greater than that expected for spontaneous reconnection) and by the formation of a magnetic island that coincide with the vortex structure (X-point at the hyperbolic point and O-point in the vortex core).
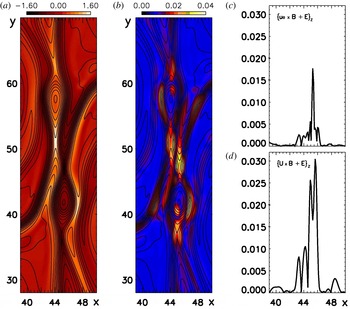
Snapshots of streamlines (a), magnetic field lines of the in-plane magnetic field (b) and isocontours of the
 $z$
-component of the current density (c), for resistive Type I VIR in a single-vortex configuration (Knoll & Chacón Reference Knoll and Chacón2002). The hyperbolic point, where the current is pinched and reconnection occurs, is in the centre of the numerical box. Note that in this case the equilibrium flow is along the horizontal axis. Lengths are in arbitrary units.

More recent, better resolved MHD simulations (Chen et al.
Reference Chen1997; Knoll & Chacón Reference Knoll and Chacón2002) have confirmed that, when
 $M_{A,\Vert }>2$
, the KHI starts to grow and the reconnection rate is the same as the ideal instability. Indeed it scales with
 $\unicode[STIX]{x0394}U$
and has a very weak dependence with respect to
 $\unicode[STIX]{x1D702}$
. Furthermore these studies relate the reconnection at hyperbolic point to the pinching of the pre-existing equilibrium current layer, leading to a local and enhanced resistive dissipation. In particular Knoll & Chacón (Reference Knoll and Chacón2002) discussed how the width of the original current layer drops during the early evolution of the KHI down to a value
 $\unicode[STIX]{x1D6FF}\sim S^{-1/2}$
such that the dissipation rate of magnetic flux, nearly equal to
 $1/(\unicode[STIX]{x1D6FF}^{2}S)$
, equates the growth rate
 $\unicode[STIX]{x1D6FE}_{_{\text{KH}}}$
imposed by the ideal instability. Here
 $S=(\unicode[STIX]{x1D702}/aV_{_{A,\Vert }})$
is the Lundquist number and
 $a$
is the half-width of the equilibrium vortex/current layer.
It is worth to stress that in the case of an initial uniform in-plane magnetic field, reconnection can occur only during the nonlinear phase of the KHI, when the vortices are fully rolled up, and only for sufficiently large
 $M_{A,\Vert }$
(see § 3.3 for details). Indeed, the rolling up of the magnetic lines, advected by the vortex motions generated by the KHI, is able to build-up local inversion layers where reconnection can occur. On the contrary, as already stated, a Type I VIR starts acting during the early phase in the initial, pinched current layer and does not necessitate of rolled-up vortices to develop. This fact has been confirmed adopting a collisionless fluid description where reconnection is allowed by finite electron inertia. Nakamura & Fujimoto (Reference Nakamura and Fujimoto2006) showed that a collisionless Type I VIR occurs at
 $2<M_{A,\Vert }<5$
, when the magnetic tension is high enough to inhibit the vortex rolling up, as well at
 $M_{A,\Vert }>5$
when rolling up takes place. Also in the collisionless description, the reconnection evolution (and so the growth rate) is completely overcome by the evolution of the KHI and it is independent from the value of the electron to ion mass ratio (Nakamura & Fujimoto Reference Nakamura and Fujimoto2006; Nakamura et al.
Reference Nakamura2006).
Snapshots at different times of collisionless Type I VIR in a multiple vortices configuration (Nakamura & Fujimoto Reference Nakamura and Fujimoto2008). Field lines are drawn in black, colours represent the pressure variations compared to the equilibrium value. In smaller frames white arrows describe the fluid velocity field and crosses specify the locations of X-points. Note that in this case the equilibrium flow is along the horizontal axis. The half-width of the equilibrium vortex/current layer is
 $D=2d_{i}$
and the box length is
 $=8\unicode[STIX]{x1D706}_{\text{FGM}}=8\unicode[STIX]{x1D706}_{\text{KH}}=120D$
.

When a long numerical domain is adopted, it has been shown that the pairing process between different vortices still dominates the dynamics, both for high or low magnetic tension (Pu & Fu Reference Pu and Fu1997; Nakamura & Fujimoto Reference Nakamura and Fujimoto2008; Califano et al.
Reference Califano2009). The magnetic islands, associated with different vortices, follow the same evolution and merge together, forming larger and larger islands corresponding to the new merged vortices. This evolution is shown in figure 7 (shaded coloured isocontours represent a pressure variation with respect to the equilibrium) starting from eight vortices associated with the
 $m=8$
FGM mode. Note that in the figures a single vortex corresponds to one blue structure while the yellow one represents the region in between. In particular, these structures are characterized by pressure minima inside each vortex (in blue) and pressure maxima in between (in yellow) corresponding to the hyperbolic points. During the evolution, the vortices progressively coalesce and their number decreases from eight to one (last frame). Magnetic islands follow the same evolution and coincide with the vortex structures in all frames.
A Type I VIR has important consequences on the transport properties of the system being able to create field lines connecting the two different plasmas, initially magnetically disconnected, on the left and right side of the original current/vortex layer. In this way a flux of mass across the original frontier can be established via parallel streaming of electrons/ions. We can thus infer that a mixing layer would develop inside the region occupied by vortices, and that its width grows as the vortex merging goes on. To quantify the impact of this streaming on the transport properties of the magnetopause and on the further dynamics of the vortices themselves, is not possible when adopting a fluid approach and, more than that, a 2-D geometry. This point will be discussed in the framework of a kinetic description in § 4.2. On the contrary, fluid simulations can describe the impact of magnetic reconnection on the transfer between kinetic and magnetic energy and their relaxation. In fact reconnection, locally breaking the frozen-in condition, allows the system to reach states of lower magnetic energy where the two different plasmas are no longer magnetically disconnected. These states would be forbidden by the topological constraint on the magnetic field in the case of an ideal evolution. In a single-vortex configuration, Keppens et al. (Reference Keppens1999) showed that the magnetic energy, enhanced by the KHI via the bending and compression of field lines, grows slower and saturates at a lower level when the equilibrium in-plane magnetic field is inverted, compared to a situation where it is initially unidirectional (and uniform). Indeed in the former case a Type I VIR acts even before the formation of vortices and releases the tension of bent field lines, while in the latter case reconnection can occur only in the late nonlinear phase after the rolling up of magnetic lines caused by the vortex motion has built-up local inversion layers (see § 3.3 for details).
3.3 Type II VIR configuration
In figure 1(b), we show the configuration leading to Type II VIR. In this case, the equilibrium magnetic field component parallel to the wave vector does not change sign across the vortex layer. The first nonlinear study of this configuration (Miura Reference Miura1982) neglected the out-of-plane component of the magnetic field. In this case, at least for the linear and early nonlinear phases, the behaviour of the KHI is controlled by
 $M_{A,\Vert }$
for the stabilization related to the magnetic tension, and by
 $M_{s}$
for the stabilization related to plasma compressibility (Miura Reference Miura1982). When an important out-of-plane component of the magnetic field is added, as it is in general the case at the magnetopause,
 $M_{f}$
determines the compressibility of the system. Miura (Reference Miura1982) focussed his attention on the role of the magnetic tension on the KH dynamics, neglecting all possible effects related to density or temperature variation in the equilibrium configuration. In a subsonic MHD regime, he showed that the degree of rolling up of the vortices is determined by
 $M_{A,\Vert }$
. The higher
 $M_{A,\Vert }$
, the easier it is to fold field lines, the more rolled up the vortices are. The same is true for the energy transfer from the mean flow to the magnetic part: the higher
 $M_{A,\Vert }$
, the more efficient the transfer is. Furthermore, Miura (Reference Miura1982) showed that the effective viscosity associated with the KH vortices is dominated by the Maxwell stress, contrary to the transverse case where it is dominated by the Reynolds stress (see § 3.1). In both cases the resulting momentum transfer across the frontier is large enough to explain the convection observed in the inner magnetosphere (Axford & Hines Reference Axford and Hines1961).
The nonlinear configuration created by KHI, allowing for reconnection to occur along the inversion layers located at each vortex arm (Tenerani et al.
Reference Tenerani2011). Field lines are drawn in black. Colours represent the plasma density, going from 0.7 (blue) to 1 (red), in arbitrary units. Lengths are normalized using the value of the ion skin depth on the right of the numerical box. The chosen half-width of the equilibrium velocity shear layer is
 $3\,d_{i}$
, resulting in a FGM wavelength
 $\unicode[STIX]{x1D706}_{\text{FGM}}\simeq 45\,d_{i}$

In a 2-D description the existence of an inversion layer for the in-plane magnetic field is a necessary condition for reconnection. Even starting from an uniform magnetic field, such a layer can be generated by the KH dynamics rolling up the magnetic field lines, as shown by Frank et al. (Reference Frank1996) and Min & Lee (Reference Min and Lee1996). This configuration is illustrated in figure 8 where field lines escaping from the two different left and right plasmas (typically the magnetospheric and the solar wind ones) are advected into the vortices and folded along each blue or red arm. By looking at the black isolines representing the in-plane flux function, we see that even if the vortex rolls up the two different plasmas, the left and right lines remain well connected to the left and right plasmas, respectively. Therefore, a rolled-up vortex is not an efficient structure for mixing except for the fact that the classical diffusion between adjacent arms is enhanced because of the strongest gradients with respect to the initial large-scale shear (but still not sufficiently efficient to explain the observed mixing). Nevertheless this configuration is favourable for reconnection to occur, in particular at the magnetic inversion layers created along the vortex arms.
Contrary to Type I, this kind of VIR occurs as a secondary instability during the nonlinear phase of the KHI, once the favourable conditions have been created by the fully rolled-up vortices. Type II VIR can therefore compete with the HD evolution of the vortices and lead to their partial disruption. In the unrealistic limit of a single-vortex configuration, it has been shown (Frank et al.
Reference Frank1996; Jones et al.
Reference Jones1997; Keppens et al.
Reference Keppens1999) that reconnection eventually disrupts the full vortex structure and that the system relaxes toward a laminar flow with
 $\boldsymbol{B}$
and
 $\boldsymbol{U}$
aligned. During the early nonlinear phase there is a net energy transfer from the kinetic to the magnetic energy, due to the rolling up of field lines. As soon as reconnection occurs and relaxes the tension state of the system, the magnetic energy decreases but remains greater than its initial level due to the presence of persisting flux ropes (magnetic islands) generated by reconnection.
We consider now the impact of the intensity of the in-plane magnetic field on the development of the KHI and of Type II VIR. In a single-vortex configuration, Jones et al. (Reference Jones1997) identify three different regimes: ‘strong field’, ‘weak field’ and ‘very weak field’ regime. In the first case,
 $M_{A,\Vert }<5$
, the KHI is nonlinearly stable and remains wave-like also during the saturation phase, so that Type II VIR cannot occur. In the second one,
 $5<M_{A,\Vert }<20$
, the magnetic tension cannot prevent the formation of rolled-up vortices, reconnection occurs as a secondary instability and finally completely disrupts the vortex structure. On the contrary, in the ‘very weak field’ regime,
 $20<M_{A,\Vert }<50$
, reconnection still occurs but it is unable to influence the nearly HD evolution of the vortex. It simply enhances the level of dissipation of the system eventually leading to a saturation of the vortex.
With the aim of comparing simulations and observations, Otto & Fairfield (Reference Otto and Fairfield2000) performed 2-D single-vortex simulations starting from an equilibrium configuration taken from observations. They showed that a Type II VIR is efficient, mainly along the dense, magnetosheath arms of the vortex. Flux ropes, corresponding to ‘blobs’ of magnetosheath plasma, are detached from the vortex arms and enter the magnetospheric region. Assuming that this process corresponds to a mass entry into the magnetosphere and looking at the mean entry velocity of these blobs, Nykyri & Otto (Reference Nykyri and Otto2001, Reference Nykyri and Otto2004) argued that the inferred entry rate is compatible with the one expected during northward periods (Borovsky et al. Reference Borovsky1998).
Vortex disruption and blob production in the ‘weak field’ regime have been confirmed by two-fluid simulations of single-vortex configuration (Nakamura & Fujimoto Reference Nakamura and Fujimoto2005, Reference Nakamura and Fujimoto2006) showing that Type II reconnection occurs only along the ‘same’ field lines (magnetosheath or magnetospheric ones, folded along the vortex arms). However in this way the reconnected lines do not connect plasmas of different origin and do not allow for a true mixing. At the same time the magnetosheath blobs that are injected into the magnetosphere maintain their coherence (as plasma/magnetic structures) also during the late nonlinear phase and eventually come back to their original side due to the tension of magnetospheric lines. In this way Type II VIR cannot account for mass entry into the magnetosphere. One concludes that the whole process seems to be quite robust and independent of the fluid plasma description adopted (from resistive MHD to a two-fluid description, including or not the electron mass). This fact can be surprising but actually, given the single-vortex configuration, it is not since the early dynamics is large scale (let say MHD) as compared to
 $d_{i}$
. Including the Hall term leads to a small increase of the KH growth rate (Nykyri & Otto Reference Nykyri and Otto2004) and the fact that the magnetic field is now frozen in the electron motion just decreases the importance of magnetic tension but does not alter the large-scale dynamics. Nevertheless, once thin current layers have been created, Hall and two-fluid physics could, and so do, influence the local dynamics of reconnection acting as a secondary instability on a different time scale with respect to MHD. However, reconnection proceed on a magnetic configuration that is quite stationary, that of the saturated single vortex. A faster or slower reconnection rate could simply change the characteristic time when blobs are detached and the vortex is disrupted, but not the final global evolution of the system.
This picture strongly changes (see § 3.1) if merging between vortices is allowed. This is even more important in the Type II VIR configuration where actually the dominant process is the vortex pairing and almost never vortex disruption, as shown by Baty et al. (Reference Baty2003), for all possible values of the in-plane magnetic field (we will discuss the role of density variations in § 3.3.1). In addition, it has been shown (Faganello et al. Reference Faganello2008b , Reference Faganello2009) that reconnection occurs during the merging between close vortices. It is actually driven by the pairing process instead of being driven by the vortical motion of each single vortexFootnote 8 .
(a–c) Plasma passive tracer and magnetic field lines in the
 $(x,y)$
-plane at three different times during the pairing process (
 $t=426,440,480$
) in a Type II VIR configuration (Faganello et al.
Reference Faganello2008c
). In the equilibrium configuration density and temperature profiles are constant,
 $M_{A,\Vert }=20,~M_{A,\bot }=1,~M_{s}=1$
. Lengths are normalized using
 $d_{i}$
, time using the ion cyclotron frequency. The chosen half-width of the equilibrium velocity shear layer is
 $3\,d_{i}$
, resulting in a FGM wavelength
 $\unicode[STIX]{x1D706}_{\text{FGM}}\simeq 45\,d_{i}$
. (d–f) Schematic representation of the magnetic field lines topology in the region between the two pairing vortices. The lines shown represent the local features of the field line ribbon: the two inversion layers at
 $t=426$
, reconnection acting at
 $t=440$
and the final new magnetic topology.

A zoom-in on the region between the two pairing vortices of figure 9, at
 $t=440$
. (a) Shaded isocontours of the perpendicular current density and magnetic field lines. (b) Ion decoupling region (
 $\boldsymbol{u}_{i}\times \boldsymbol{B}+\boldsymbol{E}\neq 0$
) and magnetic field lines. (c,d) Electron (c) and ion (d) decoupling region along the
 $x$
-direction at
 $y=47$
. Quantities are normalized using
 $d_{i}$
, the ion mass and cyclotron frequency. It is evident the scale separation between the ion and the electron decoupling region, leading to ‘fast’ magnetic reconnection.

In figure 9(a–c) we show the magnetic field lines and a plasma passive tracer marking the dynamics of a Type II VIR event, in the case of constant equilibrium density. The magnetosheath and magnetospheric plasmas are represented by the red and blue colours, respectively. A distinct feature of the ‘weak field’ regime is the creation of a ‘ribbon’ of compressed field lines that separates the magnetosphere (blue) and magnetopause (red) plasmas, thus representing a magnetic frontier in such a simplified 2-D description. The ribbon is rolled up more and more by the vortical motion and folded twice during the pairing process, corresponding to the creation of two magnetic inversion layers located in between the vortices. Magnetic reconnection acts first in these two layers, erodes the ribbon and changes the global topology of the full system, leading to the creation of a new, magnetic frontier. This frontier still separates the main part of the original blue and red regions, but large-scale blobs (the entire core of each vortex) have been injected in the opposite regions. In figure 9(d–f), we give a sketch of this process.
Plasma injection goes on at each pairing process without a significant return of blobs to their original region. The necessary condition for blob injection is given by the folding of the magnetic ribbon during the merging and not simply by the rolling up of the vortices. For
 $M_{A,\Vert }=5$
the last condition is fulfilled but not the first, and injection is not observed, even if pairing between vortices still proceeds. For
 $M_{A,\Vert }=10$
or larger both conditions are satisfied and injection occurs (Faganello et al.
Reference Faganello2009).
Contrary to the single-vortex configuration, when pairing is allowed, the evolution of the magnetic topology, and thus blob injection, is not independent from the adopted plasma model since the magnetic configuration, on which reconnection occurs, evolves in time: vortices move while merging and are not simply nearly stationary, saturated structures. Reconnection must be rapid enough to take advantage of the favourable conditions that are created by the large-scale motions, and that can be rapidly modified by the system itself. On this point Faganello et al. (Reference Faganello2008b
,Reference Faganello
c
) have shown that the typical width of the current layers, in between the merging vortices, is of the order of
 $d_{i}$
. In these region reconnection is Hall-dominated and proceed on a time scale not too far from the local Alfvén timeFootnote
9
. In this case reconnection is rapid enough to cut the magnetic ribbon thus changing the global topology. On the contrary, if the plasma description is oversimplified, as it is for resistive-MHD, reconnection still occurs in the same current layers but on a time scale too slow to change the global topology before these current layers are modified by the large-scale motion. In conclusion, the final magnetic topology, and so plasma transport across the original frontier, strongly depends on the correct ‘minimal’ choice for describing the plasma evolution and, in particular, reconnection. In the usual magnetospheric case, where plasma compressibility can easily create sub-
 $d_{i}$
current layers, the ‘minimal’ ingredient required beyond MHD is the Hall term.
The cases discussed before underline the importance of choosing the correct plasma model to describe the dynamics of a multi-scale problem such as the interplay between large-scale KHI and magnetic reconnection. Furthermore, blob injection and the consequent solar wind entry into the magnetosphere has been described here in a simplified 2-D geometry where all quantities are invariant along the
 $z$
-direction. In some sense we cannot determine the magnetic connectivity of the flux rope that corresponds to each plasma blob and thus we cannot state that it has been incorporated into the magnetosphere, in other words that it is connected to the Earth at both poles.
3.3.1 The role of equilibrium density variation in Type II VIR configuration
The system evolution changes when a ‘relatively strong’ density jump across the shear layer is included in the equilibrium configuration. As discussed in § 3.1 it can be responsible for the development of secondary HD instabilities, first of all the Rayleigh–Taylor instability, observed to grow along the vortex arms even when an in-plane magnetic field is present (Tenerani et al.
Reference Tenerani2011). However, the secondary instability growth is less vigorous as compared to the one observed in the transverse configuration. In fact, even in the ‘very weak field’ regime, the magnetic tension associated with the in-plane magnetic field slows down the secondary instability growth at wavelengths larger than
 $d_{i}$
and completely stabilizes the instability for smaller wavelengths. Secondary hydrodynamic instabilities still grow at moderate wavelengths but are no longer able to completely disrupt the vortices before they pair, also in the realistic case of a large density jump between the magnetosheath and the magnetosphere (
 $n_{\text{sh}}-n_{\text{sph}}=0.8\,n_{\text{sh}}$
). In this case the final configuration is a somewhat perturbed state at scales greater than
 $d_{i}$
, corresponding to density blobs created by secondary instabilities, but still exhibits the coherence of a merged vortex. Concerning the magnetic topology, the secondary instabilities pinch the magnetic inversion layers that have been created by the primary KHI along the vortex arms and finally cause reconnection there. This localized process is similar to what happens during Type I VIR: in that case the velocity perturbation of the growing KHI forces reconnection to occur in the equilibrium current layer, at the same KH time scale. In this case the secondary Rayleigh–Taylor instability forces reconnection to proceed in the local current layers corresponding to the vortex arms. As expected when reconnection is forced by an HD instability, magnetic perturbations grow at the same wavelength and at the same temporal rate as the hydrodynamic instability. In fact, the resulting magnetic islands perfectly match the perturbed density structures. In some sense, the in-plane magnetic field influences the competition between the two nearly HD processes (pairing and secondary instability) but, once the winner is determined, field lines are simply advected and reconnected as a passive tracer, at least in the ‘very weak field’ regime.
3.4 Super-magnetosonic flows
As a matter of fact, the KHI is effective also when
 $M_{f}$
is larger than one. Two peculiarities distinguish this regime with respect to the sub-magnetosonic one. First of all the mode is no longer localized at the interface as it becomes oscillatory instead of evanescent, along the
 $x$
-direction. Second, the vortices act as obstacles in a super-magnetosonic flow and thus generate shocks in the magnetospheric or magnetosheath regions, depending on the large-scale fields’ configuration. The first point can impact the energy transport from the solar wind to the magnetosphere, as an oscillatory mode can penetrate deeper inside the magnetosphere. The shock formation can impact the development of the KHI itself and that of secondary instabilities growing on the shoulder of primary vortices.
Concerning the first point, Miura (Reference Miura1990) showed that the nature of the KH mode is related to the convective Mach number in the magnetosheath/magnetosphere, defined as
 $M_{c,\text{sh/sph}}=|U_{\text{sh/sph}}-v_{\text{ph,KH}}|/c_{f,\text{sh/sph}}$
, where
 $U_{\text{sh/sph}}$
and
 $c_{f,\text{sh/sph}}$
are the flow velocity and the phase velocity of the fast magnetosonic mode along the
 $\boldsymbol{k}$
-direction in the magnetosheath or in the magnetosphere respectively. Indeed the mode turns out to be super-magnetosonic in one of the two region if the corresponding convective Mach number is greater than oneFootnote
10
. The penetration length of the mode into each domain is
 $\ell =\unicode[STIX]{x1D706}_{\text{KH}}/2\unicode[STIX]{x03C0}(1-M_{c,\text{sh/sph}}^{2})^{1/2}$
. For the magnetic configuration chosen in Miura (Reference Miura1990, Reference Miura1992), the mode penetrates into the magnetosphere and its pointing flux carries energy from the magnetosheath toward the Earth. On the other hand, even if the KH perturbation reaches more interior regions, its amplitude is strongly decreased in the super-magnetosonic regime and the energy supply finally decreases, as compared to the sub-magnetosonic regime. The same is true for the momentum transport, as the effective eddy viscosity decreases (Miura Reference Miura1992), suggesting that momentum and energy transport related to the KHI are more efficient in the dayside region of the magnetopause where the convective Mach number is usually smaller than one. After the terminator plane (day–night boundary) the draping of magnetic field lines around the magnetopause starts to accelerate the magnetosheath flow, finally leading to super-magnetosonic conditions in the far tail (Spreiter et al.
Reference Spreiter1966).
The definition of a convective Mach number, including the phase velocity of the mode, allows one to consider KH vortices as obstacles with respect to the plasma flow streaming in each of the two regions. In fact, as soon as the convective Mach number is bigger than one, a series of shocks is generated by the interaction between each KH vortex and the flow (Miura Reference Miura1992). Depending on the KH phase velocity and the plasma parameters in each region, the shocks extend deep into the magnetosheath or into the magnetosphere (Miura Reference Miura1984, Reference Miura1992; Palermo et al.
Reference Palermo2011a
). In 2-D simulation assuming
 $\boldsymbol{k}$
parallel to the flow, quasi-perpendicular shocks develop inside the magnetosphere, where the magnetic field is nearly perpendicular to the dynamical plane. In the magnetosheath region shocks can be quasi-perpendicular or quasi-parallel, depending on the relative orientation of the IMF and the flow (Miura Reference Miura1992; Lai & Lyu Reference Lai and Lyu2006; Palermo et al.
Reference Palermo2011a
).
The interaction between the structures of the shocks and the vortices can affect the KHI saturation and its late nonlinear evolution. First of all the saturated size of the vortices is determined by the convective Mach number. On one hand the flow velocity suddenly decreases across each shock and becomes sub-magnetosonic, allowing for the growth and rolling up of the vortices. For an increasing Mach number, the shock angle gets steeper and the sub-sonic area behind it gets smaller, inducing a reduction of the vortex size. On the other hand the pressure variations that develop in a faster flow are bigger and tend to push the vortex to grow. The final size of the saturated vortices is thus determined by a balance between these two opposite effects (Kobayashi et al. Reference Kobayashi2008).
Concerning the late evolution, the sharp variations associated with the shock can trigger the development of secondary instabilities at the boundary region of a vortex, as observed in Palermo et al. (Reference Palermo2011b ) and Henri et al. (Reference Henri2012).
4 Kinetic nonlinear evolution
Several different plasma models and numerical techniques have been adopted for investigating the kinetic behaviour of the KHI at the magnetopause. In all cases ions, whose Larmor radius is comparable with the characteristic width of the velocity shear layer, are described using the Vlasov equation
 $$\begin{eqnarray}\unicode[STIX]{x2202}_{t}f_{i}+\boldsymbol{v}_{i}\boldsymbol{\cdot }\unicode[STIX]{x1D735}f_{i}+\frac{e}{m_{i}}\left(\boldsymbol{E}+\frac{\boldsymbol{v}_{i}}{c}\times \boldsymbol{B}\right)\boldsymbol{\cdot }\unicode[STIX]{x1D735}_{\boldsymbol{v}_{i}}f_{i}=0,\end{eqnarray}$$
where
 $f_{i}$
is the ion (proton) distribution function,
 $\boldsymbol{v}_{i}$
the ion velocity and
 $\unicode[STIX]{x1D735}_{\boldsymbol{v}_{i}}$
the gradient with respect to the velocity variable. The KH dynamics in the transverse configuration has been explored by adopting an hybrid fluid–kinetic model or a full kinetic one. In the first case the dynamics of the electrons is described by imposing quasi-neutrality and adopting a massless fluid description (Terasawa et al.
Reference Terasawa1992; Thomas & Winske Reference Thomas and Winske1993; Fujimoto & Terasawa Reference Fujimoto and Terasawa1994, Reference Fujimoto and Terasawa1995; Cowee et al.
Reference Cowee2009, Reference Cowee2010). This is equivalent to imposing a generalized Ohm’s law (3.3) to obtain the electric field. In the full kinetic case, electrons too are described by the Vlasov equation and the electric field is obtained by inversing the Poisson equation where the charge density is given by the ion and electron densities, the zeroth-order momenta of the two distribution functions (Pritchett & Coroniti Reference Pritchett and Coroniti1984; Cai et al.
Reference Cai1993b
; Wilber & Winglee Reference Wilber and Winglee1995; Matsumoto & Hoshino Reference Matsumoto and Hoshino2006; Matsumoto & Seki Reference Matsumoto and Seki2010; Nakamura et al.
Reference Nakamura2010; Umeda et al.
Reference Umeda2010, Reference Umeda2014). All these studies adopt a reduced phase space limiting the dynamics to a 2-D physical space
 $(x,y)$
and to a 2-D velocity space
 $(v_{i/e,x},v_{i/e,y})$
. As for the fluid transverse case, this simplified 2D2V description is limited to a dynamics where the magnetic field perturbation stays parallel to the out-of-plane guide fieldFootnote
11
. In some sense these models switch off the magnetic in-plane dynamics and so the possibility of reconnection and the streaming of particles along field lines. The main advantage, in addition to a huge reduction of the computational cost, is to isolate the impact of FLR effects on the KH development and to investigate particle mixing due to the entirely anomalous perpendicular diffusion generated by the vortices. The large ratio between the ion and the electron Larmor radii justifies the adoption of an hybrid model, treating the ions kinetically and the electrons as a fluid.
On the contrary, in Type I or Type II configurations, a 3V description in the velocity space is mandatory in order to describe the dynamics of the
 $z$
-component of the current density. At the same time a full kinetic treatment for the electrons is necessary to describe the particle streaming along field lines, in particular when reconnection changes their connectivity. Recently 2D3V and 3D3V full kinetic simulations have been performed by Nakamura et al. (Reference Nakamura2011, Reference Nakamura2013), Henri et al. (Reference Henri2013) and Nakamura & Daugthon (Reference Nakamura and Daughton2014).
Usually the Vlasov equation (4.1) (and the corresponding electron one) is integrated using a particle in cell (PIC) method, where the distribution function is parametrized by a discrete set of weighted macro-particles. Each macro-particle is evolved in time by a set of equations formally equivalent to those describing the motion of a single particle. A different numerical approach was used by Umeda et al. (Reference Umeda2010, Reference Umeda2014) adopting a semi-Lagrangian ‘Vlasov’ code that advances in time the distribution function. Although more affected by numerical noise, the PIC method is much less expensive from a computational point of view and has the main advantage of tracking in time the position and the energy of macro-particles. This means that evaluating the amount of mixing between different populations, having different initial origin or energy, is relatively simple.
4.1 Transverse configuration
In spite of the fact that the transverse configuration is the simplest possible one, it shows up the difficulty of a kinetic treatment of plasmas in systems that are not homogeneous. Even the initial equilibrium configuration describing the shear layer is a source of problems since the shifted Maxwellian usually adopted to describe the sheared mean velocity of a population of particles at a given temperature and density is far from being a kinetic equilibrium. Simply imposing a balance between the thermal pressure and the magnetic one (or even taking uniform pressure, density and magnetic field), as in the case of a one-dimensional fluid equilibrium, does not guarantee the stationarity of the configuration leading to a quick relaxation of the initial configuration over a few cyclotron periods
 $\unicode[STIX]{x1D6FA}_{i}^{-1}$
, a time scale far shorter as compared to the KH one (Pritchett & Coroniti Reference Pritchett and Coroniti1984; Nakamura et al.
Reference Nakamura2010; Cerri et al.
Reference Cerri2013). The smaller the ratio
 $a/\unicode[STIX]{x1D70C}_{i}$
, the more important the relaxation. However the modification of the initial velocity profile is not dramatic in the presence of a guide field, as typically observed in the magnetospheric case. Starting from a typical shear layer (e.g. a hyperbolic tangent profile for the mean velocity
 $U(x)\hat{\boldsymbol{y}}$
) the relaxed one still has a similar shape and asymptotic values for all plasma quantities. The new profile is unstable against KHI and thus suitable for looking at its linear and nonlinear development.
In the case of
 $\unicode[STIX]{x1D734}\boldsymbol{\cdot }\boldsymbol{B}>0$
the modifications of the initial shear layer are minimal, while for
 $\unicode[STIX]{x1D734}\boldsymbol{\cdot }\boldsymbol{B}<0$
Nakamura et al. (Reference Nakamura2010) and Henri et al. (Reference Henri2013) have shown that an important broadening of the layer can be generated by the self-reorganization of the system. This fact impacts the study of the kinetic KHI as from fluid theory we know that the nearly MHD dynamics of large-scale vortices strongly depends on the layer half-width
 $a$
. According to MHD theory the linear growth rate of the instability is inversely proportional to
 $a$
and the FGM wavelength is proportional to it, as well as the size of vortices and their
 $e$
-folding time. Furthermore the relaxation of the initial configuration does not lead towards a Vlasov equilibrium: undamped oscillations of the order of 5–10 % of the mean values are generated at the layer (Nakamura et al.
Reference Nakamura2010; Cerri et al.
Reference Cerri2013). These oscillations, as well as the layer broadening, can significantly affect the KH development and some of the results that one can find in the literature must be managed with care. For example, the results obtained by Pritchett & Coroniti (Reference Pritchett and Coroniti1984) and Cai et al. (Reference Cai1993b
) differ as
 $a/\unicode[STIX]{x1D70C}_{i}$
is close to oneFootnote
12
: in the first case the value of the normalized growth rate drops as compared to the MHD one, while in the second case it does not. Although not discussed in these papers, this discrepancy could be explained by looking at how the simulations are initialized. Pritchett & Coroniti (Reference Pritchett and Coroniti1984) started from a fluid-like equilibrium, whose relaxation is likely the cause of the instability suppression. On the contrary, Cai et al. (Reference Cai1993b
) loaded macro-particles close to a Vlasov equilibrium (Cai et al.
Reference Cai1990, Reference Cai1993a
), so that the initial configuration does not relax, and the observed KH dynamics is correctly described.
The fact that the KHI develops at the ‘usual’ MHD rate also for
 $a\lesssim \unicode[STIX]{x1D70C}_{i}$
indicates that the influence of FLR effects on the instability development is small, at least when the ion density is uniform, i.e. when the ion diamagnetic velocity is zero. This fluid-like behaviour of the kinetic KHI in the transverse, uniform configuration at
 $a\lesssim \unicode[STIX]{x1D70C}_{i}$
has been confirmed recently by Nakamura et al. (Reference Nakamura2010). In particular figure 11(a,b), shows the growth rate versus the wave vector, in normalized units, obtained in their PIC simulations. The usual bell-shaped profiles show a decrease of the maximum value and a net shift toward smaller
 $k$
-values, as the initial half-width
 $a$
of the shear layer decreases (note that in figure 11, the half-width
 $a$
is named
 $D_{0}$
). This modification of the dispersion relation is due to the rapid relaxation of the initial configuration, far from a kinetic equilibrium, and it is more pronounced for
 $\unicode[STIX]{x1D734}\boldsymbol{\cdot }\boldsymbol{B}<0$
. In fact, once the layer has relaxed and its width has increased to a value
 $D^{\prime }>\unicode[STIX]{x1D70C}_{i}$
, the kinetic KHI grows on this new relaxed profile in a way that is similar to the usual MHD one, as shown in figure 11, bottom line. Here the growth rate and the wave vector are normalized using the relaxed half-width of the shear layer
 $D^{\prime }$
. Since
 $D^{\prime }>\unicode[STIX]{x1D70C}_{i}$
it is not surprising to recover the usual MHD results. As a matter of fact the impact of the layer broadening on the linear phase completely masks any kind of FLR effects that could modify the KHI evolution.
(a,c) Normalized growth rate versus the normalized wave vector, in the case of positive field-aligned vorticity (FAV), i.e.
 $\unicode[STIX]{x1D734}\boldsymbol{\cdot }\boldsymbol{B}>0$
, as obtained in PIC simulations of the transverse configuration (Nakamura et al.
Reference Nakamura2010). (b,d) As before but in the case of negative FAV, i.e.
 $\unicode[STIX]{x1D734}\boldsymbol{\cdot }\boldsymbol{B}<0$
. Physical quantities are normalized using the asymptotic value of the initial velocity
 $V_{0}$
and the half-width
 $D_{0}$
of the velocity shear layer at the beginning of the simulation (a,b), or the value
 $D^{\prime }$
corresponding to the relaxed layer (c,d). In this case
 $\unicode[STIX]{x1D706}_{i}$
corresponds to the ion skin depth and it is equal to
 $2\unicode[STIX]{x1D70C}_{i}$
.

Despite the fact that the quasi-equilibria were proposed by Cai et al. (Reference Cai1990) a long time ago, they have been rarely adopted in the literature. For sure a shifted Maxwellian is by far more manageable leaving a lot of freedom in the choice of the large-scale profiles (density, velocity, temperature and magnetic field) but the results obtained starting from this configuration can be misleading. In particular, when investigating the possible Dawn/Dusk asymmetry of the KH dynamics we can expect that results obtained starting from a shifted Maxwellian (Wilber & Winglee Reference Wilber and Winglee1995; Umeda et al.
Reference Umeda2014) are affected by the relaxation of the initial profile because this relaxation depends on the sign of
 $\unicode[STIX]{x1D734}\boldsymbol{\cdot }\boldsymbol{B}$
. On the contrary we could expect that starting from a quasi-equilibrium should be conclusive. This is true concerning the KH stability when
 $a/\unicode[STIX]{x1D70C}_{i}$
goes to one, as shown by the results of Cai et al. (Reference Cai1993b
) where a vigorous growth of the instability without any kind of relaxation of the initial quasi-equilibrium is observed. Nevertheless these results are not conclusive regarding the Dawn/Dusk asymmetry as the peculiar choice of the quasi-equilibria adopted for
 $\unicode[STIX]{x1D734}\boldsymbol{\cdot }\boldsymbol{B}\gtrless 0$
can influence the precise value of the growth rate in the two different cases. As Cai et al. (Reference Cai1993b
) pointed out, their quasi-equilibrium mass densities for the two cases are slightly different: when considering the
 $\unicode[STIX]{x1D734}\boldsymbol{\cdot }\boldsymbol{B}>0$
shear layer, the negative charge density, giving rise to the convective electric field, is obtained by a lack of electrons in the layer and thus the mass density is nearly uniform. On the contrary, in the
 $\unicode[STIX]{x1D734}\boldsymbol{\cdot }\boldsymbol{B}<0$
case, the positive charge is obtained by an excess of ions, i.e. a density bump at the layer position, that could be the responsible for the slightly smaller growth rate observed in this case.
Kinetic simulations can give important information on the KH dynamics, at least from a qualitative point of view. As expected for
 $a>\unicode[STIX]{x1D70C}_{i}$
, kinetic simulations do confirm the fluid results presented in § 3.1, but giving the possibility of describing the mixing between the two different populations of plasma. It has been confirmed that, when the initial plasma density is uniform, the pairing process completely dominates the nonlinear dynamics leading to the formation of bigger and bigger vortices. This is true in both kinds of kinetic simulations initialized close to (Thomas & Winske Reference Thomas and Winske1993; Cai et al.
Reference Cai1993b
) or relatively far (Pritchett & Coroniti Reference Pritchett and Coroniti1984; Fujimoto & Terasawa Reference Fujimoto and Terasawa1994) from a Vlasov equilibrium. When a density jump across the shear layer is included, Matsumoto & Hoshino (Reference Matsumoto and Hoshino2006), Umeda et al. (Reference Umeda2010, Reference Umeda2014) confirmed that secondary Rayleigh–Taylor instability acts along the frontier between the dense and tenuous plasmas folded in two consecutive arms of a vortex and lead to vortex disruption. Looking at the competition between pairing and vortex disruption Cowee et al. (Reference Cowee2009) and Matsumoto & Seki (Reference Matsumoto and Seki2010) showed that, in the case of a large density jump, secondary Rayleigh–Taylor instability leads to the development of a turbulent mixing layer, as in the case in the fluid description.
Concerning plasma mixing, PIC codes provide an easy way for tracking in time and space the position of macro-particles, by using two different labels corresponding to the two different plasmas lying on the two opposite sides of the original frontier. It is thus possible to define a numerical cell as ‘mixed’ if the fraction of both populations exceeds a given value, say 25 % (Terasawa et al.
Reference Terasawa1992). In a single-vortex configuration we could imagine that particles mix, at least in a layer of width
 ${\sim}\unicode[STIX]{x1D70C}_{i}$
across the original frontier, simply by their gyromotion. This process would provide, as a lower boundary, a number of mixing cells that grows linearly in time because the original frontier is folded by the vortex and its length grows in time proportionally to the angular frequency of the vortical motion. This simple picture works quite well during the early development of vortices and when vortex pairing goes on (Thomas & Winske Reference Thomas and Winske1993). On the contrary, once the pairing stops the mixing process changes behaviour (Thomas & Winske Reference Thomas and Winske1993). This final configuration corresponds to the saturation phase of a single vortex for which Terasawa et al. (Reference Terasawa1992) distinguished two regimes: the early saturated one and the late saturated one. During the early saturation phase most of the mixing occurs close to the hyperbolic point of the KH vortex. Around this stagnation X-point of the mean velocity macro-particle orbits bifurcate. Macro-particles behave as test particles in a fluid system: initially close particles follow laminar streamlines that diverge at the X-point. During this process the number of mixed cells grows in time as
 $t^{2}$
up to the late saturation phase, when mixed cells fill the whole region occupied by the vortex (Fujimoto & Terasawa Reference Fujimoto and Terasawa1994). After this point, during the late saturation phase of the KHI, the mixing becomes mainly diffusive and the temporal rate goes as
 $t^{1/2}$
(Terasawa et al.
Reference Terasawa1992).
When a density jump is included in the initial configuration, the picture becomes more complex. On the one hand secondary Rayleigh–Taylor instability can strongly enhance the mixing process, in particular at the boundary of a single vortex (Matsumoto & Hoshino Reference Matsumoto and Hoshino2006). On the other hand, when vortex pairing can occur in the simulation box the mixing process follows two different evolutions depending on the ratio between the magnetospheric and magnetosheath densities. By looking at the temporal evolution of the total area of the mixed cells shown in figure 12(a), Cowee et al. (Reference Cowee2009) pointed out that its evolution is independent from the density ratio value up to the time when the merging process starts (corresponding to
 $\unicode[STIX]{x1D6FA}_{i}t\simeq 300$
in figure 12
a). At this point the mixed area increases far more in the uniform case. Indeed when the secondary Rayleigh–Taylor instability is able to completely destroy the vortices (large density jump), the growth of the mixed area is far smaller and this area is confined to the region occupied by the FGM vortices. In other words, in the first case the mixing occurs inside structures whose width, along the inhomogeneous
 $x$
-direction, grows in time as vortex pairing goes on, while in the latter the size of the mixing area is set by the width of the saturated FGM.
(a) Temporal evolution of the normalized area of mixed cells, for different ratios between the magnetosheath number density
 $n_{s}$
and the magnetospheric one
 $n_{m}$
, as obtained by Cowee et al. (Reference Cowee2009) in PIC simulations of the transverse configuration. (b,c) The probability density function of macro-particle displacement
 $\unicode[STIX]{x0394}x=x-x_{t=0}$
along the inhomogeneous
 $x$
-direction, for
 $n_{s}/n_{m}=1$
and
 $n_{s}/n_{m}=10$
. The initial position of the particle
 $x_{t=0}$
is taken into the magnetosheath, in particular
 $x_{t=0}\in [-30a,0]$
, where
 $x=0$
is the centre of the shear layer and
 $a=d_{i}$
is its half-width.

Cowee et al. (Reference Cowee2009, Reference Cowee2010) investigated the nature of the mixing process looking at the probability density function (PDF) of the macro-particle displacement
 $\unicode[STIX]{x0394}x=x-x_{t=0}$
along the inhomogeneous
 $x$
-direction, where
 $x_{t=0}$
is the macro-particle position at
 $t=0$
. Due to the non-Gaussian shape of the PDF (see figure 12
b) and to its square mean displacement growing as
 $\langle \unicode[STIX]{x0394}x\rangle ^{2}\propto t^{\unicode[STIX]{x1D6FC}}$
with
 $\unicode[STIX]{x1D6FC}\sim 2$
, they invoke a super-diffusive mixing process in the uniform density case. On this point it must be noted that defining the displacement as
 $\unicode[STIX]{x0394}x=x-x_{t=0}$
, thus including the large scale and large amplitude contributions of the vortex motion, is misleading. In fact the vortical motion generates large values of
 $\langle \unicode[STIX]{x0394}x\rangle ^{2}$
(roughly equal to the square of the radius of the vortices) even if particles stay on their original side of the magnetic frontier. By looking at the PDF of the magnetosheath ion displacement (figure 12
b) one recognizes a main peak at
 $x=0$
that corresponds to the original macro-particle position, and a secondary peak that is simply created by the large-scale vortical motion. This last corresponds to the location of the dense arm of the rolled-up vortex. The width of the PDF is thus set by the large-scale motion and is not related to the actual mixing. In order to correctly measure the mixing length, i.e. the average displacement with respect to the magnetic frontier, folded by the vortical motion, the large-scale motion should be subtracted from
 $\unicode[STIX]{x0394}x$
before performing the PDF analysis.
4.1.1 Details of the initial relaxation
When simulations are initialized by a Maxwellian distribution function for the particles, representing a mean velocity
 $U(x)\hat{\boldsymbol{y}}$
, the broadening of the velocity shear layer depends on the sign of the initial
 $\unicode[STIX]{x1D734}\boldsymbol{\cdot }\boldsymbol{B}$
. In the transverse configuration Nakamura et al. (Reference Nakamura2010) pointed out that this broadening is related to the ion gyromotion and that the final width of the shear layer must be, at least, greater than the orbit excursion
 $2\unicode[STIX]{x1D70C}^{\prime }$
along
 $\hat{\boldsymbol{x}}$
, where
 $\unicode[STIX]{x1D70C}^{\prime }=\unicode[STIX]{x1D70C}_{i}(1-\unicode[STIX]{x1D734}\boldsymbol{\cdot }\boldsymbol{B}/(\unicode[STIX]{x1D6FA}_{i}|\boldsymbol{B}|))=\unicode[STIX]{x1D70C}_{i}(1-\unicode[STIX]{x2202}_{x}U/\unicode[STIX]{x1D6FA}_{i})$
includes the effects of the convective electric field
 $-\boldsymbol{U}/c\times \boldsymbol{B}$
at the layer position.
This condition is more stringent when
 $\unicode[STIX]{x1D734}$
and
 $\boldsymbol{B}$
are antiparallel, leading to a more pronounced relaxation of the initial layer for
 $\unicode[STIX]{x1D734}\boldsymbol{\cdot }\boldsymbol{B}<0$
. As discussed before, this relaxation strongly impacts the KH evolution simply because the linear growth rate is inversely proportional to the relaxed value of
 $a$
, and the FGM wavelength that is proportional to it. With the aid of figure 11 Nakamura et al. (Reference Nakamura2010) have shown that the impact of the layer broadening on the fluid-like linear phase completely masks any kind of FLR effect that could modify the kinetic KHI, at least in the uniform density case. Similar results have been obtained by Cerri et al. (Reference Cerri2013) and Henri et al. (Reference Henri2013), also including a small but finite component of the magnetic field along the flow direction, of the order of
 $0.05|\boldsymbol{B}|$
.
It is important to notice that the modified radius
 $\unicode[STIX]{x1D70C}^{\prime }=\unicode[STIX]{x1D70C}_{i}(1-\unicode[STIX]{x2202}_{x}U/\unicode[STIX]{x1D6FA}_{i})$
exactly corresponds to the modified temperature
 $T^{\prime }=T/\sqrt{1+\unicode[STIX]{x2202}_{x}U/\unicode[STIX]{x1D6FA}_{i}}$
, obtained by Ganguli et al. (Reference Ganguli1988) when a Vlasov equilibrium is calculated up to first-order corrections in the small parameter
 $\unicode[STIX]{x1D70C}_{i}/a$
. This modified temperature can be adopted for electrons, for which
 $\unicode[STIX]{x1D70C}_{e}/a$
is small, but can hardly describe the ion equilibrium as
 $\unicode[STIX]{x1D70C}_{i}/a=O(1)$
. On this point numerical simulations (Nakamura et al.
Reference Nakamura2010; Cerri et al.
Reference Cerri2013; Henri et al.
Reference Henri2013) have shown that during the initial relaxation the ion temperature tensor becomes agyrotropic, i.e. the two diagonal terms corresponding to the two direction perpendicular to the magnetic field differ. By including the ion gyroviscosity in a fluid framework, Cerri et al. (Reference Cerri2013) have shown that the magnetized isotropic system is forced to be agyrotropic as soon as a velocity shear layer is considered with a typical ‘reaction’ time of the order of
 $\unicode[STIX]{x1D6FA}_{i}^{-1}$
, as confirmed by numerical simulations (Nakamura et al.
Reference Nakamura2010; Cerri et al.
Reference Cerri2013; Henri et al.
Reference Henri2013).
As stated before, the relaxation of the initial configuration does not lead toward a new Vlasov equilibrium but to a regime of undamped oscillations around a mean value of all fields. The amplitude of these oscillations can reach up to 10 % of the mean value and affect the KH evolution. Two possible solutions for facing this problem can be envisaged. In the first one, as proposed by Cai et al. (Reference Cai1990), the idea is to load macro-particles in a PIC code in a state close to a Vlasov equilibrium. In the second one, the idea is to make use of the analytical FLR-equilibria developed by Cerri et al. (Reference Cerri2013, Reference Cerri2014) in a fluid framework (including ion gyroviscosity) that can be implemented in PIC as well as in Vlasov codes, strongly reducing the level of the amplitude of the oscillations to less than 1 %. In figure 13 we show the time evolution of the diagonal terms of the pressure tensor as obtained by a Vlasov code that is initialized using a shifted Maxwellian corresponding to a simple MHD equilibrium (a,c,e), or corresponding to the FLR one (b,d,f). In both cases the profiles oscillate around the same value, which corresponds to the FLR equilibrium, but the amplitude of the oscillations is strongly reduced in the second case. Note that the FLR equilibria give to one a lot of freedom in choosing the ‘macroscopic’ profiles of the main fields. Furthermore these equilibria are, by construction, stable against magneto-elastic instabilities that could occur in the case of
 $\unicode[STIX]{x1D6FA}_{i}+\unicode[STIX]{x1D734}\boldsymbol{\cdot }\boldsymbol{B}/|\boldsymbol{B}|<0$
(Del Sarto et al.
Reference Del Sarto2016).
Temporal evolution of the diagonal terms of the ion pressure tensor during the relaxation of the initial configuration, as obtained using a 1D2V Vlasov code (Cerri et al.
Reference Cerri2013). (a,c,e) Simulation is initialized using a shifted Maxwellian corresponding to a double shear layer (with
 $\unicode[STIX]{x1D734}\boldsymbol{\cdot }\boldsymbol{B}>0$
at
 $x=5\unicode[STIX]{x03C0}$
,
 $\unicode[STIX]{x1D734}\boldsymbol{\cdot }\boldsymbol{B}<0$
at
 $x=15\unicode[STIX]{x03C0}$
and
 $a=\unicode[STIX]{x1D70C}_{i}=1$
) and has a uniform isotropic pressure corresponding to a MHD equilibrium. (b,d,f) Same shear layer is simulated but the shifted Maxwellian provides an agyrotropic pressure corresponding to the FLR equilibrium. Black lines show the profiles at different times for
 $0<\unicode[STIX]{x1D6FA}_{i}t<30$
, the mean profiles are drawn in green and the ones corresponding to the FLR equilibrium are in red.

4.2 Type I VIR configuration
Two-dimensional PIC simulations (Nakamura et al.
Reference Nakamura2011) of Type I VIR confirm the main results obtained by fluid analysis, first of all the ability of the KHI to compress the initial current layer close to the hyperbolic point down to the electron scale
 $d_{e}$
at which reconnection occurs. At this point reconnection starts and operates at a rate driven by the KH dynamics and that can be greater than the ‘spontaneous’ collisionless rate of Hall-dominated reconnection in the absence of a velocity shear layer (Shay et al.
Reference Shay1998; Birn et al.
Reference Birn2001; Uzdensky & Kulsrud Reference Uzdensky and Kulsrud2006; Vekstein & Bian Reference Vekstein and Bian2006; Bian & Vekstein Reference Bian and Vekstein2007a
). Indeed the inflow at the hyperbolic point saturates at a value that is determined by the KHI only and that is roughly equal to
 $0.05V_{0}=0.05M_{A,\Vert }V_{A,\Vert }$
, where
 $V_{0}/2$
and
 $V_{A,\Vert }$
are the asymptotic fluid and Alfvén velocities. At the same time the reconnecting in-plane magnetic field close to the current layer reaches a value approximately 0.8 times the asymptotic one
 $B_{\Vert }$
. This gives a rate at which the magnetic flux is reconnected that scales as
 $0.04M_{A,\Vert }V_{A,\Vert }B_{\Vert }$
. It depends on the Alfvénic Mach number and is greater than the ‘spontaneous’ value, provided
 $M_{A,\Vert }>5$
.
The impact of the kinetic dynamics on the KHI does not change its qualitative fluid evolution. The main differences between kinetic and fluid simulations are the peculiar value of the growth rate and the number of X-points forming inside the current layer. Ion FLR effects allow reconnection to set-up a little bit earlier in kinetic simulations, as compared to fluid ones. The late start of reconnection in the fluid case causes a local enhancement of the in-plane magnetic field and of the magnetic pressure at the current layer position. Indeed magnetic field lines, advected by the inflow imposed by the growing KHI, pile up on the two sides of the original current layer increasing the magnetic field magnitude. The first consequence is a slightly larger value of the reconnection growth rate, as it scales as the local value of the in-plane magnetic field. The second consequence is a local increase of the magnetic pressure that contrasts the compression of the current layer, whose final width is larger as compared to the kinetic case. Thus the wavelength of the tearing mode (proportional to the layer width) that develops in fluid simulations is longer than the layer extension along the direction defined by the reconnecting in-plane magnetic field. In such a way only one X-point develops at the hyperbolic point. On the contrary, in kinetic simulations the tearing wavelength is smaller, due to the thinner layer, and several X-points develop inside the current layer. Eventually, in kinetic simulations, one X-point becomes dominant and the reconnection outflows produced there advect the small magnetic islands far away. These islands collides with the large-scale magnetic islands corresponding to the vortex bodies and are incorporated there via re-reconnection (as for magnetic islands coalescence (Biskamp & Schindler Reference Biskamp and Schindler1971)). In the late stage we recover the same configuration as observed in fluid simulations where a single X-point exists and where each vortex corresponds to a large-scale magnetic island.
Concerning the plasma mixing, in particular that of electrons, it is dominated by their rapid motion along field lines. As soon as reconnection occurs, magnetic field lines start to link plasma volumes that were previously unconnected, on the left and on the right of the original frontier. At this stage electrons, owing to the two different volumes, can quickly mix thanks to their fast streaming along field lines. This process occurs during the development of multiple X-points inside the compressed current layer, as well as during the entry of islands into the vortex body via re-reconnection, and finally causes a large part of the vortex area to be filled with mixed cells. Moreover electrons can be accelerated along field lines by the parallel electric field that develops at the reconnection sites. These two processes coexist and produce mixing and heating of the two different electrons populations (Nakamura et al. Reference Nakamura2011).
Three-dimensional PIC simulation of Type I VIR configuration (Nakamura et al.
Reference Nakamura2013). (a) Contours in the
 $(x,y)$
-plane of the absolute value
 $|\boldsymbol{J}|$
of the current density, in terms of its maximum value
 $J_{0}$
in the initial current layer. Magnetic field lines are drawn in yellow and show four different flux ropes. The average direction of two given flux ropes is indicated by black dotted lines. (b) The vortex surface coloured according to the
 $B_{y}$
component, given in terms of the asymptotic initial value of the in-plane magnetic field. This time the magnetic field lines (in yellow) show the orientation of the magnetic field on the two sides of the current layer that is located at the periphery of the vortex, at the place where oblique flux tubes exist. Black dotted lines clearly show their mean directions. Note that in this case the initial flow is along the
 $x$
-direction.

The most important change in the system dynamics, as compared to the 2-D fluid evolution presented in § 3.2, is not due to kinetic effects but by relaxing the 2-D assumption
 $\unicode[STIX]{x2202}_{z}=0$
. If the linear and early nonlinear phases are similar to the 2-D evolution, once reconnection starts to act the dynamics becomes different. Indeed in the 3-D case the resonant condition
 $\boldsymbol{k}\boldsymbol{\cdot }\boldsymbol{B}=0$
for the development of magnetic reconnection can be satisfied also far away from the inversion layer of the magnetic field component lying in the dynamical plane of 2-D simulations. Here
 $\boldsymbol{k}$
and
 $\boldsymbol{B}$
are the local wave vector of an Alfvénic perturbation and the local magnetic field. With the aid of 3D3V PIC simulations Nakamura et al. (Reference Nakamura2013) showed that ‘transverse’ flux ropes (the 3-D structures corresponding to the 2-D magnetic islands we have discussed) develop at the compressed current layer with a mean field line orientation that is exactly perpendicular to the
 $(x,y)$
-plane, corresponding to a
 $\boldsymbol{k}$
lying in that plane. In this case the resonant condition is satisfied because the magnetic field at the centre of the layer is exactly aligned with the
 $z$
-direction. At the same time they pointed out the development of oblique flux ropes along the boundaries of the KH vortex, where current layers exist but where the projection of the magnetic field on the
 $(x,y)$
-plane is different from zero. In this case reconnection occurs with a
 $\boldsymbol{k}$
that has a finite
 $z$
-component (up to
 $1/10$
of its
 $x/y$
-component) and that is exactly perpendicular to the magnetic field at the layer centre. Figure 14(a), shows transverse flux ropes developing with a mean angle
 $\unicode[STIX]{x1D6E9}_{\text{rope}}\simeq 0^{\circ }$
with respect to the
 $z$
-direction, and oblique flux ropes with an angle
 $\unicode[STIX]{x1D6E9}_{\text{rope}}\simeq 10^{\circ }$
. In (b), magnetic field lines on the left and on the right of the current layer are drawn, close to the location where the oblique flux ropes are. It is possible to see that the magnetic field changes its direction crossing the current layer and that its angle, with respect to the
 $z$
-direction, passes from
 $\unicode[STIX]{x1D6E9}_{B}\simeq 0^{\circ }$
just inside the vortex to
 $\unicode[STIX]{x1D6E9}_{B}\simeq 20^{\circ }$
just outside. As a consequence flux ropes develop there with
 $\unicode[STIX]{x1D6E9}_{\text{rope}}\simeq 10^{\circ }$
, the average angle corresponding to the orientation of
 $\boldsymbol{B}$
at the centre of the layer, i.e. the orientation of the local guide field.
These oblique flux ropes are not single events, as indicated by the energy ratio between them and the transverse flux ropes that is approximately equal to one. In producing flux ropes, reconnection evacuates and converts magnetic energy that grows because of the current layer compression and the rolling up of field lines, into kinetic and thermal energies. The possibility that reconnection occurs with an oblique wave vector increases the energy evacuation, as shown by comparing 2-D and 3-D simulations (Nakamura et al. Reference Nakamura2013).
Three-dimensional PIC simulation of Type I VIR configuration, including a density jump across the initial shear layer (Nakamura & Daugthon Reference Nakamura and Daughton2014). (a) Colour contours of the electron mixing rate
 $F_{e}=(n_{e,\text{sh}}-n_{e,\text{sph}})/n_{e}$
in the
 $(x,y)$
-plane at
 $z=0$
. The shaded grey surface corresponds to the value
 $F_{e}=0.05$
and shows the boundary of the vortices where strong velocity and density gradients have been built up by the large-scale motion. (b): colour map of the electron mixing rate in the
 $(x,z)$
-plane at
 $y=0.23\unicode[STIX]{x1D706}_{\text{KH}}$
, the same translucent dark plane drawn in frame (a). Black dotted lines underline the oblique direction at which secondary instabilities develop. The angular values correspond, at the same time, to the angles between dotted lines and the
 $z$
-direction and between the local wave vectors
 $\boldsymbol{k}$
and the
 $(x,y)$
-plane. (c) Top frame: power spectrum of the
 $y$
-component of the fluid ion velocity (averaged along the
 $y$
-direction in the volume delimited by
 $y=(0.23\pm 0.10)\unicode[STIX]{x1D706}_{\text{KH}}$
. It is plotted in the
 $(k_{x},k_{z})$
-plane. (c) Bottom frame: the same power spectrum integrated with respect to
 $k_{z}$
. Lengths are given in terms of the ion skin depth
 $d_{i}$
, with
 $\unicode[STIX]{x1D706}_{\text{KH}}=15d_{i}$
and
 $\unicode[STIX]{x1D6FC}=V_{0}/\unicode[STIX]{x1D706}_{\text{KH}}$
, where
 $V_{0}/2$
is the initial asymptotic value of the fluid velocity. Note that in this case the initial flow is along the
 $x$
-direction.

Once the density jump between the magnetosphere and the magnetosheath is included in the initial configuration, particle mixing exhibits two different stages (Nakamura & Daugthon Reference Nakamura and Daughton2014). In the early nonlinear phase Type I VIR reconnection occurs in the compressed current layer, as for simulations with uniform density. This fact causes a rapid mixing of the two different plasma populations inside the vortices, thanks to their rapid motion along reconnected field lines. Nevertheless strong density and velocity gradients still exist at the boundaries between the vortices and the surrounding regions. In such a way secondary KH and Rayleigh–Taylor instabilities develop there during the late nonlinear phase and strongly perturb the vortex structures.
Kinetic effects weakly affect the fluid-like evolution of these instabilities. On the contrary, once the initial magnetic field has a non-null component along the flow direction (as in the Type I VIR configuration), a 3-D description becomes crucial for catching their growth. Indeed fluid and kinetic 2-D simulations stressed the role of magnetic tension in stabilizing secondary KH and Rayleigh–Taylor instabilities. The stabilizing term, proportional to
 $\boldsymbol{k}\boldsymbol{\cdot }\boldsymbol{B}$
, is different from zero because
 $\boldsymbol{k}$
is forced to lie in the
 $(x,y)$
-plane. Here
 $\boldsymbol{k}$
is the local wave vector of secondary modes. Depending on the intensity of the flow-aligned component of the magnetic field the stabilization can be partial (Tenerani et al.
Reference Tenerani2011) or total (Cowee et al.
Reference Cowee2010). On the contrary, when a 3-D dynamics is considered (Nakamura & Daugthon Reference Nakamura and Daughton2014),
 $\boldsymbol{k}$
can have an out-of-plane component in order to get
 $\boldsymbol{k}\boldsymbol{\cdot }\boldsymbol{B}=0$
even if
 $\boldsymbol{B}$
is not strictly aligned with the
 $z$
-direction. In this case secondary instabilities can effectively grow as oblique modes, as shown in figure 15. For the specific parameters chosen in this 3-D simulation, the averaged angle between the local wave vector
 $k$
and the
 $(x,y)$
-plane is given by
 $\unicode[STIX]{x1D6E9}_{k}=17^{\circ }$
.
The growth of secondary KH and Rayleigh–Taylor instabilities strongly enhances the mixing between particles. The impact of these secondary instabilities on particle mixing is twofold. On the one hand they can enhance the particle cross-field diffusion because the turbulent perturbations they generate strongly perturb the particle gyromotion. On the other hand they can force magnetic reconnection to occur at the frontier between the two different plasma, i.e. at the precise place they grow, as already shown in fluid simulations (Tenerani et al. Reference Tenerani2011). In this case particles can stream along the newly reconnected magnetic field lines that links the two different plasmas, allowing for an enhanced plasma mixing.
In any case, Nakamura & Daugthon (Reference Nakamura and Daughton2014) showed a net flux of magnetosheath particles toward the magnetosphere. During this phase they fitted the density profile of magnetosheath ions with an error function and, looking at its gradual broadening, inferred the effective diffusion coefficient
 $D_{\text{eff}}=O(10^{9}~\text{m}^{2}\,\text{s}^{-1})$
, of the same order of magnitude as the diffusion coefficient needed to explain the observed mixing in a simplified 1-D viscous model of the Earth’s magnetosphere (Sonnerup Reference Sonnerup1980).
5 Line-tying effects
The importance of line-tying effects on the KH dynamics at low latitude and on the possible development of magnetic reconnection away from the equatorial plane, has been already stressed in the introduction. In particular, the local stability analysis discussed in § 2.4 suggests that field lines are anchored in regions, at high latitude and stable against the KHI. The first consequence is a possible stabilization of the KHI also in the equatorial region, even if the conditions for instability are fulfilled locally. Indeed the different flows that occur at different latitudes, unperturbed at high latitudes and perturbed in the equatorial region, cause a bending of magnetic field lines, whose associated magnetic tension tends to reduce the amplitude of the perturbations. Note that the velocity field generated by the instability has an intrinsic 3-D nature, as it depends on all the three directions: the main inhomogeneity direction perpendicular to the magnetopause and the wave vector direction, but also the northward direction along which stability conditions changeFootnote 13 . Consequently magnetic field lines, frozen in to the fluid motions, are tangled by the flow so that current layers, where eventually reconnection occurs, can be created by KHI even in the case of a strictly northward magnetic field.
Here we resume the main MHD and Hall-MHD results that have been obtained either simulating a model description of the flanks of the magnetosphere, or by global numerical simulations of the whole magnetospheric system. The main advantages of adopting a simplified model of the magnetospheric flank, over a large reduction of the computational cost, are the possibility of investigating small-scale phenomena (e.g. magnetic reconnection) and, even more important, to reduce the complexity of the system allowing for an easier analysis of the different mechanisms that determine the flank dynamics.
5.1 Flank dynamics
We model the flank of the magnetosphere by considering a slab geometry whose
 $x$
-direction is the one perpendicular to the magnetopause at low latitude, the
 $y$
-direction is given by the flowing solar wind and the
 $z$
-direction is the northward one. With only one exception (Borgogno et al.
Reference Borgogno2015) the unperturbed magnetopause is a plane corresponding to
 $x=0$
. In all cases in the literature the high-latitude stabilization is obtained by taking unperturbed initial values that are functions of both the
 $x$
and
 $z$
coordinates, contrary to the discussion in § 2 where only 1-D equilibria were considered.
The first attempt (Galinsky & Sonnerup Reference Galinsky and Sonnerup1994) to include high-latitude stabilization in a slab configuration considered a
 $y$
-component of the magnetic field that changes according to
 $B_{y}=B_{0,y}z\tanh x/a$
. On the contrary, the initial velocity field depends on
 $x$
only. This means that the KHI with
 $\boldsymbol{k}$
parallel to the flow and perpendicular to the averaged magnetic field along
 $\hat{\boldsymbol{z}}$
is gradually stabilized by the magnetic tension associated with the flow-aligned magnetic field component, as soon as the distance from the equatorial plane
 $z=0$
increases. At
 $z=\pm L_{z}/2$
the boundary conditions are set considering conducting plates, whose finite resistivity can model the one of the ionosphere. The main advantage of this configuration is that it mimics the initial shape of the magnetic field lines, curved in opposite directions inside the nightside magnetosphere and inside the magnetosheath (in this case due to their draping around the magnetopause (Spreiter et al.
Reference Spreiter1966)). However, such an initial configuration does not correspond to a MHD equilibrium and relaxes during the evolution of the system. In particular the initial asymptotic velocity far away from
 $x=0$
varies significantly independently from the fact that the KHI is growing because any force balances the magnetic tension associated with the curved lines. Nevertheless this study can give some insights on the linear and nonlinear stability of the system. Depending on the level of initial bending of the field lines and on the value of the boundary resistivity (allowing for a certain slip between the line feet and the boundary flow), the line-tying effects on the KHI are more or less important and can lead to a complete or partial stabilization of the mode.
Similar results have been obtained (Brackbill & Knoll Reference Brackbill and Knoll2001; Knoll & Brackbill Reference Knoll and Brackbill2002) by taking all the fields but the velocity one as constants, including the purely northward magnetic field. In this case the high-latitude stabilization is artificially obtained by modulating the velocity jump across the magnetopause as
 $\unicode[STIX]{x0394}U(z)\propto \cos (\unicode[STIX]{x03C0}z/L_{z})$
, goes to zero at
 $z=\pm L_{z}/2$
. Again, this configuration is not a MHD equilibrium and relaxes in time, even if on a longer time scale as compared to the KH growth time. In this case
 $L_{z}/2$
roughly represent the height of the low-latitude region where a significant velocity jump exists. For a ratio
 $L_{Z}/\unicode[STIX]{x1D706}_{\text{KH}}=4$
the KHI vigorously grows, rolls up in this region and strongly distorts the magnetic field lines due to the differential rotation of field lines, rolled up and wrapped by the vortical motion in the low-latitude region while nearly undisturbed at high latitude. This distortion generates current layer but any reconnection process is observed in numerical simulations (Brackbill & Knoll Reference Brackbill and Knoll2001; Knoll & Brackbill Reference Knoll and Brackbill2002).
The impact of the ratio
 $h/\unicode[STIX]{x1D706}_{\text{KH}}$
on the linear and nonlinear stability has been investigated by Hashimoto & Fujimoto (Reference Hashimoto and Fujimoto2006), starting from a MHD equilibrium configuration. Here
 $h$
is the characteristic height of the region where local conditions for instability are fulfilled. As for 1-D equilibria (see § 2) the velocity field is along
 $\hat{\boldsymbol{y}}$
and depends on
 $x$
only. The magnetic field is uniform and perpendicular to the flow. Together with a uniform pressure these facts ensure force balance. On the contrary
 $n_{\text{eq}}$
and
 $T_{\text{eq}}$
vary along the
 $z$
-direction but maintain the pressure as constant. The stabilization is obtained by taking
 $n_{\text{eq}}$
as increasing away from
 $z=0$
along the field lines. In such a way
 $c_{s}$
decreases moving away from the equatorial plane located at
 $z=0$
and the flow turns out to be super-magnetosonic at high latitude, ensuring stability there. In the unstable equatorial region the KHI grows and rolls up as soon as its height
 $h$
is bigger than or equal to the KH wavelength
 $\unicode[STIX]{x1D706}_{\text{KH}}$
. Only for smaller unrealistic values of
 $h$
is the bending of vertical field lines able to stabilize the system.
Takagi et al. (Reference Takagi2006) adopted a similar configuration and allowed for a density jump across the shear layer and for different orientations of the magnetic field inside the magnetosheath. The angle between the magnetic field and the
 $z$
-direction varies from
 $0^{\circ }$
to
 $45^{\circ }$
. Again, the KHI grows and becomes nonlinear if
 $h>\unicode[STIX]{x1D706}_{\text{KH}}$
. Interestingly enough, vortex pairing can take place only if
 $h\gtrsim 2\unicode[STIX]{x1D706}_{\text{KH}}$
. In some sense the final single or merged vortex needs, in order to grow, enough space ‘along’ the flow but also along the vertical direction. As for 2-D simulations (Jones et al.
Reference Jones1997; Faganello et al.
Reference Faganello2009) the degree of rolling up of the vortices depends on the intensity of the magnetic field component parallel to the flow.
The main conclusion of these studies (Hashimoto & Fujimoto Reference Hashimoto and Fujimoto2006; Takagi et al.
Reference Takagi2006) is that the KHI can generate fully rolled-up vortices also in a system where the height of the unstable equatorial region has a finite height
 $h$
and that the pairing process can also proceed provided that the final vortex size is smaller than
 $h$
. Moreover Takagi et al. (Reference Takagi2006) pointed out that magnetosheath field lines are highly deformed by the complex velocity field that develops in the 3-D system. This strong deformation can lead, away from the equatorial region, to the conditions for magnetic reconnection to develop between magnetosheath and magnetospheric lines. The authors suggested that, in the case magnetic reconnection occurs in both hemispheres, this process could ‘close’ dense magnetosheath flux tubes on the Earth leading to a densification of the magnetosphere. However any sign of reconnection is found in their simulations also because, for numerical reasons, any magnetic field is included in the magnetospheric region. The first numerical evidence of this kind of dynamics, the mechanism that leads to a double-reconnection process and the estimation of the mass entry into the magnetosphere were presented for the first time by Faganello et al. (Reference Faganello2012a
,Reference Faganello
b
) and will be discussed in the following section.
There is only one weak point concerning the initial configurations adopted by Hashimoto & Fujimoto (Reference Hashimoto and Fujimoto2006) and Takagi et al. (Reference Takagi2006). These configurations are equilibria of the set of MHD equations but are difficult to justify from a physical point of view since in a collisionless plasma density or temperature variations along field lines are expected to be smoothed out by the parallel motion of particles. A more correct 2-D MHD equilibrium configuration, depending on
 $x$
and
 $z$
, can be obtained by taking advantage of the one symmetry of our system: translational symmetry along the flow direction. In this case (Andreussi et al.
Reference Andreussi2012) the
 $x$
and
 $z$
components of the equilibrium magnetic field can be described with the aid of a flux function
 $\unicode[STIX]{x1D713}(x,z)$
, corresponding to the component of the vector potential along the ignorable coordinate
 $y$
. At the same time all the other physical quantities must be a function of
 $\unicode[STIX]{x1D713}$
, and are constant along field lines. The equilibrium fields read
 $$\begin{eqnarray}\displaystyle \boldsymbol{B}_{\text{eq}}=\unicode[STIX]{x1D735}\unicode[STIX]{x1D713}\times \hat{\boldsymbol{y}}+B_{\text{eq},y}(\unicode[STIX]{x1D713})\hat{\boldsymbol{y}};\quad n_{\text{eq}}=n_{\text{eq}}(\unicode[STIX]{x1D713});\quad \boldsymbol{U}_{\text{eq}}=U_{\text{eq},y}(\unicode[STIX]{x1D713})\hat{\boldsymbol{y}};\quad P_{\text{eq}}=P_{\text{eq}}(\unicode[STIX]{x1D713}). & & \displaystyle \nonumber\\ \displaystyle & & \displaystyle\end{eqnarray}$$
The force balance equation is equivalent to the well-known Grad–Shafranov equation (Grad & Rubin Reference Grad and Rubin1958; Shafranov Reference Shafranov1966). In a simplified slab geometry this equation reads
 $$\begin{eqnarray}\unicode[STIX]{x1D6FB}^{2}\unicode[STIX]{x1D713}=-4\unicode[STIX]{x03C0}\frac{\text{d}}{\text{d}\unicode[STIX]{x1D713}}\left(P_{\text{eq}}+\frac{B_{\text{eq},y}^{2}}{8\unicode[STIX]{x03C0}}\right).\end{eqnarray}$$
For
 $B_{\text{eq},y}=0$
and uniform pressure, equation (5.2) reduces to Laplace’s equation and
 $\unicode[STIX]{x1D713}$
is an harmonic function. A straightforward solution (Faganello et al.
Reference Faganello2012a
), appropriate for northward periods, is given by
 $$\begin{eqnarray}\unicode[STIX]{x1D713}(x,z)=\frac{1}{2}\left[\left(1+\unicode[STIX]{x1D6FF}\right)x+\left(1-\unicode[STIX]{x1D6FF}\right)\frac{L_{z}}{2\unicode[STIX]{x03C0}}\sinh \frac{2\unicode[STIX]{x03C0}x}{L_{z}}\cos \frac{2\unicode[STIX]{x03C0}z}{L_{z}}\right].\end{eqnarray}$$
This specific choice, together with
 $\unicode[STIX]{x1D6FF}=1/3$
, leads to hourglass-like field lines in the
 $(x,z)$
-plane, as shown in figure 16(a), with a dominant northward component. Taking
 $U_{\text{eq}}(\unicode[STIX]{x1D713})=V_{0}/2\tanh (\unicode[STIX]{x1D713}/a)$
poses the centre of the shear layer at
 $x=0$
, with a maximal equilibrium vorticity
 $\unicode[STIX]{x1D734}\sim V_{0}/2a\hat{\boldsymbol{z}}$
at
 $z=0$
, gradually decreasing away from the equatorial plane. This is shown in figure 16(b–d), where the equilibrium velocity profile is plotted versus
 $x$
for different values of
 $z$
. In this configuration the high-latitude stabilization is achieved via an effective variation of the shear scale length and so of the maximal vorticity. Indeed, from local stability analysis (§ 2) we know that the KHI tends to develop with a wave vector perpendicular to the equilibrium magnetic field, i.e. along the
 $y$
-direction, and that at fixed
 $z$
the growth rate is proportional to the maximal vorticity of the shear layer in that plane. We can thus expect that KHI develops faster in the equatorial
 $z=0$
plane as compared to the high-latitude planes at
 $z=\pm L_{z}/2$
. When 3-D numerical simulations are initialized starting from this equilibrium configuration, the KHI grows as expected in the equatorial region while high-latitude regions remain more or less unperturbed, at least during the growing phase of the instability (Faganello et al.
Reference Faganello2012a
).
(a) Magnetic field lines in the
 $(x,z)$
-plane as given by the equilibrium magnetic flux function in (5.3). Blue and red colours represent the value of the equilibrium velocity along the
 $y$
-direction, passing from
 $-V_{0}/2$
to
 $+V_{0}/2$
across the shear layer, located in the middle (
 $x=0$
) of the numerical domain. (b–d) Profiles of the equilibrium velocity field (in units of
 $V_{0}$
) along the
 $y$
-direction at
 $z=+L_{z}/2$
(b),
 $z=0$
(c) and
 $z=-L_{z}/2$
(d).

5.1.1 Double mid-latitude reconnection
Recently, by means of 3-D Hall-MHD simulations and starting from the equilibria discussed above, Faganello et al. (Reference Faganello2012a
,Reference Faganello
b
) have shown how field lines are distorted and how current layers are generated away from the region where the KHI grows. In fact the main contribution to line stretching and twisting results from the different velocities at which lines are advected along the flow direction at different latitudes rather than from the vortical motion occurring in the equatorial region. Indeed, in the unperturbed flow magnetospheric lines stay at rest and magnetosheath ones are advected at the solar wind velocity. This is the case at stable high latitudes. On the contrary, once these lines are engulfed into vortex structures growing in the equatorial region, their low-latitude portion is still advected along
 $\hat{\boldsymbol{y}}$
but at the phase velocity of the vortices, a fraction of the unperturbed solar wind one. This differential advection with respect to the latitude position, arches magnetospheric and magnetosheath lines in opposite directions, as shown in figure 17(a).
(a) Blue (magnetospheric) and red (magnetosheath) plasma as described by the passive tracer
 $\unicode[STIX]{x1D701}$
, advected by the ion fluid velocity, plotted in
 $(x,y)$
-planes at
 $z=\pm L_{z}/2$
and
 $z=0$
(equatorial plane). Blue and red lines represent pristine magnetospheric and magnetosheath lines, while pale green isosurfaces show current layers with
 $|\boldsymbol{J}|>1.6$
. (b) Same quantities as before, except for field lines: dark green and yellow lines are lines that have undergone reconnection in the northern current layer. Both plots are at
 $t=410$
. (c) Double-reconnected lines in grey and purple, at
 $t=430$
. Physical quantities are normalized to the ion skin depth, the ion cyclotron frequency and the ion mass (Faganello et al.
Reference Faganello2012a
).

In summary, magnetospheric blue lines are strongly distorted by the 3-D motion, but still conserve their original connectivity. Indeed they connect high-latitude blue magnetospheric plasma to the blue arm of a vortex, developed in the equatorial plane. The same is true concerning magnetosheath red lines and plasma. Nevertheless, the fact that lines with different origin have been arched in opposite directions causes them to cross and braid at mid-latitude, corresponding to the formation of pale green current layers (see figure 17 a). At those places the necessary conditions to occur are produced in terms of a sheared magnetic field changing its orientation from northward–sunward to northward–tailward. In simulations reconnection occurs there at the typical time scale of Hall-dominated reconnection, starting first in the northern hemisphere and, after a delay that is short compared to the KH evolution time, acting also in the southern one. In this case reconnection is not forced to proceed by the velocity field imposed by the ideal instability, but occurs as a spontaneous process in the favourable magnetic configuration at mid-latitude. The outflows generated at the reconnection sites are largely dominant as compared to the velocity pattern of vortices at mid-latitude (Faganello et al. Reference Faganello2012b )Footnote 14 .
The first of the two reconnection events generates once-reconnected field lines that are draw in yellow and dark green in figure 17(b). These kind of lines correspond to ‘open’ field lines that are connected to the magnetospheric plasma either in the north or in the south plane located at high latitude: dark green lines in the northern and yellow lines in the southern, respectively. These new lines still cross in the southern hemisphere where the second reconnection process changes once again the global topology and creates double-reconnected lines. They are connected to plasmas having the same origin in the north and south planes but to plasma having the opposite origin in the equatorial plane. In particular, cyan lines, shown in figure 17(c), can be called ‘newly closed’ lines since they are embedded in magnetosheath red plasma in the equatorial region but are connected to the magnetospheric blue plasma in the northern and in the southern high-latitude planes, so that they are closed on the Earth. On the contrary ‘opened’ purple lines connect the magnetospheric blue arm of a vortex to the magnetosheath red plasma in both hemispheres, at high latitude.
The generation of ‘newly closed’ lines can have strong implications on the mass transport through the original magnetic frontier, i.e. the magnetopause. In fact these new lines are topologically part of the magnetosphere but are connected to the magnetosheath at low latitude. The flux tubes associated with these lines can be considered as new magnetospheric flux tubes with their low-latitude portion populated by solar wind particles. Their generation represents a mechanism by which solar wind particles can enter the magnetosphere. For having an efficient solar wind entry this double-reconnection process must be fast enough to produce a reasonable amount of ‘newly closed’ flux tubes, and reliable, meaning that the occurrence of the second reconnection event should not be simply related to the artificial symmetry of the flank model used in these simulations. Concerning the first point, it has been shown (Faganello et al.
Reference Faganello2012b
) that the rate of production of double-reconnected flux tubes can account for the mass entry that is expected at the magnetospheric flanks. In fact the effective diffusion coefficient associated with double mid-latitude reconnection, as inferred by simulations, is of the order of
 ${\sim}O(10^{9})~\text{m}^{2}~\text{s}^{-1}$
, the same order of magnitude as the diffusion coefficient needed to explain the observed mixing in a simplified viscous model (Sonnerup Reference Sonnerup1980).
A schematic representation of the double-reconnection process at mid-latitudes (Faganello et al. Reference Faganello2012b ). Lines are coloured according to the definition given in the text. Blue and red arrows represent the unperturbed magnetospheric and magnetosheath flows that advect the line feet in opposite direction, at high latitude (in the frame where vortices are at rest).

The second point has been discussed by Faganello et al. (Reference Faganello2012b
), looking at the implications of the topological modifications occurring at each reconnection process on the field line dynamics. As shown in a schematic representation of the double-reconnection process (see figure 18), pristine magnetospheric (blue) and magnetosheath (red) lines are strongly distorted during the ideal MHD evolution, but maintain their original connectivity. In our case they were not braided in the initial configuration, and remain unbraided up to the moment reconnection occurs. It is true that the two lines cross in the southern and in the northern hemisphere, and that each cross corresponds to an elementary braid generator (Thiffeault Reference Thiffeault2005), but the composition of a clockwise
 $\unicode[STIX]{x1D70E}^{-1}$
and a counter-clockwise
 $\unicode[STIX]{x1D70E}$
generator corresponds to the identity operator, so that the resulting topology is the same as the initial configuration. On the contrary, as reconnection occurs in one hemisphere, e.g. the northern one, one of the two elementary generators is no longer there and the dark green and yellow lines, resulting from the reconnection process, are actually braided. These two lines are advected at the same velocity at low latitude, the phase velocity of the KHI, while their southern feet are advected in the opposite direction by the unperturbed sheared flow. In such a way they are advected one against the other, at the precise place they cross in the southern current hemisphere, where finally magnetic reconnection must occur a second time. Finally, reconnection unbraids the lines and allows for a relaxation of the system toward a state having lower magnetic tension. In the last graph of figure 18, the double-reconnected cyan and purple lines have been coloured according to the origin of plasma they are connected to. In particular the blue–red–blue line represents a line whose associated flux tube is connected to Earth in both hemispheres but partially populated at low latitude by the solar wind plasma.
It is worth noticing that defining what a reconnected line is, is not straightforward in a complex 3-D geometry. Even less simple is to obtain a quantitative estimation for the reconnection growth rate in 3-D simulations where a strong convection is present quite everywhere, and so where the convective electric field can mask the one generated by reconnection. The method developed in Faganello et al. (Reference Faganello2012b
) is a reasonable one, at least when we are interested in reconnection occurring around a precise frontier, even when this frontier is strongly perturbed during the evolution. In our case what we have called blue and red plasmas correspond to different values of a passive scalar quantity
 $\unicode[STIX]{x1D701}$
advected by the fluid velocity:
 $\unicode[STIX]{x2202}_{t}\unicode[STIX]{x1D701}+\boldsymbol{u}_{i}\boldsymbol{\cdot }\unicode[STIX]{x1D735}\unicode[STIX]{x1D701}=0$
. In the case
 $\unicode[STIX]{x1D701}$
is initialized as
 $\unicode[STIX]{x1D701}=\unicode[STIX]{x1D701}(\unicode[STIX]{x1D713})$
, i.e. constant along equilibrium field lines, and the magnetic field follows an ideal MHD evolution,
 $\unicode[STIX]{x1D701}$
will remain constant along each field line. On the contrary if along a given line
 $\unicode[STIX]{x1D701}$
changes its value, we can state that reconnection occurred somewhere along the line. It is possible to define the ‘non-ideal’ magnetic field component generated by reconnection as
 $B_{n-i}=\boldsymbol{B}\boldsymbol{\cdot }\unicode[STIX]{x1D735}\unicode[STIX]{x1D701}/|\unicode[STIX]{x1D735}\unicode[STIX]{x1D701}|$
. When evaluated at the location where
 $\unicode[STIX]{x1D701}=\unicode[STIX]{x1D701}_{\text{fr}}$
, the value corresponding to the original magnetic frontier,
 $B_{n-i}$
represents the magnetic field component perpendicular to the frontier, the one causing a magnetic connection between the blue and the red plasmas. The growth rate of reconnection at the frontier is thus given by
 $\unicode[STIX]{x2202}_{t}\ln B_{n-i}|_{\unicode[STIX]{x1D701}=\unicode[STIX]{x1D701}_{\text{fr}}}$
. At the same time we can define a line as once reconnected if there is only one
 $\unicode[STIX]{x1D701}$
jump (from the blue/red value to the red/blue one) along the line. If there are two jumps it is a double-reconnected line and so on. In this way we can compute the amount of solar wind plasma that is on double-reconnected flux tubes closed on the Earth.
Adopting the same definitions and starting from a similar equilibrium configuration as used in Faganello et al. (Reference Faganello2012b
), Borgogno et al. (Reference Borgogno2015) performed a statistical analysis of the field lines connectivity. For each time, 5000 field lines are integrated starting from an uniform grid of points located in the northern, stable high-latitude plane. In such a way it is possible to show that the number of lines that have been reconnected more than twice is negligible as compared to those reconnected one or two times. Furthermore, the number of double-reconnected lines is bigger than that of once-reconnected lines and their difference increases in time. This fact implies that once-reconnected lines become double reconnected almost as soon as they are formed, confirming the dynamics described in figure 18. The same authors also looked at the pattern drawn by the crossing point of once-reconnected (green dots in figure 19) and double-reconnected lines (orange dots in figure 19) in mid-latitude planes defined by
 $z=\pm L_{z}/4$
. The crossing points of lines originating close to a mid-latitude reconnection site, that would lie on the separatrix surfaces in a simplified 2-D geometry, are plotted in black. Contrary to the 2-D case, the 3-D one does not show any kind of spatial separation between the crossing point of field lines that have undergone no reconnection (white regions) and lines that have reconnected once or twice. Orange, green and white regions are intertwined in a quite complex structure, covering the whole area of the vortices, where any kind of separatrix can be identified.
Maps of the crossing points of reconnected magnetic field lines at two mid-latitude planes located at
 $z=\pm L_{z}/4$
(Borgogno et al.
Reference Borgogno2015). Orange dots are the crossing points of double-reconnected field lines, while green dots are those of once-reconnected lines. The black dots are the crossing points of line originating close to one mid-latitude reconnection site.

The 2-D equilibrium configuration given by (5.1)–(5.3) can easily account for a density and temperature jump across the unperturbed magnetopause, in particular when the equilibrium pressure is taken as a constant. In that case it has been shown that double mid-latitude reconnection is still at play, at least during the beginning of the nonlinear phase of the KHI (Faganello et al. Reference Faganello2014). At the present time, the late nonlinear phase has not yet been investigated. The added magnetic tension due to the field line bending could, in principle, stabilize secondary HD instabilities, such as Rayleigh–Taylor or KH ones and allow the pairing process to be effective. Or, on the contrary, secondary instabilities could develop at small scales, with a wave vector that is locally perpendicular to the distorted magnetic field, and prevent the vortices from merging. At the same time it must be noted that building up bigger and bigger vortices would require a larger distortion of field lines, unless reconnection at mid-latitude could change the topology and lower the amount of tension of the system. For the moment all these points have not been clarified yet.
5.2 Global simulations and Dawn/Dusk asymmetry
Global MHD simulations of the magnetospheric system confirm the idea, suggested by the local stability analysis discussed in § 2.4, that KHI develops in the equatorial region. Indeed it has been shown that, during northward periods, vortices develop along the magnetospheric flanks up to a latitude of
 $30^{\circ }$
, while the system is fairly stable above this value (Guo et al.
Reference Guo2010; Li et al.
Reference Li2013). Furthermore the KH growth rate observed in simulations is compatible with the one obtained in a simplified slab geometry by Miura & Pritchett (Reference Miura and Pritchett1982) corresponding to a local stability analysis of the global system.
Although global simulations using a realistic geometry cannot resolve the finer structure of the vortices, they can give some insights into the KH nonlinear dynamics and the magnetic topology close to the frontier. In particular Guo et al. (Reference Guo2010) showed that the typical wavelength of the vortices observed along the flanks grow with the distance from the sub-solar point. This fact confirms the idea that the pairing process occurs along the flanks while vortices move tailward, as suggested by simulations of a ‘temporally developing’ layer or of a ‘spatially developing’ layer discussed in § 3.1. In similar global simulations, Merkin et al. (Reference Merkin2013) observed that the phase speed of vortices varies while they are moving tailward. This variation can be understood looking the global features of the magnetosheath velocity that, according to the simple hydrodynamic model of Spreiter et al. (Reference Spreiter1966), is expected to increase in the tailward direction. This flow acceleration is indeed observed in simulations (Guo et al. Reference Guo2010), where finally the magnetosheath velocity turns out to be super-magnetosonic in the far tail.
Concerning the magnetic topology, Merkin et al. (Reference Merkin2013) showed that KH vortices are crossed at the same time by magnetospheric field lines and by IMF ones, confirming the fact that vortices can cause field lines with different origins to tangle up, leading to a magnetic configuration where reconnection can occur. It is worth noticing that vortices located at different latitude planes are connected by the same magnetospheric lines and that these lines set the relative phase of KH structures (Li et al. Reference Li2013). As a consequence, KHI develops as a global mode of the whole magnetopause, and not as if each plane were independent from the others. In fact field lines connecting different planes impose the same velocity pattern everywhere, even if the amplitude of the velocity perturbation decreases with latitude. As shown by local simulations of the flank dynamics, discussed in § 5.1.1, magnetic lines play a central role in fixing the global pattern and that, in some sense, transmit the momentum perturbation away from the location where it is generated more vigorously, i.e. away from the equatorial region.
Global simulations are a powerful tool for investigating the possible Dawn/Dusk asymmetry in the KH evolution, even if kinetic effects are not present in MHD simulations to break the reflectional symmetry of the system with respect to the plane defined by the dipole axis and the solar wind direction. In fact, including a duskward component in the IMF (as it is the case for a Parker spiral configuration in the solar wind, which is the most likely one), the symmetry is broken in the whole system also if the KH dynamics itself is, in principle, not affected. The main difference as compared to the purely northward case is the turbulent activity that develops at the bow shock, well before the location where KHI grows. At the Dusk side the bow shock is quasi-perpendicular and the magnetosheath flow, downstream of the shock, stays nearly laminar. On the contrary, at the Dawn side the shock is quasi-parallel and the magnetosheath flow turns out to be turbulent. This asymmetry in the flow could impact the KH development (Miura Reference Miura1990; Wing et al. Reference Wing2005; Hasegawa et al. Reference Hasegawa2006) as turbulent fluctuations there could serve as a seed for the growing modeFootnote 15 . In fact global MHD simulations, including a duskward component of the magnetic field, exhibit a stronger KH activity at the Dawn flank (Collado-Vega et al. Reference Collado-Vega2007). Further simulations by Nykyri (Reference Nykyri2013) show that, beyond the impact of the turbulence seeds on the KH development, also the magnetic configuration can be more favourable at the Dawn flank. This is related to the fact that the draping of IMF lines around the magnetopause is different at the two flanks and that the flow-aligned magnetic component is finally smaller at the Dawn side, compared to the Dusk one, during Parker spiral periods. The opposite is true for the less probable anti-Parker configuration. Thus, on average, the stabilization due to magnetic tension is less important at the Dawn side and the KH activity is expected to be more important there.
6 Southward periods
For the sake of completeness we briefly summarize the numerical results that have been obtained considering southward IMF periods. Historically, the KHI instability was not investigated in this configuration because the credit for plasma transport was given to reconnection occurring at the dayside magnetopause. However an important KH activity has been observed along the flank also during southward periods (Hwang et al.
Reference Hwang2011; Yan et al.
Reference Yan2014; Kavosi & Raeder Reference Kavosi and Raeder2015), suggesting that KHI can contribute to the plasma transport also during these periods. In principle southward periods should be investigated in a 3-D geometry allowing the wave vector of possible instabilities to cover all the possible directions. In fact when the IMF is strictly southward, the magnetic field is perpendicular to the equatorial plane in both regions on the right and on the left of the magnetopause and the KHI instability naturally develops with a wave vector parallel to the flow and lying in that plane. At the same time magnetic reconnection is expected to occur with an out of plane
 $\boldsymbol{k}$
satisfying the resonant condition
 $\boldsymbol{k}\boldsymbol{\cdot }\boldsymbol{B}$
at the magnetopause. The only 2-D MHD study, performed well before the huge numerical facilities we have in the present day, considers a single direction for
 $\boldsymbol{k}$
, slightly oblique as compared to the horizontal flow direction (Belmont & Chanteur Reference Belmont and Chanteur1989). This choice leads to a 2-D configuration similar to the Type I VIR configuration discussed in § 3.2, where the in-plane magnetic field inverts its direction across the velocity shear layer. Reconnection of the in-plane magnetic field, induced by the KH motion, and vortex pairing has been observed to dominate the dynamics, as it is expected in this configuration.
When the 2-D condition is relaxed the 3-D evolution of the system is expected to be more complex, in particular if the high-latitude stabilization of the KHI instability is included in the model. In this context Brackbill & Knoll (Reference Brackbill and Knoll2001) and Knoll & Brackbill (Reference Knoll and Brackbill2002) model the high-latitude stabilization taking an initial velocity jump that gradually goes to zero when approaching the
 $z$
-boundaries of the numerical boxFootnote
16
. It is shown that the KHI develops vigorously in the equatorial region and, by pinching together the opposite directed field lines of the magnetosphere and of the magnetosheath, forces reconnection to occur there. This process is ruled by the ideal HD instability so that reconnection is forced to occur on the KH time scale, far shorter as compared to the ‘spontaneous’ reconnection time in the resistive MHD framework. The reconnection time is nearly independent of the resistivity value while it scales as the Mach number, as the driving KHI.
A different approach has been adopted by Ma et al. (Reference Ma2014a
,Reference Ma
b
). In this case the initial equilibrium is the usual 1-D MHD one given by (2.1), (2.2) without any modulation of the equilibrium fields along the
 $z$
-direction but considering an anomalous friction at the
 $z$
-boundaries that induces stability there. Furthermore, the localization of the instability in the equatorial region of the numerical box is obtained by considering initial perturbations that are localized there. Depending on the peculiar shape of the initial perturbation, KHI or spontaneous reconnection is triggered first. As already discussed, when KHI starts first (Ma et al.
Reference Ma2014a
) the original current layer is compressed at the KH hyperbolic point by the converging flows imposed by the growing ideal instability. As soon as the current layer thickness reaches the resistive diffusion length, reconnection of magnetic flux occurs at an high rate comparable with the collisionless ‘spontaneous’ one in the absence of a velocity shear (Shay et al.
Reference Shay1998; Birn et al.
Reference Birn2001; Uzdensky & Kulsrud Reference Uzdensky and Kulsrud2006; Vekstein & Bian Reference Vekstein and Bian2006; Bian & Vekstein Reference Bian and Vekstein2007a
), even if any non-ideal effect but resistivity is added to the MHD description. The saturation level of the reconnected flux depends only on that of the KHI. In a single-vortex configuration both saturate at a certain level while in a multiple vortices one the KH paring process builds up bigger and bigger vortices and the reconnected flux continues to increase. When the tearing instability is triggered first (Ma et al.
Reference Ma2014b
) reconnection occurs at the usual slow growth rate observed in the resistive MHD description. During its nonlinear evolution reconnection pinches the original current/velocity layer at the X-line and finally causes the KHI instability to grow there, even if this mode has not been perturbed initially. The growth rate of emerging KH vortices are higher as compared to the previous case, while their wavelength is shorter, as is expected when the half-width of the velocity shear layer is decreased. At this point, the same dynamics we have discussed before sets on: reconnection dynamics and that of the whole system are ruled by the growing KHI.
Adamson et al. (Reference Adamson2016) added an important flow-aligned component to the magnetospheric and IMF one, while did not include any stabilization at high latitude in their MHD simulations. The presence of such a component in the magnetosphere is justified by the magnetospheric line shape when a region well above (or below) the equatorial plane is considered while in the magnetosheath this component is generated by the draping of magnetic lines when the IMF has a Parker spiral configuration, plus a southward component. The mean field orientation causes the KHI to develop with an oblique
 $\boldsymbol{k}$
-vector, with respect to the flow direction. At the same time, due to the lack of any high-latitude stabilization, KHI develops in the whole numerical box and it is not localized in the centre of the box. Nevertheless the dynamics shown by Adamson et al. (Reference Adamson2016) is quite similar to that discussed in Brackbill & Knoll (Reference Brackbill and Knoll2001), Knoll & Brackbill (Reference Knoll and Brackbill2002) and Ma et al. (Reference Ma2014a
), where the KHI drives the dynamics of the whole system and finally forces reconnection to occur.
The expected development of KH vortices during southward IMF periods has also been confirmed by global MHD simulations of the magnetospheric system by Collado-Vega et al. (Reference Collado-Vega2007) and Claudepierre et al. (Reference Claudepierre2008).
7 Discussion and conclusions
The KHI plays a key role in the magnetospheric system dynamics during different configurations of the IMF orientation. This has been proven by observations, theory and numerical simulations, first of all by pointing out the evolution of observed KH vortices. Even more important is to prove the capability of the KH mode, growing at the low-latitude magnetopause and travelling toward the magnetotail, to break down and becoming nonlinear before reaching the flanks. This is how the KH dynamics is able to enhance momentum and mass transport at the frontier between the magnetosheath and the magnetosphere thus leading to the observed gradual densification of the low-latitude magnetospheric flanks. This dynamics goes from the classical 2-D HD process of vortex pairing to the development of secondary HD or ideal MHD instabilities growing on the dynamical configuration created by the fully rolled-up vortices. In particular secondary Rayleigh–Taylor and KH instabilities can develop along the vortex arms, compete with vortex pairing, by destroying the vortex structures before they eventually merge creating an HD mixing layer. At the same time vortices can drive magnetic reconnection, the essential mechanism for an actual mass transport between two magnetically unconnected plasmas. In particular Type I VIR is forced to proceed driven by the KH vortex velocity field in the presence of a pre-existing current layer in the equilibrium configuration, as observed when the magnetic field changes its orientation passing from the low-latitude magnetosphere to the solar wind. On the contrary when the magnetospheric field and the IMF are fairly aligned in the low-latitude region reconnection occurs as a secondary instability on the shoulder of vortices even in the absence of a pre-existing current layer. This process is known as Type II VIR. While Type I and II VIRs occur at low latitude around the equatorial plane where the vortices develop, mid-latitude reconnection acts far away from the vortex location due to the magnetically connected 3-D dynamics of the system when including the KH stable high-latitude regions.
Rolled-up vortices are thus the key ingredient for enhancing the plasma transport at the magnetospheric flanks and their capability of rolling up before reaching the flanks have been suggested by numerical simulations and confirmed by satellite data. In particular numerical simulations have shown that the
 $e$
-folding distance of the KHI is sufficiently short to allow vortices to roll up at the dayside magnetopause. These rolled-up structures have been observed at the magnetospheric flanks by the Cluster mission during northward (Hasegawa et al.
Reference Hasegawa2004) and southward periods (Hwang et al.
Reference Hwang2011). In particular, the multi-spacecraft configuration of the Cluster mission is able to distinguish between spatial and temporal variations and have proved the existence of folded regions of cold and dense plasma corresponding to the magnetosheath arms of rolled-up vortices. The main problem is that the Cluster data for the flank region are quite rare, so different techniques have been suggested for identifying rolled-up vortices in the far larger data set of single-spacecraft crossings of the flank magnetopause. As Miura (Reference Miura1997) pointed out, the vortical motion of each vortex is caused by the total (magnetic
 $+$
thermal) pressure gradient that develops between the depression at the vortex centre, its surrounding and in particular the maximal pressure region at the hyperbolic point. With a simple analysis, Hasegawa (Reference Hasegawa2012) related the radius of the vortex to the jump of the total pressure observed by a satellite crossing. In such a way Nishino et al. (Reference Nishino2011), Faganello et al. (Reference Faganello2014) and Farrugia et al. (Reference Farrugia2014) recognized rolled-up structures in the single-spacecraft data of the Geotail, THEMIS and WIND mission respectively. A second useful method is the one developed by Takagi et al. (Reference Takagi2006) based on the fact that the tenuous magnetospheric arm of a vortex rotates faster than the surrounding dense magnetosheath plasma, as observed in numerical simulations by Matsumoto & Hoshino (Reference Matsumoto and Hoshino2004) and Nakamura et al. (Reference Nakamura2004). Indeed the two close plasmas are subject to similar centripetal forces due to the total pressure variation, but have different inertia. Plotting the measured velocity vs the measured density the crossing of the rolled-up magnetospheric arm is thus characterized by a ‘faster than sheath tenuous plasma’: the low density magnetospheric plasma of the arm not only has a finite velocity as compared to the stagnant magnetosphere but moves even faster than the magnetosheath high density plasma. This method provides an easy statistical approach for single-spacecraft data in order to identify rolled-up events. On the other hand it must be noted that it helps in detecting rolled-up events only when the satellite trajectory completely cross the magnetopause (Hwang et al.
Reference Hwang2011). In the case the satellite gets close to the magnetopause and detects the KH oscillations but remains inside the inner region with respect to the unperturbed magnetopause, it observes only the dense magnetosheath arm of each vortex that extends in the inner region while any tenuous magnetospheric arm extending in the outer region can be detected. As a consequence ‘faster than sheath tenuous plasma’ is not detected even if the vortices are fairly rolled up. Defining rolled-up events as events with a ‘faster than sheath tenuous plasma’, Hasegawa et al. (Reference Hasegawa2009) found that they represents 11 % of the data detected at the flanks by Geotail during northward periods, over more than nine years of data. As suggested by the authors this percentage must be considered as a lower limit as all the events with rolled-up vortices but a satellite staying in the inner region with respect to the unperturbed magnetopause are not taken into account. In any case the existence of rolled-up vortices at the magnetospheric flanks has been finally confirmed by several satellite missions and has been proved to be far from rare (Hasegawa et al.
Reference Hasegawa2004; Taylor et al.
Reference Taylor2008, Reference Taylor2012; Hasegawa et al.
Reference Hasegawa2009; Bavassano Cattaneo et al.
Reference Bavassano Cattaneo2010; Hwang et al.
Reference Hwang2011; Nishino et al.
Reference Nishino2011; Faganello et al.
Reference Faganello2014; Farrugia et al.
Reference Farrugia2014; Lin et al.
Reference Lin2014).
Concerning the rich dynamics that develops during the nonlinear phase of the KHI, the vortex pairing seems to be a quite robust mechanism, as simulations indicate that it is effective in different configurations and plasma descriptions. In particular 2-D simulations, be they fluid or kinetic, have shown that the vortex pairing goes on during northward (see §§ 3.1 and 4.1) and southward periods (Belmont & Chanteur Reference Belmont and Chanteur1989). Even if including a realistic density jump between the magnetospheric and the magnetosheath plasma in simulations seems to allow the secondary Rayleigh–Taylor instability to grow along the vortex arms to be able to completely disrupt the vortex structures (Faganello et al.
Reference Faganello2008a
; Cowee et al.
Reference Cowee2009; Matsumoto & Seki Reference Matsumoto and Seki2010), as soon as a small but not null flow-aligned (in-plane) component of the magnetic field is taken into account, the pairing is effective (Cowee et al.
Reference Cowee2010; Tenerani et al.
Reference Tenerani2011). Indeed the small magnetic tension associated with this component is able to stabilize, or at least smooth out, secondary HD instabilities at small wavelengths so that the large-scale coherence of the merged vortices is preserved. At the same time reconnection processes associated with the in-plane component of the magnetic field do not preclude the pairing process, being reconnection of Type I (Nakamura & Fujimoto Reference Nakamura and Fujimoto2008; Califano et al.
Reference Califano2009) or Type II (Baty et al.
Reference Baty2003; Faganello et al.
Reference Faganello2008b
, Reference Faganello2009). The robustness of the pairing process must be confirmed by well-resolved 3-D simulations since, up to now, numerical results have not provided a definite answer. For instance, Nakamura & Daugthon (Reference Nakamura and Daughton2014) have clearly shown that in a 3-D system the secondary Rayleigh–Taylor instability can vigorously grow even if a flow-aligned magnetic component is present. The instability develops with an ‘oblique’ wave vector
 $\boldsymbol{k}$
with respect to the flow direction, so that the magnetic tension stabilizing term, proportional to
 $\boldsymbol{k}\boldsymbol{\cdot }\boldsymbol{B}$
, is minimized. However Takagi et al. (Reference Takagi2006) including high-latitude stabilization for the KHI showed that even if vortices are perturbed by local fluctuations they finally pair. Global MHD simulations of the whole magnetosphere can hardly resolve small-scale local instabilities as the Rayleigh–Taylor one, nevertheless they can give some insight into the evolution of the vortices in the actual geometry. Guo et al. (Reference Guo2010) and Li et al. (Reference Li2013) showed that KH vortices develop at both flanks with a typical length that increases as the distance from the sub-solar point increases, indicating that the pairing is effective.
Even if the competition between the pairing and secondary hydrodynamic instabilities has not yet been clarified in 3-D simulations, from an observational point of view the vortex pairing seems to be effective. In particular Foullon et al. (Reference Foullon2008) and Hasegawa et al. (Reference Hasegawa2009) pointed out that the measured vortex length at the magnetospheric flank is far greater than the one expected when looking at the half-width of the velocity shear layer measured at the dayside magnetopause, confirming the idea that KH vortices emerges in the dayside region and gradually pair while moving toward the tail. This picture is confirmed by the statistical survey performed by Lin et al. (Reference Lin2014) by looking at 52 rolled-up events at the magnetopause showing that the observed wavelength increases with the distance from the sub-solar point.
Concerning VIR, the large majority of numerical studies have been performed in a 2-D description. This dimensional simplification helps in isolating the different processes at play, defined above as Type I or Type II VIR, in particular if a pre-existing current layer is present in the equilibrium configuration or not. In the first case reconnection is forced to proceed in the initial current layer by the ideally growing KHI on a time scale independent of the small-scale processes that violate the ‘frozen-in’ condition (Chen et al.
Reference Chen1997; Knoll & Chacón Reference Knoll and Chacón2002; Nakamura & Fujimoto Reference Nakamura and Fujimoto2006; Nakamura et al.
Reference Nakamura2006, Reference Nakamura2011, Reference Nakamura2013). In the second case, when reconnection occurs as a secondary instability only once KH vortices have rolled-up magnetic field lines does the precise plasma description adopted turn out to be crucial for catching the actual dynamics of the magnetic field lines (Faganello et al.
Reference Faganello2008c
, Reference Faganello2009). Since reconnection takes place on a time-varying configuration, the one of the evolving vortices, the difference between the reconnection time scale and the vortex one is crucial. For the typical magnetospheric plasma parameters, including the Hall term in the generalized Ohm’s law turns out to be the ‘minimal’ choice for correctly describing the topology evolution of magnetic field lines. For a while the simplified 2-D configurations of Type I or Type II VIR have been considered to provide a simple model but containing the main physics of the more complex 3-D geometry of the magnetospheric system. For example Nykyri et al. (Reference Nykyri2006) showed that the Type I VIR configuration can represent a first modelling of the magnetospheric flank when the IMF has an important component along the flow. As suggested by satellite data analysis KH vortices develop with a wave vector
 $\boldsymbol{k}_{\text{obs}}$
that has a finite component along
 $\hat{\boldsymbol{z}}_{\text{GSM}}$
, so minimizing the magnetic tension. Projecting all the fields on the 2-D dynamical plane defined by the equilibrium inhomogeneity direction
 $\hat{\boldsymbol{x}}$
and
 $\boldsymbol{k}_{\text{obs}}$
, the Type I VIR configuration is finally obtained. Two-dimensional numerical simulations starting from this initial condition show the usual Type I VIR dynamics with reconnection occurring at the KH hyperbolic point in between two neighbour vortices of a vortex chain.
However, as soon as the dynamics along the third dimension is switched on the evolution of the system appears far more complex and not a slight modification of the 2-D dynamics. We can distinguish two types of 3-D effects: the ‘local’ small-scale one and the ‘non-local’ large-scale one including the fact that field lines are ‘tied’ to stable regions located far away from the low-latitude unstable one. When the 3-D dynamics of the KHI is investigated starting from the 1-D configuration adopted in two dimensions (all equilibrium fields depend only on
 $x$
-coordinate describing the direction normal to the unperturbed magnetopause), only local small-scale effects are observed. As expected by such quasi-2-D configuration, KH vortices naturally grow as nearly 2-D structures almost invariant along the direction perpendicular to a 2-D dynamical plane defined by
 $\hat{\boldsymbol{x}}$
and
 $\boldsymbol{k}_{\text{KH}}$
. In this case 3-D effects mainly concern the small-scale secondary phenomena that develop during the nonlinear phase, as discussed for secondary Rayleigh–Taylor instability. For magnetic reconnection the impact is more significant since reconnection can now develop in regions where the in-plane magnetic field is different from zero. Indeed reconnection proceeds with an oblique wave vector, with respect to the direction of
 $\boldsymbol{k}_{\text{KH}}$
, satisfying the necessary resonant condition
 $\boldsymbol{k}_{\text{rec}}\boldsymbol{\cdot }\boldsymbol{B}=0$
. Nakamura et al. (Reference Nakamura2013) showed that oblique modes represent
 ${\sim}$
50 % of the reconnecting structures of Type I VIR and largely contribute to convert magnetic energy into kinetic and thermal energies via reconnection and to enhance the particle transport.
A completely different evolution is observed when the simulations are initialized starting from an equilibrium configuration that depends also on the latitude coordinate. In this case it is possible to include the high-latitude stabilization of the KHI. As a result, even the early stage of the KHI evolution becomes three-dimensional and finally generates a large-scale magnetic configuration completely different compared to the one obtained starting with a 1-D initial configuration. The most important consequence is that favourable conditions for reconnection to occur are now created first far away from the location where the vortices grow. Indeed during the early evolution of the KHI the field lines are advected in a different way in the equatorial region where vortices develop and at high latitudes where the initial flow remains unperturbed. As a consequence strong current layers are formed at mid-latitude, in the northern and in the southern hemispheres, even when the magnetospheric and IMF field lines were initially parallel. In such a way magnetospheric and IMF lines experience reconnection at different latitudes and change their global topology. This double mid-latitude reconnection process (Faganello et al. Reference Faganello2012b ) creates a new class of magnetospheric lines connected to the Earth at both poles, but embedded in the solar wind plasma at low latitude. The low-latitude portion of the flux tubes associated with these ‘newly closed’ magnetic lines is thus populated by solar wind particles and contributes to the densification and cooling of the low-latitude magnetospheric flanks.
From an observational point of view in situ evidence of VIR reconnection has been reported by Nikutowski et al. (Reference Nikutowski2002), Eriksson et al. (Reference Eriksson2009) and Hasegawa et al. (Reference Hasegawa2009). In particular, with the aid of 2-D reconstruction techniques, they have shown that the measured fields are compatible with reconnection occurring in the same place as the KH vortices and with magnetic field lines that cross the local magnetopause. More recently Eriksson et al. (Reference Eriksson2016) have taken advantage of the unprecedented temporal and spatial resolution of the MMS mission for proving the existence of ongoing reconnection in between KH vortices. In particular they listed 22 reconnection exhausts measured during the detection of 42 current layers compressed by the KH dynamics. Each exhaust is related to the outflows produced by Type I VIR going on at each compressed current layer presumably located at the KH hyperbolic point. Indeed the local magnetic configuration shows a shear between the magnetospheric field and the IMF, as expected for a Type I VIR configuration.
Concerning ‘non-local’ 3-D effects on the KHI and on reconnection, Taylor et al. (Reference Taylor2008) showed that KH vortices are localized in the equatorial region while Hasegawa et al. (Reference Hasegawa2004) and Foullon et al. (Reference Foullon2008) confirmed that the measured KH vortices are fairly three-dimensional and that magnetic field orientation is compatible with field line bending due to the different advection experienced in the region where the vortices grow and in stable regions at higher latitude. Remote signatures of mid-latitude reconnection have been found in data collected by the THEMIS mission. In particular Faganello et al. (Reference Faganello2014) showed that the measured magnetic field at the vortex location is compatible with differential line advection and that at the same time fluxes of electrons streaming along field lines are in agreement with those generated by mid-latitude reconnection just occurred in both hemispheres. The same event has been analysed by Nakamura et al. (Reference Nakamura2013) and compared with kinetic simulations but neglecting high-latitude stabilization. They suggested that Type I VIR is the responsible for the generation of the observed fluxes. Both kind of reconnection, local and remote with respect to the equatorial region, could coexist during the same event as they are not in competition and can cooperate in determining the rate at which solar wind enters the magnetosphere during northward periods. In fact, as discussed before, when the IMF is not perfectly aligned with the low-latitude magnetospheric field, Type I VIR is forced to proceed ‘locally’ where the KH velocity perturbations are more intense. At the same time the differential advection can modify the pre-existing current layer away from the equatorial region and lead to mid-latitude reconnection. This possibility has been suggested by Vernisse et al. (Reference Vernisse2016) that analysing the same events of Eriksson et al. (Reference Eriksson2016) pointed out that the in situ signatures of Type I VIR coexist with remote signatures of mid-latitude reconnection occurring mainly in the southern hemisphere. Today this possibility has not been investigated by the numerical community. These studies would clarify why, for a given shear between the IMF and the magnetospheric one, mid-latitude reconnection is favoured in only one hemisphere and, even more important, how the cooperation between Type I VIR and mid-latitude reconnection changes the global magnetic topology and impacts the transport properties of the magnetopause.
Enlarging our point of view to the whole magnetopause we recover other two key phenomena that can interplay with the rich dynamics of the KHI. In particular DLR has been observed to act in the polar regions during northward periods. In such a way solar wind flux tubes reaching the nose of the dayside magnetopause are ‘closed’ on the Earth adding solar wind plasma to the outer magnetosphere and thus generating the dayside LLBL. The second one is the resonance of Alfvénic fluctuations at the magnetopause, with a parallel wavelength of the order of the length of magnetospheric lines and a perpendicular one far smaller. These fluctuations can be given by the large magnetosonic oscillations present in the magnetosheath (Johnson et al.
Reference Johnson2001a
) or by the KHI itself (Chaston et al.
Reference Chaston2007) leading to the excitation of KAWs whose fluctuations causes a stochasticization of ion orbits and finally an important cross-field diffusion across the magnetopause (Johnson & Chen Reference Johnson and Chen2001b
). About the efficiency of the different processes during northward IMF periods, Faganello et al. (Reference Faganello2012b
) and Borgogno et al. (Reference Borgogno2015) have shown that the effective diffusion coefficient associated with double mid-latitude reconnection driven by the KHI is of the order of the one needed to explain the observed mixing in a simplified viscous model (Sonnerup Reference Sonnerup1980). The same order of magnitude has been recovered by looking at the combined action of Type I VIR and secondary Rayleigh–Taylor instability in ‘local’ kinetic simulations (Nakamura & Daugthon Reference Nakamura and Daughton2014). Global simulations of the whole magnetosphere (Øieroset et al.
Reference Øieroset2005) have shown that DLR effectively produces a cold and dense plasma sheet (the low-latitude region of the near tail). At the same time WIND data (Wing et al.
Reference Wing2006) suggest that each process, being it KHI induced mixing, KAWs or DLR, can account for
 ${\sim}50\,\%$
of the particle inflow leading to the densification and cooling of the plasma sheet. More precisely Taylor et al. (Reference Taylor2008) and Hasegawa et al. (Reference Hasegawa2009) stated that DLR generates the LLBL at the dayside magnetopause where the KH mixing process has just started, but that DLR alone is not sufficient for explaining the observed entry of solar wind particles at the flanks. They suggested KAWs or KHI associated with ‘remote’ reconnection for completing the particle amount that finally enters the magnetosphere.
A way to estimate the averaged weight of each process in determining the plasma transport across the flanks is to perform a statistical survey of the low-latitude magnetosphere and to compare the possible impact of the different processes with real data. In particular Johnson & Wing (Reference Johnson and Wing2009) showed that plasma density peaks close to the outer magnetosphere while the ion temperature drops, as it could be expected when a cold population of solar wind particles enters from the flanks. At the same time the specific plasma entropy
 $s=P/n^{\unicode[STIX]{x1D6E4}}$
of the cold population in the outer magnetosphere is five to twenty times greater than its value in the magnetosheath, just outside the magnetopause, indicating a non-adiabatic entry mechanism. This heating could be related to non-adiabatic processes as wave–particle resonances or particle acceleration during reconnection. At the same time the possibility of creating ‘newly closed’ field lines during double reconnection processes increases the plasma specific entropy even without any additional particle acceleration. In fact as the cold and dense magnetosheath plasma is captured on a ‘newly closed’ field line connected to the Earth at both poles it expands in the northern and southern portions of the associated flux tube, previously filled with the hot and tenuous magnetospheric plasma, on a time scale of the order of the particle bounce motion along the line. During this process Johnson & Wing (Reference Johnson and Wing2009) estimate the specific entropy variation as
 $\unicode[STIX]{x0394}s\sim s_{\text{sh}}\,(\unicode[STIX]{x1D6E4}-1)(V_{\text{sph}}/V_{\text{sh}})$
where
 $V_{\text{sph}}$
represents the volume of the north and south portions of the ‘newly closed’ flux tube and
 $V_{\text{sh}}$
that in between (the magnetosheath portion of the flux tube). In the case of DLR the volume ratio is fairly small being the length of the lobe portions of the tube smaller than the rest and their section smaller due to
 $|\boldsymbol{B}|$
rising toward the Earth so that the specific entropy increase is limited. On the contrary double mid-latitude reconnection can account for the observed specific entropy variation as
 $V_{\text{sph}}\gg V_{\text{sh}}$
. Entropy data suggest that double mid-latitude reconnection plays an important role during northward periods. In summary, the general consensus is that the three possible mechanisms coexist and cooperate in generating the LLBL and cause the densification of the low-latitude magnetosphere. They contribute to the plasma transport in different regions, with DLR acting mainly in the dayside magnetopause while KAWs and KH related phenomena increasing the transport at the flanks.
At the same time an important point is still under debate: why the transport properties at the Dawn and Dusk flanks are different. Indeed the ion distribution functions that are observed at the LLBL and in the plasma sheet are usually characterized by two different populations at the Dusk flank, meaning that hot magnetospheric and cold magnetosheath ions have been mixed up in the real space but not in the energy one. On the other hand these two separate populations are not recognizable at the Dawn flank as the energy mixing too is effective there (Hasegawa et al. Reference Hasegawa2003; Wing et al. Reference Wing2005). This asymmetry, with respect to the magnetotail axis, suggests that either different transport mechanisms are dominant at the two different flanks or that the same processes behave differently depending on their location. For instance, Nishino et al. (Reference Nishino2011) invoke different weights of KAWs and of KH induced reconnection at the two flanks since the first process is expected to mix up particles in space and energy while the second is supposed to be effective mainly in the real space. Concerning KAWs their asymmetry can be related to the different level of magnetosonic fluctuations typically observed at the Dawn or Dusk flanks (Wing et al. Reference Wing2005; Johnson & Wing Reference Johnson and Wing2009). In fact during a Parker spiral configuration, that is the most likely one for the equatorial component of the IMF, the solar wind flowing around the Dawn flank turns out to be turbulent as soon as it crosses the bow shock, being here the shock normal quasi-parallel to the direction of the magnetic field. On the contrary the solar wind approaching the magnetopause at the Dusk side stays laminar because the shock is quasi-perpendicular there, so that the level of magnetosonic fluctuation is smaller causing a lower KAW activity at this flank.
The reasons explaining the asymmetry in the transport generated by the KHI are more subtle. First, the more likely turbulent flow at the Dawn flank could enhance the KH activity there as turbulent fluctuations can serve as seeds for linear instability. Moreover the draping of IMF lines around the magnetopause during a Parker spiral configuration is different at the two sides causing a flow-aligned component of the magnetic field larger at the Dusk flank causing a partial stabilization of the KHI there (Nykyri Reference Nykyri2013). At the same time FLR effects modify the KH growth rate depending on the relative orientation of the equilibrium magnetic and vorticity fields (Nagano Reference Nagano1978, Reference Nagano1979; Huba Reference Huba1996) causing the KHI to develop faster at the Dawn flank where
 $\unicode[STIX]{x1D734}\boldsymbol{\cdot }\boldsymbol{B}<0$
as compared to the Dusk flank where
 $\unicode[STIX]{x1D734}\boldsymbol{\cdot }\boldsymbol{B}>0$
. Turbulent fluctuations, draping of the IMF and FLR effects can thus favour the statistical development of large-scale KH vortices at the Dawn side. Since vortices represent the driver for the rich small-scale dynamics that occurs during their nonlinear phase and that finally induces the plasma transport, a large-scale asymmetry could translate into an asymmetry in the averaged transport properties of the magnetopause. Furthermore a different level of large-scale KH activity can induce different levels of KAW activity at the two flanks as the former can excite the latter (Chaston et al.
Reference Chaston2007). However the observations about the large-scale KH activity at the flanks are not always in agreement: some of them (Hasegawa et al.
Reference Hasegawa2006; Nishino et al.
Reference Nishino2011) observe a symmetric KH activity, others (Taylor et al.
Reference Taylor2012) even find a more pronounced activity at the Dusk flank. One could invoke that turbulent fluctuations could also serve as seeds for the small-scale dynamics that dominates the nonlinear phase of the KHI so that even if the large-scale KH vortices are fairly symmetric the final transport is more pronounced at the Dawn side (Nishino et al.
Reference Nishino2011). In any case Dimmock et al. (Reference Dimmock2015) showed that, according to their data, the level of turbulence at the Dawn flank is not sufficient to assure the asymmetry observed in plasma transport. This fact suggests that kinetic effects, such FLR effects, could affect the rich nonlinear dynamics of the KHI and thus those mechanisms such as secondary HD instabilities or magnetic reconnection that finally allow for plasma mixing.
In order to clarify the reasons beyond the observed asymmetry and the possible role of kinetic effects on plasma mixing in the case of
 $\unicode[STIX]{x1D734}\boldsymbol{\cdot }\boldsymbol{B}\gtrless 0$
, kinetic simulations should be the principal investigation tool. When the kinetic scales are not too small as compared to the planetary scale, it is possible to perform global kinetic simulations of the whole magnetosphere. This is for example the case of Mercury where recent global kinetic simulations (Paral & Rankin Reference Paral and Rankin2013) have reproduced the Dawn/Dusk asymmetry observed by MESSENGER (Sundberg et al.
Reference Sundberg2012; Gershman et al.
Reference Gershman2015). At the Earth’s magnetosphere the scale separation is too large and simulations limited to the flank region are the only possible issue. This approach combines the computational feasibility with the possibility of isolating the impact of kinetic effects on the KHI from other possible causes of asymmetry (as discussed above). However the main problem of these kinds of simulations is the way they are initialized. The vast majority of kinetic numerical studies of the KHI have been initialized starting from a shifted Maxwellian that even if able to easily describe the spatial inhomogeneities of the macroscopic fields it is far from being the distribution function of a kinetic equilibrium. The quick relaxation (on a time scale of the order of the gyroperiod of ions, far smaller than the KH growth time) of this non-equilibrium configuration depends on the relative orientation of the magnetic and vorticity field so that the new ‘relaxed’ macroscopic fields over which the KHI starts to grow are quite different for
 $\unicode[STIX]{x1D734}\boldsymbol{\cdot }\boldsymbol{B}\gtrless 0$
(see § 4.1.1 for details). As a consequence the possible asymmetry, with respect to the sign of
 $\unicode[STIX]{x1D734}\boldsymbol{\cdot }\boldsymbol{B}$
, in the KHI linear or nonlinear evolution is completely masked by the fact that different vortices emerges from the two different ‘relaxed’ configurations. Although the approximated 1-D Vlasov equilibria proposed by Cai et al. (Reference Cai1990) and Cerri et al. (Reference Cerri2013, Reference Cerri2014) strongly reduce the relaxation problem they have been rarely adopted in literature in favour of the easier but more problematic shifted Maxwellian initialization. Starting kinetic simulations from these approximated equilibria should help in clarifying the role of the KHI, and of all the ‘local’ transport mechanisms it drives such as secondary HD instabilities, vortex pairing and Type I or II VIR, in generating the Dawn/Dusk asymmetry.
Note that the approximated Vlasov equilibria cited above include only one inhomogeneity direction, the
 $x$
-direction perpendicular to the magnetopause. They represent a ‘local’ description of the equilibrium configuration of the low-latitude magnetopause and completely neglect any variation of macroscopic plasma quantities along the northward
 $z$
-direction that can include in the model the high-latitude stabilization of the KHI. An example of macroscopic fields including the high-latitude stabilization is the magnetic configuration proposed by Faganello et al. (Reference Faganello2012a
). In this 2-D fluid equilibrium the projections of field lines in the
 $(x,z)$
-plane are not straight but shaped and are described by a magnetic flux function
 $\unicode[STIX]{x1D713}(x,z)$
while all the others macroscopic fields depend on
 $\unicode[STIX]{x1D713}$
only. This equilibrium configuration has strong magnetic gradients at the
 $x$
-boundaries where non-zero magnetic pressure and magnetic tension counterbalance. In a fluid description these strong gradients can be managed by boundary conditions based on MHD characteristic decomposition (Hedstrom Reference Hedstrom1979; Thompson Reference Thompson1990; Landi et al.
Reference Landi2005), as it has been done in Faganello et al. (Reference Faganello2012a
,Reference Faganello
b
, Reference Faganello2014) and Borgogno et al. (Reference Borgogno2015). In principle it would be possible to build up new kinetic equilibria having
 $\unicode[STIX]{x1D713}$
instead of
 $x$
as the sole inhomogeneous coordinate and so to reproduce the macroscopic fields of Faganello et al. (Reference Faganello2012a
). In practice slab kinetic PIC or Vlasov codes would hardly be able to manage the non-trivial boundary conditions that are required for supporting the strong equilibrium magnetic gradients that are present at the
 $x$
-boundaries. In the Tokamak community it is common to adopt in numerical code a set of coordinates aligned with the equilibrium field. In particular the direction perpendicular to the equilibrium flux surfaces is naturally given by
 $\unicode[STIX]{x1D713}$
so that boundary conditions at a given surface are easier to manage. This approach, that requires an huge effort in defining the new metrics in the code equations, is certainly justified in the Tokamak case where the geometry of the equilibrium magnetic field is prescribed once by the machine configuration and where the magnetic perturbations are usually small as compared to the equilibrium field. On the contrary it is more questionable in the magnetospheric context, and more in general in the astrophysical one, where the same numerical code is usually developed for investigating different phenomena with completely different geometry and where the magnetic perturbations can be as large as the equilibrium quantities.
A different approach for investigating the impact of kinetic effects on the ‘non-local’ KH dynamics and its possible Dawn/Dusk asymmetry could be to add the relevant kinetic terms to a fluid description. An example of such a model is the one adopted by Huba (Reference Huba1996) in 2-D simulations of the ‘local’ dynamics. In this case an agyrotropic pressure tensor accounting for FLR effects at the first order in the parameter
 $\unicode[STIX]{x1D70C}_{i}/L$
, where
 $L$
is the spatial scale of plasma variations, is included in the ion fluid motion equation. Adding the agyrotropic tensor to the set of ideal MHD equations modifies its properties and in principle the MHD characteristic decomposition at the boundaries is no longer possible. In practice, as it is the case for other non-ideal terms as resistivity, electron inertia or the Hall term, if the agyrotropic pressure goes to zero at the boundaries the MHD characteristic decomposition can be used even if the physics in the internal region is more complex. This is true when the equilibrium fluid velocity is not perturbed and goes to a constant value at the boundaries, as gyroviscosity is proportional to first spatial derivatives of the velocity field. A special care should be used in managing the velocity perturbations reaching the boundaries and probably some kind of numerical matching would be required in order to gradually switch-off non-MHD terms there. Similar matching techniques have been adopted for the challenging coupling of PIC and MHD codes, with the former describing a small kinetic region embedded in a MHD domain described by the latter (Sugiyama & Kusano Reference Sugiyama and Kusano2007; Usami et al.
Reference Usami2012, Reference Usami2013). In such a way 3-D simulations of the KHI, including ‘non-local’ effects could be performed including first-order FLR effects.
In summary, this review covers more than fifty years of theoretical and numerical efforts in investigating the magnetized KHI at the flaks of the magnetosphere. We have devoted a special care in underlying the main advantages and limitations of the different models that have been adopted in the literature. We stress here that adopting a 2-D kinetic description for the plasma seems to be far less crucial than adopting a 3-D fluid description, as demonstrated by 2-D kinetic and fluid simulations of the ‘local’ configuration reproducing the same dynamics, at least for what concerns the large-scale KH evolution, the small-scale secondary instability dynamics and the modification of the magnetic line topology due to reconnection. Certainly kinetic simulations help in precisely quantifying the rate of plasma transport since they naturally describe the fast streaming of particles along reconnected field lines linking the magnetospheric region to the solar wind, as shown by Nakamura et al. (Reference Nakamura2013), Nakamura & Daugthon (Reference Nakamura and Daughton2014) in ‘local’ kinetic simulations of Type I VIR. Fluid models have permitted to gradually understand the fundamental physics of the system and to investigate the large majority of secondary phenomena induced by the KHI. By taking advantage of the greater simplicity of fluid models as compared to a full kinetic description, it has been shown that the full 3-D dynamics of the KHI, including stable and unstable regions at different latitudes, represents a complete change in the paradigm as compared to the simplified ‘local’ dynamics.