

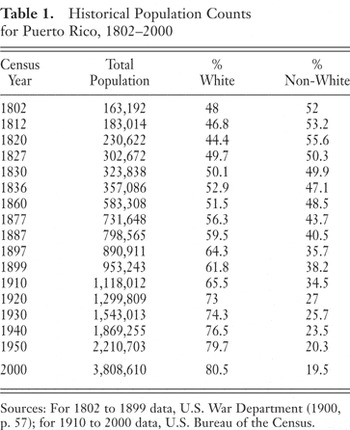
In 2000, for the first time in fifty years, the U.S. Bureau of the Census included a question on race in its decennial census questionnaire for Puerto Rico. The results were surprising for a number of reasons. One was that, despite a hiatus of fifty years in accounting for race in Puerto Rico, the proportions in the White and non-White populations essentially remained the same (see Table 1). This was surprising in light of the pattern over the previous 150 years: a relative stability between 1950 and 2000 contrasts notably with the period from 1860 through 1950. Whereas under Spanish colonialism the racial makeup of the population seemed to have remained stable for a period of time, in its waning days, the non-White population began declining proportionately with the growth of the White population. The proportion of Whites to non-Whites hovered around 50% for both groups between 1802 and 1860. However, from its peak in 1820, the proportion of non-Whites steadily declined, accelerating after 1860. Historical factors account for this phenomenon: the abolition of the slave trade, which severely limited the supply of slave labor from Africa; the abolition of slavery, which ended the demand for slave labor from Africa; the cholera epidemics in the nineteenth century, which disproportionately affected the urban poor, made up largely of non-Whites; and the Spanish colonial government's policy to foster White immigration (Scarano 1993; Baralt 1985; Díaz Soler 1981; Acosta 1866). The White population, however, suddenly increased under United States colonialism. Stability in the racial composition of the population seems to have returned under the commonwealth regime, but the numerical preponderance of Whites persists.
Historical Population Counts for Puerto Rico, 1802–2000
Another interesting finding is that the relative stability of the racial proportions in Puerto Rico and the consistently high proportion of the population identified as White over this span of years contrasts notably with the results for race found among Puerto Ricans in the United States in 2000 (see Table 2). Whereas in Puerto Rico the proportion of Whites was 81%, in the United States only 47% of Puerto Ricans self-identified as White. In contrast, the disparity in proportion of those identifying as Black was minimal: 8% in Puerto Rico and 7% in the United States. A large disparity was also noted among those who chose some race other than those offered in the census questionnaire. In Puerto Rico, 7% of respondents chose another race, compared to 37% in the United States.
Race among Puerto Ricans in the United States and for Puerto Rico and Aguadilla, PR (Census 2000)

THE FRAGILITY OF RACIAL CATEGORIZATION
The results on racial identification among Puerto Ricans in the United States, where a large proportion of people choose racial descriptors not provided by the Census Bureau and Whites make up less than one-half of the population, have served as evidence of the rejection by Puerto Ricans (and Latinos more generally) of the United States' bipolar construction of race relations (Rodríguez 2000). For others, it is part and parcel of the articulation of the hegemonic discourses of race in the United States that conflict with those in Puerto Rico and “produce incompatible portraits of racial identity [among Puerto Ricans] on the Island and in the U.S….” (Duany 2002, p. 239). The lack of correspondence in the selection of racial identification categories among members of the same group in two distinct societies raises not only theoretical and analytical questions, but methodological ones as well. The reliability and even validity of racial identification categories in structured format, such as those used by the U.S. Bureau of the Census and other U.S. government agencies (according to directives by the Office of Management and Budget) have been challenged to the point where some scholars recommend against using them for the Puerto Rican population (Landale and Oropesa, 2002). However, political, legal, and administrative imperatives resulting from the enactment of the Civil Rights Act of 1964 make this recommendation unlikely to be accepted in the foreseeable future. Accordingly, appropriate measures need to be developed in order to continue tracking improvements, or lack thereof, in social conditions for groups that have been disproportionately subject to the discriminatory effects of the social system in the United States.
Given the social and political nature of racial construction in the United States, in particular, and elsewhere in the world, more generally, the very idea of valid and reliable racial categories is open to skepticism. Nevertheless, because stratification based on race has occurred, monitoring changes in this stratification along racial lines, among others, becomes necessary. Arguments that highlight how the State contributes to or perpetuates the racialization of society by categorizing people along racial lines ignore the historical and political forces that create such race-based inequality to begin with. The racialization of society precedes its enumeration along racial lines (Bonilla-Silva 1996), certainly in the context of the Americas, and racial labels reflect the local context of race relations. If observations regarding racial identity are to be made in a particular society, then the racial labels or categories used should approximate as much as possible people's self-perceptions of what situates them in a racial group in relation to others' perceptions of what characterizes that racial group. But given the variety of factors that affect a person's self-perception of race and how others may perceive different racial groups, racial categorization will continue to be problematic. This study offers empirical evidence for the problematic nature of racial categorization.
Creating useful racial identification categories under the auspices of the U.S. Bureau of the Census may be simpler for Puerto Rico than for the United States, given that the reconstruction of variables measuring racial identity would treat only small segments of the United States population, such as Puerto Ricans represent (Swarns 2004). If Puerto Ricans are not themselves relying on racial categories constructed according to the historical and political trajectory of the United States (which Puerto Ricans do not fully share), then it may be useful to allow for racial categories that are pertinent to the Puerto Rican experience. This, of course, seems more likely to take place on the island of Puerto Rico than in the whole of the United States. On the other hand, given the high incidence of Hispanics who respond to racial categories using the “Other” response, and given that nearly one-half of the Puerto Rican population resides in the United States, such reformulation of racial identification variables in the U.S. may be called for as well (Bonilla-Silva 2004). The more immediate focus of this work will nevertheless be on Puerto Rico.
In 1997, I conducted a survey in Aguadilla, one of Puerto Rico's seventy-eight municipalities, in order to ascertain the impact of the migration experience on the political participation of Puerto Ricans who have lived in the United States and returned to the island.2
The sample was collected using a multistage area probability sample of the municipality of Aguadilla. The household was the sampling unit. From the household, one person was selected utilizing a random procedure. The target size of the sample was 500 people. Ultimately, 322 respondents were interviewed from a maximum of 492. The response rate was therefore 65%. Among the non-respondents, eighteen were cases in which an interview was not attempted because no member of the household was born in Puerto Rico, disqualifying them from being included in the sample for which the survey was originally conducted. Of the eighteen households with no members born in Puerto Rico, nine included Puerto Ricans born in the United States; five included people born in the United States but whose ethnic or national background could not be ascertained further; two included people born in the United States but not of Puerto Rican origin; one family was Lebanese; the remaining family was Dominican. These eighteen non-respondent cases represent less than 4% of the sample target size. For more details on the sampling procedure, see Vargas-Ramos (2000, Chapter 1 and Appendix A).
Trigueño derives etymologically from the word trigo, which means wheat in English.
The categories used in the instruments for racial self-identification were categories commonly used in Puerto Rico (Gordon 1949; Denton and Massey, 1989). Trigueño is a fluid term in Puerto Rico's racial lexicon (Godreau 2000; Duany 2002). It may denote a person whose racial description lies somewhere between White and Black, and thus be used more or less as an equivalent of mulatto. However, Trigueño may also be used to refer euphemistically to a Black person, instead of Negro, which in Spanish, depending on context or inflection, can have negative connotations and is sometimes used pejoratively. Trigueño may also refer to a White person's tanned (wheat-colored) complexion. In other words, the usage of the term Trigueño is situational, contextual, and slippery. Black and White may seem self-evident labels, but they are also subject to contextual variations. However, whereas White has a very broad social definition, Black is often socially defined in narrower terms (Hoetink 1967): the term Black tends to evoke images of prototypical (and stereotypical) sub-Saharan African phenotype as it pertains to skin color, hair texture, thickness/narrowness of lips, nose, etc.
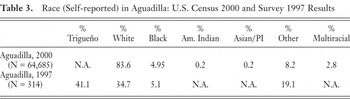
As shown in Table 3, 41% of survey respondents identified themselves as Trigueño, making it the modal category. This is followed by White, at 35%. Almost 20% of respondents identified themselves by using another racial label, ranging from Indio, Criollo, Quemado and Mezclado to Puertorriqueño and Latino.4
These terms translate in English to Indian, Creole, burned, mixed, Puerto Rican, and Latino, respectively. However, with the exception of Puerto Rican and Latino, the cognate terms are not readily equivalent to their English language or Anglo-American translation. Of the sixty respondents who choose the label “Other,” thirty-one identified their race as Puerto Rican (or Boricua); eight identified themselves as Mestizos; seven stated that they were Mezclado or Ligado; five labeled themselves Latino or Hispano; five said they were neither Black nor White; and four said they were Indios. There were other labels such as Caucásico, Prieto, Jabao, Mulata, etc., but these were named by only a handful of individual respondents.

Race (Self-reported) in Aguadilla: U.S. Census 2000 and Survey 1997 Results

Different Measures, Different Outcomes
Several factors may contribute to these discrepancies between the census and the Aguadilla survey results. First, the decennial census was largely self-administered in the privacy of the respondent's home (at least for a large segment of the population).6
For the 2000 Census, as for the previous two censuses, the Census Bureau has relied on questionnaires that are mailed to homes, to be mailed back once filled out. The response rate to these mailed questionnaires was 67% nationally, ranging from 56% to 76% (U.S. Bureau of the Census 2004). The response rate for Puerto Rico was 53%; only some American Indian areas had lower response rates. In order to achieve a full count, the Census Bureau then dispatches enumerators, who attempt to gather relevant information from non-respondents.
Prior to 2000, racial identity in Puerto Rico was established by the census enumerator.
More glaring is the omission of racial terms commonly used in Puerto Rico, such as Trigueño, Moreno, or Pardo, which may or may not be more accurate or appropriate, but are in fact, or have been, used by Puerto Ricans administratively and in social discourse. It is unclear whether these additional labels are used to refer to specific racial identities distinct from White and Black identities or whether they are simply descriptors for different types of Black or even different types of White.8
Given racial construction in Puerto Rico and the pervasiveness of White supremacy, Trigueño, Pardo, or Moreno may be labels that reflect a physical or biological distancing from Blackness conferred to offspring in the process of miscegenation. Alternatively, they may be labels that reflect semantic distancing from Blackness. However, such distancing, whether physical or semantic, does not seem to reach Whiteness, even if it approaches it.
In contrast to the five racial labels offered by the Census Bureau, the Aguadilla survey offered four. The survey did not include a label for American Indian/Native Alaskan, nor for Asian/Pacific Islander, but it did include the residual category “Other”. The Aguadilla survey did not allow for multiple racial categories, although it was noted on the instrument when a respondent mentioned more than one racial label. The survey did include the locale-specific term Trigueño,9
The decision to use the term Trigueño to contrast with White and Black, as opposed to other terms, such as Pardo or Moreno, was made because it has been used in previous surveys that measure race (Tumin and Feldman, 1971) and seems to be the term with the widest use for an “intermediate” racial category (Duany 2002). Pardo appears to be obsolete in everyday discourse.
A further methodological distinction between the Aguadilla survey and the decennial census was that the survey was not self-administered, but rather administered by a single interviewer. The presence of an interlocutor may have created a “social check,” leading respondents to attempt to conform to social expectations. Racial construction in Puerto Rico has been described as based on phenotype (rather than hypodescent): physical characteristics denote a given racial identity labeled with a specific moniker (Seda Bonilla 1961, 1973; Hoetink 1967). However, as a social construct, race is intersubjective and dialectical—it is not constructed in a vacuum. As a result, while a person may identify him- or herself racially in one way, his or her self-identification may face social scrutiny and sanction (Rodríguez and Cordero-Guzmán, 1992). One's own self-identification may be met with acceptance, qualification, challenge or rejection by others (Plessy v. Ferguson 1896; Omi and Winant, 1986). Similarly, when others impose labels on an individual during social discourse, these may be accepted, qualified, challenged, or rejected by the labeled individual.
Although the census questionnaire and the survey instrument are not equivalent tools, comparisons and some preliminary conclusions are possible. First, the data do not support the hypothesis that the use of the terms Black and African American by the Census Bureau in the 2000 Census might have led some Puerto Ricans who regard themselves as Black to choose another label so as not to be identified as African Americans (i.e., Black Americans). Virtually the same proportion of Black Aguadillans is found in both the 2000 decennial census and the Aguadilla survey conducted three years earlier (and among Puerto Ricans in the United States).
Secondly, when given an option based on locally defined parameters, most Aguadillanos chose neither Black nor White, but an option describing an intermediate position between these two racial poles, Trigueño. Moreover, when the opportunity for such an alternative, locale-specific category does not exist, as in the decennial census, and in an environment that is free of direct social scrutiny, those respondents overwhelmingly identified themselves as White. Other racial labels officially used in the United States have scant resonance in Puerto Rico.10
Even the residual “Other” category, which might capture the response of those persons not satisfied with the choices of labels presented by the Census Bureau, does not register a large proportion of identifiers. Those who chose “Other” made up less than 10% of respondents to the census questionnaire in Puerto Rico. Furthermore, those who chose more than one racial category, denoting that they were a racial mixture, comprised less than 3% of the respondents.
Finally, while the Aguadilla survey provided a locale-specific racial term that became the modal category among respondents, a notable portion of Aguadillanos chose another label to identify themselves racially. While some of these other terms might be synonymous with Trigueño (e.g., Mestizo, Ligado, Jabao), the modal subcategory among these respondents is an ethnonational term (Puerto Rican or Boricua).11
Those choosing Puerto Rican/Boricua as their race represented 51% of the “Other” category and 10% of the total sample. It is difficult to interpret the meaning of the racialization of an ethnonational term such as Puerto Rican. One possible interpretation of such meaning is that Puerto Rican or Boricua reflects the racial mixture that pervades Puerto Rican society. The colonial government of Puerto Rico, in the process of creating among Puerto Ricans an identity as a people that furthered its political project (i.e., Commonwealth/Estado Libre Asociado), promoted the idea that Puerto Rican culture is the product of three “roots” or antecedent cultures, privileged in varying degrees: Spanish/European, Indian, and African (Dávila 1997). The insistence that Puerto Rican culture and identity are the mixture of three cultures and peoples may have been extended to the terrain of racial identity and internalized by some Puerto Ricans to mean that Puerto Rican as a “race” is the fusion of three antecedent races.
The Eye of the Beholder
The variability among Puerto Ricans in responses to different data-gathering instruments raises questions about the reliability of the measurements. One way to gauge the relative reliability of socially constructed variables is to subject them to social scrutiny. Insofar as racial identification is concerned, particularly in an environment where phenotype prevails over hypodescent as the determining factor for racial identification, social scrutiny can be attempted through contrasting a respondent's view of his or her race with that of an unrelated party. Correspondence in racial self-perception and perception by others can thus provide analysts some degree of confidence in the validity of their findings. A lack of congruence, on the other hand, would call for some caution regarding conclusions based on those results.
There is reason to believe that racial self-perception and perception by others in Puerto Rico do not always coincide. Tumin and Feldman found several decades ago that “[m]ost curiously, and most importantly, there are quite a few Puerto Ricans who prefer to call themselves Mulatto rather than White, in addition to those who prefer Mulatto to Negro” (1971, p. 228). The proportion of Mulattos in Tumin and Feldman's island-wide survey fell by 9% when the interviewer identified the respondent's race. Correspondingly, the proportion of Whites increased by 7% and that of Blacks by 2.5%.12
The data also show how the proportion of Whites found in 1961 was either 54%, according to respondents, or 61%, according to interviewers. 40% identified themselves as Mulattos, whereas interviewers identified 31% as such. 5.5% self-identified as Black, while interviewers identified 8% as Black. These proportions of Whites in the sample were smaller than the totals found in the 1950 decennial census and correspondingly higher for the non-White groups. As Table 1 shows, the White population in Puerto Rico in 1950 was 79.7%. These findings from forty years ago should also raise questions as to the reliability of census results on racial data.
Such disparities appear also in the 1997 Aguadilla survey results. Whereas 35% of respondents self-identified as White, the interviewer identified 45% as White (see Table 4).13
Pearson's chi-square (131.542) is statistically significant (p > 0.000).
To establish an additional dynamic, the interviewer also asked respondents to identify the interviewer racially. Of the 123 respondents who were asked to identify the interviewer, 41.5% saw him as White; 40.7% saw him as Trigueño; 1.6% identified him as Black; 12.2% used another label; and 4.1% did not respond. The interviewer, a very light-skinned person of stereotypical Mediterranean phenotype, who tans to a light-brown hue, would classify himself as White in the context of Puerto Rico.
Percentage Correspondence in Racial Identification

These data suggest a fairly wide level of agreement among Aguadillanos regarding racial identification. The interviewer's identification coincided with that of three-fifths of the respondents. Where there was disagreement between the interviewer and the respondent, the interviewer noticed some evidence of “Whitening” or “lightening” in 11% of the cases (thirty-three people). However, while this may seem to indicate a form of “mental Whitening” among the population, there was at the same time a “darkening” of another 10% of the sample.15
Bearing in mind the subjectivity involved in identifying people's races, it is appropriate to note the possibility that the interviewer may have “lightened” respondents as a reflection of the biases of the interviewer in a society where Whiteness is privileged (Roy-Fequiere 2004; Zenón Cruz 1974).
“Whitening” as a survival strategy crystallized with the concept of the “mulatto escape hatch” (Degler 1971; Skidmore 1972). In contrasting views of Latin American and North American race relations, the prevailing notion of Latin American “racial democracy” highlighted the harmonious relations between Whites, Blacks, and people of other races, including permutations. While never perfect, Latin American racial democracy was presented as a salutary contrast to the violently segregationist racial regime in the United States (Freyre 1986; Blanco 1942). A sign of the tolerance that Latin American racial democracy exhibited was the mobility that non-White social groups enjoyed. Instead of a rigid polarization between Black and White, such as prevails in the United States, it was (and continues to be) argued that Latin America organized its different racial arrangements along a graduated continuum of racial identities that traverse the spectrum between Black and White. While certainly stratified along race, Latin American racial regimes allowed for an attenuated impact of race on people's livelihood as their skin color (and other physical attributes of racial identity) lightened or became more European, as opposed to African. As a result, Mulattos in Latin America were said to be better off in socioeconomic terms than Blacks, although not as well off as Whites.
The survey results reveal that, while there may be some tendency towards “Whitening” in Aguadilla (albeit tentatively, since they may not be perceived as “light” by an interlocutor), other Aguadillans in fact “darken” themselves. This “darkening” occurs not only among those perceived as White by an interlocutor, as Tumin and Feldman (1971) noted, but also among those perceived as Trigueños. In other words, some Aguadillans are not escaping, but actually embracing Blackness. What are the implications of these racial identifications for an analysis of people's life chances based on race?
RACE AS A STRATIFYING FACTOR
Race is a critical variable in explaining social stratification in Puerto Rico and among Puerto Ricans (Rogler 1948; Seda Bonilla 1961, 1973; Kantrowitz 1971). Moreover, there is ample evidence of racial discrimination and prejudice directed against those Puerto Ricans (and others) of African descent: in the household and extended family, at school, among peers, and in communities of faith (Franco Ortiz 2003); in the media, in general, and television programming, in particular (Rivero 2000); in private employment (Withey 1977); in the enforcement of law and order (Santiago-Valles 1996); in the context of physical or geographical spaces (Godreau 1999; Mills-Bocachica 2003); in the formation of national identity (Godreau 1999; Roy-Fequiere 2004; Zenón Cruz 1974; González 1985; Carrión 1996; Pedreira 1934 [1992]); and in other areas as well. Even a cursory look at Puerto Rican society reveals the racial stratification of the society. The complexion of the strata lightens as one proceeds beyond the lower-middle class and into the upper-middle and upper classes. This is not to suggest that darker-skinned Puerto Ricans are overrepresented in the lower strata, but they certainly are underrepresented in the upper strata of society, as though a glass ceiling were still in place for most non-White Puerto Ricans (Seda Bonilla 1961).
Findings from a survey conducted in Puerto Rico in 1961 are illustrative. In terms of jobs, the survey found that, for occupations ranked “high,” “medium,” and “low,” Whites were significantly overrepresented in high-rank jobs, slightly overrepresented in medium-rank jobs, and slightly underrepresented in low-rank jobs (Tumin and Feldman, 1971, p. 333). In contrast, Mulattos were slightly overrepresented in low-rank jobs, slightly underrepresented in medium-rank jobs and considerably underrepresented in high-rank jobs. Likewise, Blacks were markedly underrepresented in high-rank jobs and slightly overrepresented in low-rank jobs, but they were also slightly overrepresented in medium-rank jobs. In terms of educational attainment, the advantage Whites held in relation to Mulattos and Blacks was evident as well. Whites, who represented 53% of the sample, made up 68% of the most educated segment of the sample (those with more than a high school education). In contrast, Mulattos (40% of the sample) and Blacks (5.5% of the sample) represented only 23% and 4%, respectively, of the most educated. Results for those survey respondents with “some schooling” are more in keeping with their sample ratio: 51% of Whites, 42% of Mulattos, and 6% of Blacks had attended school to somewhere between the first and eighth grade. However, among those without any formal schooling, Whites were correspondingly underrepresented (44%), while non-Whites were overrepresented, with 50% of Mulattos and 5% of Blacks falling into this category (Tumin and Feldman, 1971, pp. 230–233).
Does Race Matter?
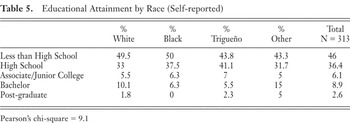
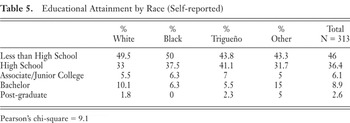
In the Aguadilla survey, two measures of socioeconomic performance can be utilized to ascertain whether the sample is stratified along racial lines: the highest level of education achieved and annual family income. Almost one-half of the sample had not finished high school (see Table 5), approximately one-third received a high school diploma, and less than 10% held a college degree. But race does not seem to have an effect on the educational attainment of Aguadillanos: Whites attended school for an average of 9.8 years; Trigueños, 10.6 years; Blacks, 10.8 years; and “Other”, 11.3 years. These differences are not statistically significant. Furthermore, the differences evident in these data, such as the higher proportion of “Others” with bachelor's degrees, may not be attributable to race in any general way.16
Pearson's chi-square (9.1) is not statistically significant.
Person's chi-square (1.7) is not statistically significant.
Educational Attainment by Race (Self-reported)

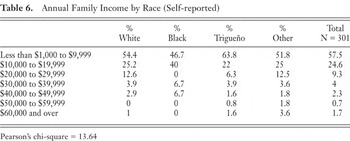
The second measure of socioeconomic status, income, provides similar conclusions. First, more than one-half of the sample made less than $10,000 a year (see Table 6). One-quarter made between $10,000 and $20,000 a year. Just under 10% made between $20,000 and $30,000, while another one-tenth made over $30,000 a year. There are some variations in annual family income among the racial categories, but the statistical results are not robust enough to allow us to conclude that race accounts for the variations noted.18
Pearson's chi-square (13.6) is not statistically significant.
Annual Family Income by Race (Self-reported)

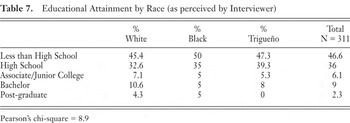
Given the results on the concordance of racial identification between respondent and interviewer, the socioeconomic indicators were re-analyzed in order to ascertain whether there was any variation in the results once racial self-identification was subjected to social scrutiny. Thus, the data were cross-tabulated using the racial identification noted by the interviewer.19
In no way should a respondent's racial identification as provided by this interviewer be interpreted as privileging his observation and opinion over that of the respondent. The purpose of the comparison is to ascertain variability and congruence in perception between the two and the impact of such variability and perception on socioeconomic indicators.
Pearson's chi-square (8.9) is not statistically significant.
Educational Attainment by Race (as perceived by Interviewer)

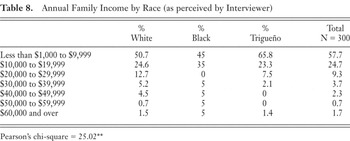
The results for income, however, do exhibit differences when race is defined by the interviewer instead of the respondent, with race affecting the distribution of income among respondents (see Table 8).21
Pearson's chi-square (25.02) is statistically significant (p = 0.015).
Annual Family Income by Race (as perceived by Interviewer)

A Targeted Focus on Race
Bivariate relations are illustrative, but may not reveal other important interactions also present. For instance, family income is strongly and positively correlated with educational attainment: the longer one's formal education, the higher the income level.22
Pearson's r = 0.509 (p = 0.000).
Pearson's r = −0.519 (p = 0.000).
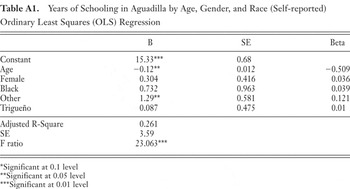
As expected, age is the variable with the strongest effect on years of schooling attained (Appendix, Table A1).24
This is evident in the value of the unstandardized coefficient (B = −0.12), as well as in the variance explained by the equation. The equation explains 26% of the variance in the dependent variable when age is included. When it is not, the equation only explains 0.5% of the variance in years of schooling. The model also loses statistical significance when age is not specified as an explanatory variable in the model.
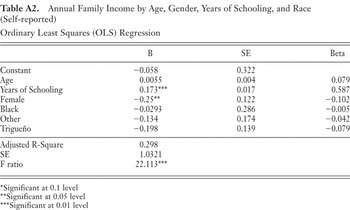
Race, on the other hand, does not show any statistically significant effect on annual family income (Appendix, Table A2). None of the racial categories provided by respondents showed significant effect on income when age, gender, and education were held constant. Nor did age have a significant impact, which suggests that the gains provided by education more than compensate for the youthfulness of a respondent or the experience of a respondent in the older age-groups upon his or her income. Being a woman, on the other hand, decreased the yearly income reported for the respondent's family.25
This indicates the difficulties women face in Puerto Rican society. Despite parity in educational attainment, female respondents to the survey were not able to show they are on a par with men insofar as translating their educational capacity to comparable income levels. There are indeed other factors that may inhibit a woman from earning money on a par with a man, such as her employment status and the industry sector in which she is employed. Moreover, this lack of parity in income levels, despite similar educational attainment, highlights the inability of Aguadilla's society to translate advantages some social groups may have into higher income levels.
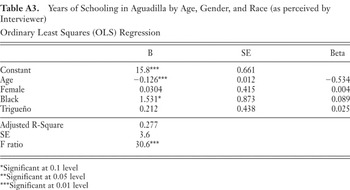
The data were also calculated so as to determine whether the respondent's race as perceived by interviewer had an impact on educational attainment and income when age, gender, and educational attainment (in the case of income) were held constant (Appendix, Table A3). For education, age was the strongest predictor of years of schooling. Older persons had lower levels of educational attainment than younger ones (B = −0.126). Gender did not have a statistically significant effect on educational attainment. Nor did being identified as Trigueño (as opposed to White). Being identified by others as Black, however, does have an impact when compared to people identified by others as White; those seen as Blacks attend school for one and one-half year longer than those perceived by others as Whites,26
The confidence level at which this unstandardized regression coefficient (B = 1.531) is deemed statistically significant is higher (p = .08) than the standard (p = .05). While acceptable, it indicates a slightly greater degree of error for the result.
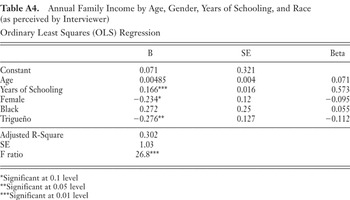
As for the impact of race on annual family income, educational attainment proves to be the strongest predictor, as indicated in the previous regression model (Appendix, Table A4). The higher the educational attainment level of the respondent, the higher the income level he or she reports. Age does not have a statistically significant effect on income; being female, however, does, for the income level reported by women is lower than that reported by men. Being identified as Black does not translate into different income levels vis-à-vis Whites, a finding that might be interpreted as meaning that race does not affect family income. However, if education is the most robust predictor of income, and those identified as Black have an educational edge over Whites (albeit a statistically weaker one), then the fact that Blacks are not able to translate that advantage into higher earnings indicates that not being White in Aguadilla incurs a cost. This is underscored further in the finding for Trigueños, for those identified as Trigueños report lower levels of income than do Whites (B = −0.276). Given that Trigueños and Whites did not differ in educational attainment, if Trigueños report lower income than Whites, then this implies that race affects non-Whites negatively in Aguadilla.27
A caveat: annual family income has been used to determine the impact race may have on a person's life prospects. But families may include White, Blacks, and/or Trigueños. To what extent there is racial exogamy or endogamy cannot be ascertained from these data, and so the results for income may be considered tentative and more suggestive than conclusive.
DISCUSSION
These data and analyses point to differential results in income levels based upon racial identification, with Trigueños most affected. Blacks are also affected, but the discrimination they may suffer in income levels is attenuated by their relatively higher educational achievement, findings consonant with the results reported by others (Webster and Dwyer, 1988; Silva 1985). However, whereas the Aguadilla survey results based on racial self-identification do point to an effect of race on educational attainment and income level, the affected category (“Other”) is residual, making it difficult to interpret the results.28
The inability of those respondents self-identified as “Other” to translate their educational attainment into higher income levels needs to be considered alongside the interviewer's perception of those respondents' race. Of those who provided another racial term to identify themselves, 53% were perceived by the interviewer to be White, 4% Black, and 44% Trigueño.
Race matters in Puerto Rico, because it continues to be a stratifying factor in Puerto Rican society. This is precisely because some Puerto Ricans are unable to translate some of the resources they have at hand into additional resources. Specifically, some Puerto Ricans are unable to convert their educational achievements into higher income. Socioeconomic indicators are not the only factors that shed light on how race stratifies society—they may not even be the best ones (Bonilla-Silva 1996). However, socioeconomic factors are very significant and very tangible. Race matters, and it matters a great deal.
But if race matters, so, too, does who identifies race. What is the most reliable and valid manner to identify a person's race? Self-identification has become the standard, and it should arguably continue to be the standard, on both normative and practical grounds. Interlocutors such as enumerators or interviewers bring with them experiences and biases that inform their perception of social life. Practically speaking, the fact that most censuses, surveys, and polls use mail-back questionnaires or interviews over the phone limits the identification of race by interlocutors. Yet self-identification also poses reliability issues, as illustrated above.
It may be argued that in six previous censuses conducted in Puerto Rico by the U.S. government, an additional category for a mixed population was used, and the results still showed that a majority of the population was White. However, it still remains to be seen whether providing Puerto Ricans the opportunity to identify themselves racially in the privacy of their own home, using as an alternative category a locally based option such as Trigueño, would result in a majority of the population identifying themselves as White. Evidence from the Aguadilla survey as well as other sources indicates that such an opportunity would give rise to divergent results from those reported in the 2000 Census. The racial categories used in the 2000 Census in Puerto Rico may have been appropriate for the people of the United States—perhaps. However, for Puerto Ricans this set of categories lacked specificity. The exclusion of a term such as Trigueño, which, when offered as an option, becomes the modal racial category, suggests that the U.S. Census data obtained for Puerto Rico are questionable.
APPENDIX
Years of Schooling in Aguadilla by Age, Gender, and Race (Self-reported) Ordinary Least Squares (OLS) Regression

Annual Family Income by Age, Gender, Years of Schooling, and Race (Self-reported) Ordinary Least Squares (OLS) Regression

Years of Schooling in Aguadilla by Age, Gender, and Race (as perceived by Interviewer) Ordinary Least Squares (OLS) Regression

Annual Family Income by Age, Gender, Years of Schooling, and Race (as perceived by Interviewer) Ordinary Least Squares (OLS) Regression