INTRODUCTION
The activity of soil microorganisms is critical to decomposition processes and the accumulation and/or loss of soil organic matters (SOM) (Fierer and Schimel Reference Fierer and Schimel2003; Filip et al. Reference Filip, Claus and Dippell1998). Recent research has demonstrated the roles of soil microbial diversity and composition as a predictor of soil properties and functions across non-agricultural biomes (Smith et al. Reference Smith, Marín-Spiotta, Graaff and Balser2014). The C source specificity and resource flexibility of soil microbial communities are important determinants of their ability to respond to perturbation including climate change since their effects on soil C reserve are underestimated in many predictive models (Liang and Balser Reference Liang and Balser2011; Mambelli et al. Reference Mambelli, Bird, Gleixner, Dawson and Torn2011; Ziegler et al. Reference Ziegler, Billings, Lane, Jianwei and Fogel2013). Findings from an elevation gradient in the Peruvian Andes showed a strong relationship between both climate-vegetation and soil microbial activity (Nottingham et al. Reference Nottingham, Fierer, Turner, Whitaker, Ostle, McNamara, Bardgett, Leff, Salinas and Silman2018; Whitaker et al. Reference Whitaker, Ostle, McNamara, Nottingham, Stott, Bardgett, Salinas, Ccahuana and Meir2014). Many studies have shown that the soil bacterial/fungal diversity/abundance and soil biogeochemical functioning is closely associated (Schaeffer et al. Reference Schaeffer, Ziegler, Belnap and Evans2012; Strauss et al. Reference Strauss, Garcia-Pichel and Day2012; Wang et al. Reference Wang, Nie, Butterly, Wang, Chen, Tian, Song, Xi and Wang2017). However, none of these studies combine direct measures of soil microbial function with their C resource uses matrices. Improved understanding of microbial C metabolism source is needed to predict storage and cycling of SOM in global soils (Trumbore Reference Trumbore2009).
Phospholipid fatty acids (PLFAs) are biomarkers found in viable microbial cells (White et al. Reference White, Davis, Nickels, King and Bobbie1979) that can be used to indicate the structure and C metabolism of soil microbial communities in different ecosystems (Zelles et al. Reference Zelles, Bai, Rackwitz, Chadwick and Beese1995; Frostegård and Bååth Reference Frostegård and Bååth1996). Individual PLFA determinations can be combined with isotopic analyses to identify compound specific microbial carbon cycling (Rethemeyer et al. Reference Rethemeyer, Kramer, Gleixner, Wiesenberg, Schwark, Andersen, Nadeau and Grootes2004; Mendez-Millan et al. Reference Mendez-Millan, Nguyen Tu, Balesdent, Derenne, Derrien, Egasse, Thongo M’Bou, Zeller and Hatte2014). For example, PLFA carbon stable isotope (13C) signatures can be used to determine carbon resources recently assimilated by soil microbes (Boschker and Middelburg Reference Boschker and Middelburg2002). This approach has been widely used to determine carbon sources of soil microorganisms using 13C-labeled substrates in laboratory experiments (Abraham et al. Reference Abraham, Hesse and Pelz1998) or using natural variation in C3-C4 transition studies in the field (Balesdent et al. Reference Balesdent, Mariotti and Guillet1987; Boschker et al. Reference Boschker, Nold, Wellsbury, Bos, de Graaf, Pel, Parkes and Cappenberg1998; Kramer and Gleixner Reference Kramer and Gleixner2006). However, natural abundance 13C tracer approaches are constrained by relatively small differences in 13C signatures observed between microbial and soil C pools (Faure Reference Faure1978).
In recent years, the development and application of compound specific radiocarbon analysis (CSRA) using natural abundance radiocarbon (14C) as a tracer offers new perspectives for the understanding of soil C resource use at the molecular scale (Trumbore Reference Trumbore2000). The nuclear weapons testing in the early 1960s nearly doubled the 14C/12C ratio in the atmosphere, producing a “bomb-peak” of 14C that now serves as a global tracer of biospheric C exchange (Levin and Hesshaimer Reference Levin and Hesshaimer2000). Researchers have measured 14C signatures of PLFAs (PLFA-CSRA) to identify microbial carbon sources in contaminated (e.g., petroleum) soils (Slater et al. Reference Slater, White, Eglinton and Reddy2005, Reference Slater, Nelson, Kile and Reddy2006; Cowie et al. Reference Cowie, Greenberg and Slater2010; Ahad and Pakdel Reference Ahad and Pakdel2013; Mahmoudi et al. Reference Mahmoudi, Porter, Zimmerman, Fulthorpe, Kasozi, Silliman and Slater2013; Mills et al. Reference Mills, Slater, Dias, Carr, Reddy, Schmidt and Mandernack2013), C3-C4 vegetational successions (Kramer and Gleixner Reference Kramer and Gleixner2006; Yevdokimov et al. Reference Yevdokimov, Larionova and Stulin2013), and long-term experimental sites with leaf litter replacement or field trails of continuously cultivated soils (Rethemeyer et al. Reference Rethemeyer, Kramer, Gleixner, John, Yamashita, Flessa, Andersen, Nadeau and Grootes2005a; Kramer et al. Reference Kramer, Trumbore, Fröberg, Dozal, Zhang, Xu, Santos and Hanson2010). Another recent PLFA-CSRA application is the study of active microbial communities in extreme environments (Ziolkowski et al. Reference Ziolkowski, Wierzchos, Davila and Slater2013).
We hypothesized that the C metabolism of different soil microbes would vary differently with the change of vegetation and climate. Vegetation and climate determine soil microbial C reserve dynamics through their impacts on microbial community composition (fungi, bacteria, and constituents) and carbon resource use of different microbes (carbon resource flexibility). To test this hypothesis, we combined compound-specific 13C and 14C probing approaches of PLFAs to measure soil microbial composition and C resource use along a unique 2267-m elevation gradient on the Tibetan Plateau, China. C3 and C4 plants can provide different microbial carbon source and represented by different microbial 13C signatures. The 14C signatures of microbes are an indicator for their ancient or modern C source.
The Tibetan Plateau, the largest and highest plateau on earth, is one of the regions that has suffered the least anthropogenic perturbation in the world (Xu et al. Reference Xu, Li, Cai, Gai, Li, Christie and Zhang2014). Great uplift with an average elevation (alt.) of 4000 m above sea level (asl) creates a range of climates from tropical to arctic and associated vegetation types. However, this unique geographical environment makes the plateau particularly vulnerable to climate change (Wang et al. Reference Wang, Ouyang, Zhou, Zhang, Song and Tian2005b; Yang et al. Reference Yang, Lu, Wu, Yang, Zhang and Lin2006) and an unmatched region for scientific research about the adaptation of natural ecosystems to climate. For this reason, we selected Mount Gongga (7556 m asl), with an integrated elevation gradient of climatic zones and vegetation types, as the location for our study. The objectives of this research were (1) to investigate the difference in soil microbial community structures with the climatic parameters and soil properties in the vertical gradient, and (2) to identify the soil microbial C resource use in different climatic zones and forest ecosystems.
METHODS
Study Area and Soil Sampling
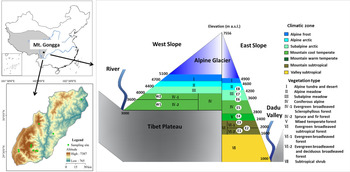
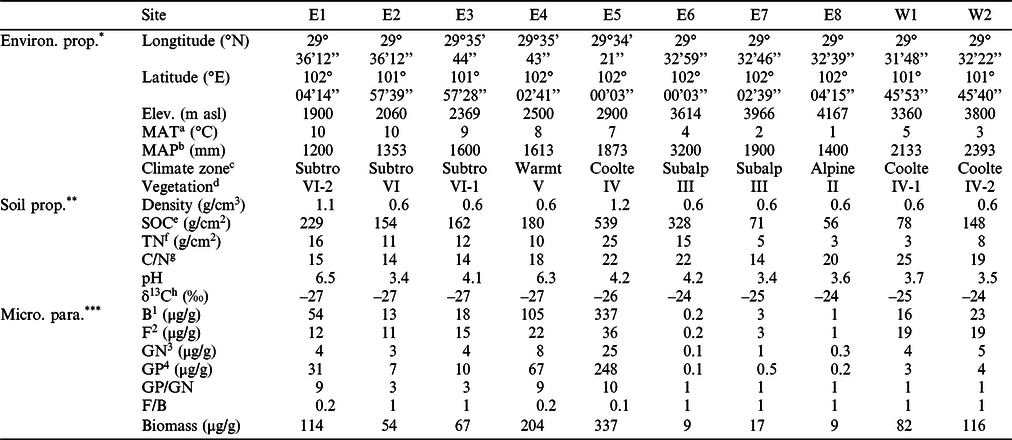
Mount Gongga (29.30–30.30°N, 101.50–102.25°E, 7556 m asl) is the third-highest mountain in China, located on the eastern side of the Tibetan Plateau (Wu et al. Reference Wu, Li, Zhou and Cao2013) (Figure 1 and Table 1). The eastern slopes reach down into the Dadu Valley (1100 m asl) and are strongly impacted by the southwesterly monsoon. It is colder and more humid at comparable elevations than on western slopes which connect into the Tibetan Plateau (3000–3500 m asl) (Thomas Reference Thomas1997) (Figure 1). Climatic differences between east and west slopes result in different distributions of vegetation zones. On the east slope, the elevation gradient (i.e., 6400 m) between the Dadu Valley and the peak of Mount Gongga drives more diverse climatic and vegetation zones than the west slope. Three distinct forest types occur below the tree line on the east slope: evergreen broadleaved forest (1600−2400 m asl), mixed coniferous and broadleaved forest (2400−2800 m asl), and coniferous forest (2800−3600 m asl) (Song Reference Song1987) (Figure 1).
Elevation gradient sampling sites across Mount Gongga climatic zones and vegetation types.

Environment, vegetation, and soil properties with microbial parameters.

* Environ. Info.: environment properties.
** Soil prop.: soil information.
*** Micro. para.: microbial parameters.
a MAT: mean annual temperature.
b MAP: mean annual precipitation.
c Climate zone: subtro: subtropical; warmt: warm temperate; coolte: cool temperate; subalp: subalpine; alpine.
d Vegetation: III Subalpine shrub meadow, IV Mountain dark coniferous forest, IV-1 Sclerophyllous evergreen broad-leaved forest, IV-2 Spruce and fir forest, V mixed coniferous and broad-leaved forest, VI Subtropical evergreen broad-leaved forest, VI-1 Evergreen broadleaved forest, VI-2 Evergreen broadleaved and deciduous broadleaved forest.
e SOC: soil organic carbon inventory.
f TN: total nitrogen inventory (upper 30-cm soil layer, method from Torn et al. 2009).
g C/N: ratio of soil carbon to nitrogen.
h δ13C: δ13C of soil organic C.
1 B: common bacteria.
2 F: fungi.
3 GN: gram-negative bacteria.
4 GP: gram-positive bacteria.
Climate information, mean annual temperature (MAT) and mean annual precipitation (MAP) were obtained from seven meteorological stations set up along an altitudinal gradient by the Alpine Ecosystem Observation and Experiment Station of Mount Gongga. For sites without a meteorological station, we calculated climatic conditions by fitting equations based on yearly climatic data using software New Loc_Clim designed by the Food and Agriculture Organization of the United Nations organization.
Soil sampling was conducted in May 2012 and August 2013. Ten elevations (8 from the east slope and 2 from the west slope) were selected between 2060 and 4167 m asl, each characterized by distinct vegetation zones from lowland subtropical forest to alpine meadow (Figure 1 and Table 1). The classification is based on Chinese government document (GB-T 14721-2010) and organized by Institute of Mountain Hazards and Environment, Chinese Academy of Sciences (Zhong et al. Reference Zhong, Zhang and Luo1999) (Figure 1). Three zones of one evergreen broadleaved subtropical forest (E1, E2, E3), one mixed temperate forest (E4), one coniferous alpine forest (E5), and three alpine meadows (E6, E7, E8) were sampled on the east slope; two subzones of mountain dark coniferous alpine forest (W1, W2) were sampled from the west slope. The west slope has fewer MAP, higher MAT and more C4 plants than the same elevation on the east slope. At each site, after removing the top layer of litter, three soil pits (>5 m apart) were dug using a cleansed stainless-steel spade. We collected soils from the most microbially active soil horizons to extract soil PLFAs (O and A horizons, 0–30 cm). The depth of humus horizon (O horizon) was less than 5 cm in the sampling sites above 3000 m asl, and less than 15 cm in all sampling sites.
An additional kilogram of soil sample for CSRA was also collected from each of the three forest types (evergreen broadleaved subtropical forest with dominant species Liethocarpus cleistocarpus; mixed temperate forest with dominant species Picea brachytyla; coniferous alpine forest with dominant species Abies fabri) on the east slope at the elevations of 1900 (E1), 2500 (E4), and 2900 (E5) m asl
Soil Preparation and Physicochemical Properties Analysis
Each soil sample was a composite of 3 subsamples. The detailed procedures of pretreatment, physical and chemical analysis of soil samples are listed in SI 1.
SOC, DOC Extraction, and Soil PLFA Extraction and Identification
The tube was vibrated for 12 hr and then centrifuged. The upper layer was transferred to a fresh tube to measure the DOC concentration. The analyzed result was used to calculate the soil amount to extract enough DOC content for 14C analysis. A previous methodological experiment demonstrated DOC extraction was not influenced by using water below 80°C (Li2017). The extraction steps above were repeated and the upper layer solution was dried at 60°C to constant weight. The extraction of PLFAs followed the Bligh-Dyer method (Bligh and Dyer1959) and was slightly modified for extracting and collecting individual PLFAs for CSRA from larger sized forest soil samples (SI 2). This included improvement of solution amounts and purification steps suitable for least 500 g of forest soils. Qualitative analysis of resulting PLFA-fatty acid methyl ester fractions (FAMEs) is listed in SI 2.
Compound-Specific 13C Analysis of PLFAs and 13C Analysis of SOC
Compound-specific 13C measurements on FAMEs and 13C analysis of SOC were performed using a GC Agilent 7890 N coupled with an isotopic ratio mass spectrometer (Delta+XL, Finnigan MAT, Germany). The GC oven temperature was programmed from 50°C for 4 min to 155°C at a rate of 15°C/min, and to 230°C at a rate of 1.5°C/min. Subsequently, the oven was heated to 290°C for 2 min at a rate of 15°C /min. The results are expressed in δ13C per mil (‰) against the international standard V-PDB (Werner and Brand Reference Werner and Brand2001).
Isolation and Harvesting of Individual FAMEs
Isolation of individual FAMEs for accelerator mass spectrometry (AMS) 14C measurements was achieved using an Agilent 7890A GC equipped with an Agilent 7693 auto sampler and a flame ionization detector (FID), integrated with a Gerstel CIS 1. Harvesting of individual FAMEs using Agilent gas chromatograph 7890A and a Gerstel PFC (PCGC system), connected with a 30-m-long deactivate capillary (0.32 mm ID × 0.25 μm film). The GC operating conditions were the same as described above. PLFA C14-C18 were abundant in forest soils and thus selected as target FAMEs reaching an orthogonal experimental design for 7 crucial operation parameters in PCGC system (SI 3) (Eglinton et al. Reference Eglinton, Aluwihare, Bauer, Druffel and McNichol1996, Reference Eglinton, Benitez Nelson, Pearson, McNichol, Bauer and Druffel1997; Uchida et al. Reference Uchida, Shibata, Kawamura, Yoneda, Mukai, Tanaka, Uehiro and Morita2000; Mandalakis and Gustafsson Reference Mandalakis and Gustafsson2003; Zhang et al. Reference Zhang, Zhao, Wang, Xu and Zhou2013). The optimum PCGC conditions were as follows: CIS initial temperature (40°C), CIS end temperature (300°C), CIS solvent venting time (0.1 min), CIS heating rate (12°C/min), CIS injection mode (fast mode), PFC trapping temperature (room temperature 30°C), and injection volume (3 μL) (SI 3).
Six types of representative individual PLFAs were isolated from sites E1, E4 and E5. Among them, iC15:0+aC15:0 and C16:1w9 represent common bacteria; C16:0 represents common microbes; brC17 represents related bacillus; cyC17 and cyC19 represent anaerobes (SI Table_2_Supp.). The prefixes i, a, and cy indicate different branching, referring to iso, anteiso, and cyclopropyl, respectively. With the optimum PCGC conditions, the amount of all the six selected individual PLFAs exceeded 50 μg from 500 g soil,satisfied the detection amount limit of 14C analysis (see supplemental materials for Table_4_Supp.).
14C Analysis of Microbial PLFAs, SOC, and DOC
Because the extremely high cost and the difficulty of harvesting a sufficient amount of pure chemicals to meet the detection limit of 14C analysis, we only undertook 14C analysis on 6 kinds of relatively abundant microbial PLFAs, SOC, and DOC for soil samples from three sampling sites representing three main forest types on the east slope, to provide an original exploration of natural microbial carbon signatures in this natural elevation-forest gradient. Combustion and graphitization of lipid fractions, isolated FAMEs, SOC, and DOC were performed at State Key Laboratory of Isotope Geochemistry, Guangzhou Institute of Geochemistry (Chinese Academy of Sciences) using a published procedure (Ding et al. Reference Ding, Shen, Wang, Yi, Ding, Fu, Liu and Zhou2010). The graphitized samples were measured by an AMS facility in the State Key Laboratory of Nuclear Physics and Nuclear Technology (Peking University) with a precision better than 0.5‰. All the analyses were performed in triplicate.
14C data were reported as Δ14C values per mil relative to the 14C activity of the oxalic acid standard with 1-σ measurement uncertainty (Reimer et al. Reference Reimer, Brown and Reimer2004; Stuiver and Polach Reference Stuiver and Polach2006). Negative Δ14C values correspond to 14C levels before 1950 whereas positive Δ14C values indicate the contribution of 14C derived from atmospheric nuclear weapons testing in the 1950s and 1960s to the samples. An additional blank sample was strictly proceeded with the same PLFA extraction steps, followed by the isolation steps on PCGC with same retention time and radiocarbon analytical steps on AMS with the soil samples. The background 14C and the added methyl 14C during methylation need to be removed from the 14C content of the FAMEs to obtain the Δ14C value of the PLFAs by Equation (1):
 $${\Delta ^{14}}{{\rm{C}}_{PLFA}} = {{N{\rm{*}}\left( {{\Delta ^{14}}{{\rm{C}}_{FAME}} - {\Delta ^{14}}{{\rm{C}}_{blank}} - {\Delta ^{14}}{{\rm{C}}_{MeOH}}} \right)} \over {N - 1}}$$
Here, Δ14C PLFA is the 14C content of the PLFAs, and Δ14C FAME is the 14C content of the FAMEs. Δ14C MeOH is the 14C content of methanol used for derivatization and N is the number of carbon atoms of the FAMEs. During the extraction, methylation of PLFAs, and separation/isolation of FAMEs, neither isotope fractionation for 13C and 14C nor background contamination of the samples was observed (Kramer and Gleixner Reference Kramer and Gleixner2006).
C Age and Turnover Rates of SOC and DOC
The C age of SOC and DOC was calculated using the CALIBomb program with the NH_zone2 dataset (Hua et al. Reference Hua, Barbetti and Rakowski2013) bounded in the north by latitude ~40°N and in the south by the mean summer intertropical convergence zone.
SOC separated by density fractionation generally are found to display a similar isotope pattern as the total SOM (Rethemeyer et al. Reference Rethemeyer, Kramer, Gleixner, John, Yamashita, Flessa, Andersen, Nadeau and Grootes2005), illustrating that the soil C pool could be considered as a steady C pool. Plant C including plant litter C, plant rhizospheric C, and some relatively modern C has heavier 14C isotope signatures due to access to atmospheric CO2 (Kramer et al. Reference Kramer, Trumbore, Fröberg, Dozal, Zhang, Xu, Santos and Hanson2010; Mendez-Millan et al. Reference Mendez-Millan, Nguyen Tu, Balesdent, Derenne, Derrien, Egasse, Thongo M’Bou, Zeller and Hatte2014). Accordingly, we calculated the SOC and DOC turnover rates based on 14C values and Cherkinsky and Brovkin’s model (Stuiver and Polach Reference Stuiver and Polach1977). The atmospheric radioactivity of every simulated year and SOC is obtained from published references (Burchuladze et al. Reference Burchuladze, Chudý, Eristavi, Pagava, Povinec, Šivo and Togonidze1989; Levin and Kromer Reference Levin and Kromer1997; Levin and Hesshaimer Reference Levin and Hesshaimer2000) and calculated from SOC Δ14C (Chen et al. Reference Chen, Sun, Shen, Peng, Yi, Li and Jiang2002; Wang et al. Reference Wang, Ouyang, Zhou, Zhang, Song and Tian2005b).
Statistical Analyses
Correlation analysis was conducted using SPSS for Windows (ver. 20.0; SPSS Inc., Chicago, IL, USA). One-way ANOVA and multivariate analysis of variance (MANOVA) were used to examine the significance of differences and variability at the 95% confidence level (P < 0.05), respectively. Redundancy analysis (RDA) was performed by the “Bioenv” function in the “vegan” package (vegan v2.4-4) of R software (R Development Core Team, Vienna, Austria), using UniFrac weighting and the normalized distance matrix with default parameters.
RESULTS
Environmental Parameters and Soil Physicochemical Properties
As elevation increased, MAT declined (from 10°C to 1°C, Table_1_supp.) and MAP increased (from 1200 mm to 3200 mm; Table 1 and Figure 1). In general, SOC and total N (TN) were higher in forests (148–539 g/cm2 and 3–25 g/cm2, respectively) than in alpine meadows (56–328 g/cm2 and 3–15 g/cm2, respectively) (Table 1). The highest SOC and TN content was found in the forest-meadow transition area (coniferous forest, E5:539 g/cm2 and 25 g/cm2, respectively; subalpine meadow E6: 328 g/cm2 and15 g/cm2, respectively) on the east slope. The lowest SOC and TN values were found in the highest elevation alpine meadow (E8: 56 g/cm2 and 3g/cm2, respectively) on the east slope. This distribution was consistent with the MAP pattern (Table 1). SOC and TN results from the west slope (W1: 78 g/cm2 and 3 g/cm2, respectively; W2: 148 g/cm2 and 8 g/cm2, respectively) were lower than that in similar elevation in the east slope (E5: 539 g/cm2 and25 g/cm2, respectively; E6: 328 g/cm2 and15 g/cm2, respectively). The average SOC and TN inventory of coniferous forest (E5, W1, and W2) and broad-leaved forest soils (E1, E2, and E3) was close (Table 1). The highest ratio of C and N (C/N) was found in the coniferous forests (W1: 25, E5: 22) and subalpine meadow (E6: 22), while the alpine meadow had the lowest C/N (E7: 14). All soil samples in Mount Gongga were acid (pH=3.4–6.5) across the elevation gradient (Table 1).
Soil Microbial Biomass and Structure
Overall, PLFA results indicated varying amounts of bacteria (2–52%) and fungi (2–23%) across the elevation gradients (Table 1). Microbial biomass was highest in the coniferous forests (82–116 μg/g), followed by the mixed forest (93 μg/g) and the broadleaved forest (54–76 μg/g), all significantly higher than that in the meadow (9–12 μg/g) (Table 1). The ratios of soil fungi to bacteria (F/B) were 0.1–1.3 across the gradient (Table 1), higher in dark coniferous forest (1.0) and meadow soils (1.0) than in other forests.
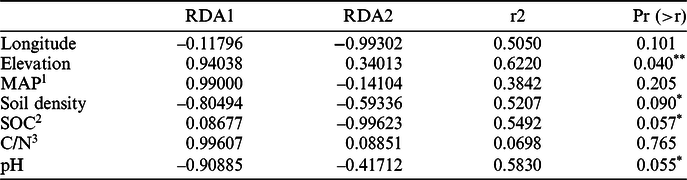
RDA attempted to explore the potential environmental factors (longitude, latitude, MAT, MAP, and soil abiotic parameters including soil density, moisture, pH, SOC, TN, C/N, and TP) driving microbial change (Table 2). The results suggested that elevation, soil density, SOC and C/N displayed significant correlations with PLFA concentrations.
Results of redundancy analysis. Environmental variables, soil properties thatcorrelated with the PLFA concentrations. Permutation: free; number of permutations: 999.

* Correlation is significant at the 0.1 level.
** Correlation is significant at the 0.05 level.
1 MAP: mean annual precipitation.
2 SOC: soil organic carbon inventory.
3 C/N: ratio of soil carbon to nitrogen
13C Values of PLFAs
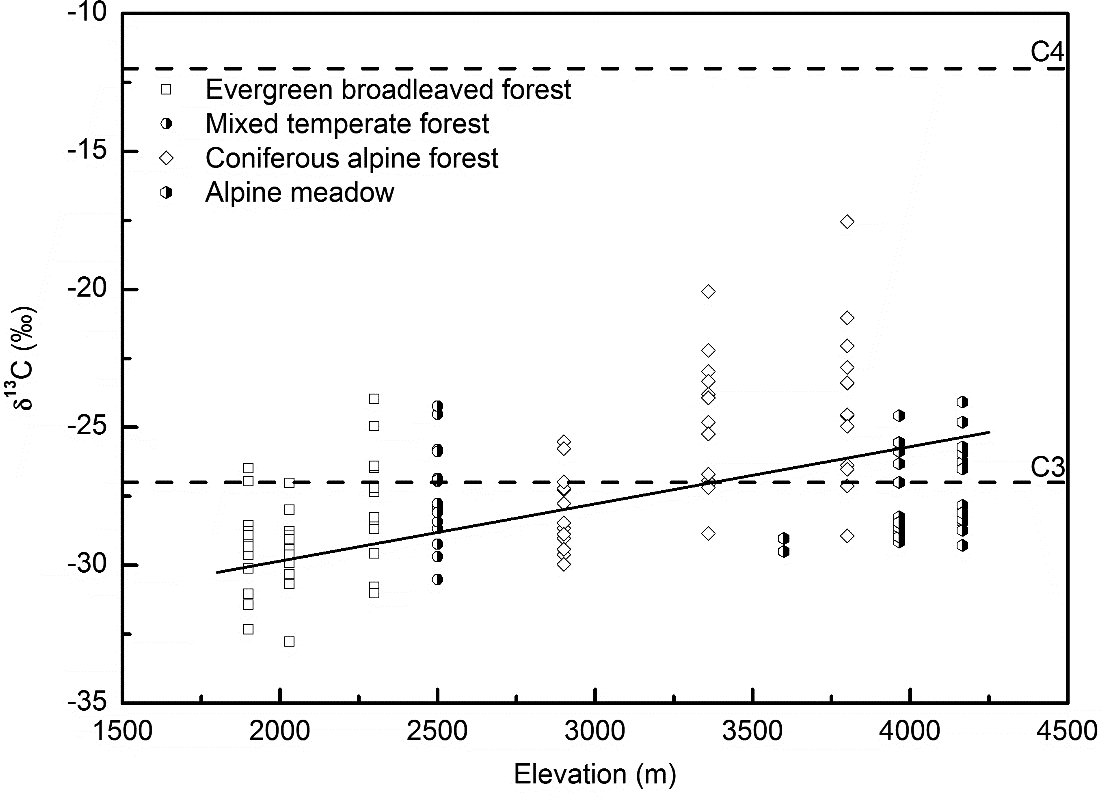
δ13C of 16 representative PLFAs varied from –33‰ to –17‰, suggesting a difference in microbial C3 to C4 plant resource use across vegetation types (evergreen broadleaved subtropical, mixed temperate, coniferous alpine forest, and alpine meadow) (Figure_10_Supp., Figure 2). In general, δ13C of PLFAs ranged between –32‰ to –25 ‰, reflecting C3 plant dominance, i.e., δ13C ≈–29‰, consist with δ13C of plants investigation (–31‰ to –25‰) on the same elevation of Mount Gongga (Wang et al. Reference Wang, Iv, Wu, Chu, Han, Wu, Wu and Gu2004a). The most abundant bacterial PLFAs (iC15:0, aC15:0, and C16:1w9) were found in all soils of different vegetation types, and their δ13C ranked as coniferous alpine (west slope) > alpine meadow > coniferous alpine (east slope) > mixed temperate > evergreen broadleaved subtropical (Figure 2). Together with the PLFAs mentioned above, 13C values of anaerobe-representative cyclopropyl PLFAs (cyC17 and cyC19) and bacillus-representative branched chain PLFAs (brC16 and brC17) in forest soils followed the rank: coniferous alpine > mixed temperate > evergreen broadleaved subtropical (Figure 2). As elevation, MAT and MAP were significantly intercorrelated, they all showed considerable significant relationships with PLFA δ13C variation (Figure 2; Table_1_Supp.). The13C values of PLFAs representing bacteria (C14:0, iC15:0andC16:1w9c) and bacillus (brC16 and brC17) exhibited higher variance than other PLFAs (over 5‰) across all vegetation types (Figure 2).
Compound-specific 13C values of soil microbial PLFAs across the elevation gradient (R2=0.9017 p < 0.001).

Compound-Specific 14C Values of Forest Soil PLFAs and 14C Values of SOC
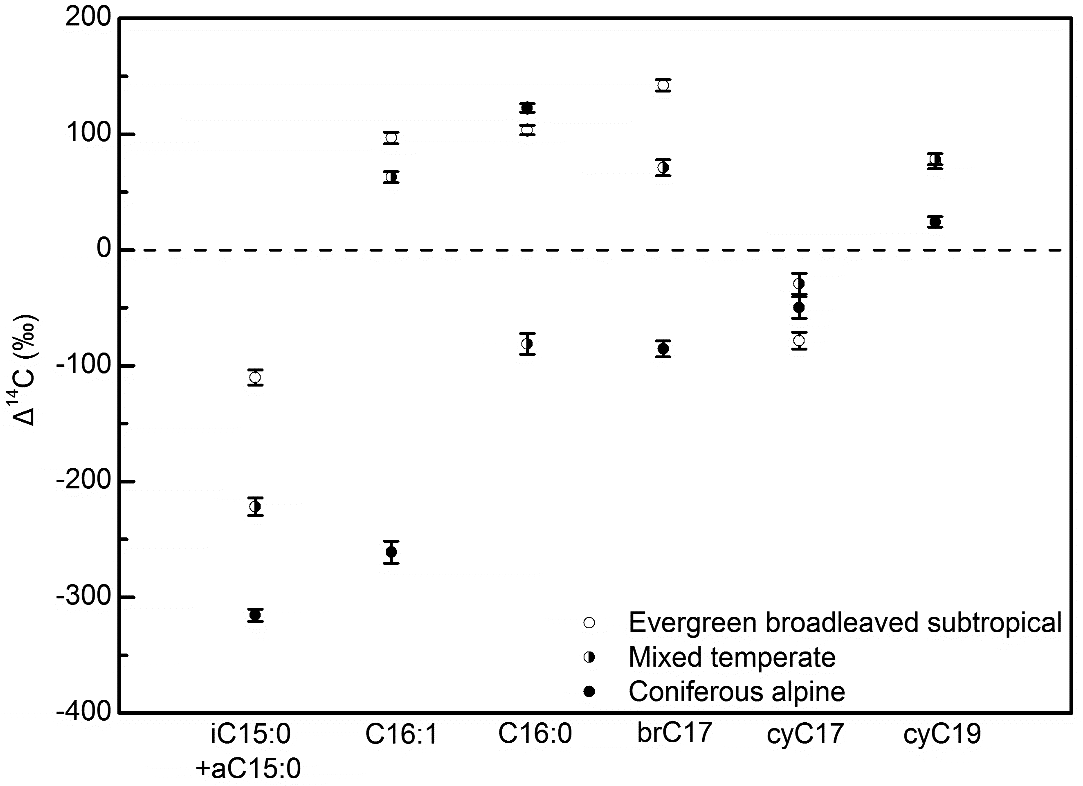
Δ14C of PLFA and C age of SOC and DOC calculated from the Δ14C allow us to estimate the C resource use and variation with microbial isotopes along the elevation gradient (Figure 3 and Table 4). Results showed a huge 14C value variation (–315~132‰), revealing an obvious disparity of microbial C sources from modern to pre-nuclear weapons testing age among different forest soils (Figure 3). The Δ14C of TOC and DOC were similar and always positive, showing no significant difference among three forest types (75~156‰; Tables 3 and 4).
Compound-specific 14C values of soil microbial PLFAs across three forest types on Mount Gongga.

Δ14C, C age, and C turnover rate of SOC and DOC across three forest types in Mount Gongga.

a SOC: soil organic carbon.
b DOC: dissolved organic carbon.
1 CY: calibrated year (BP: pre-bomb, 2σ: confidence, dataset from Hua et al. Reference Hua, Barbetti and Rakowski2013).
2 TR: C turnover rates of SOC and DOC (k = 1/turnover time [yr] method from Wang et al. Reference Wang, Ouyang, Zhou, Zhang, Song and Tian2005b).
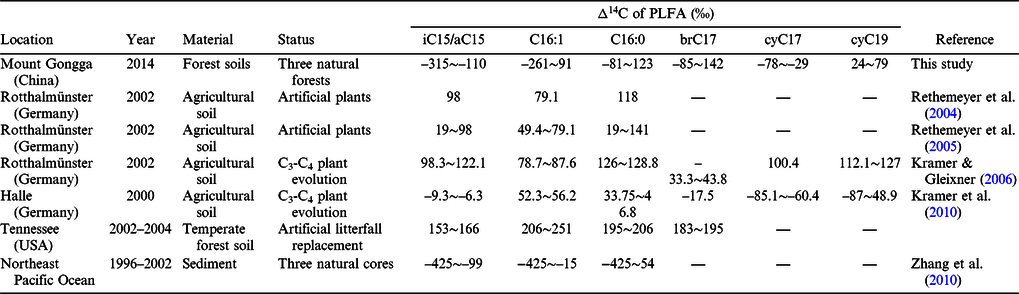
Δ14C of microbial PLFAs in global different natural ecosystems.

The Δ14C values of common microbes C16:0 and anaerobes cyC17 and cyC19 PLFAs showed no significant difference among different forest types. The Δ14C values of PLFAs representing bacteria (i/a C15, C16:1w9) and bacillus (brC17) ranged from positive to negative across forest types, decreasing with elevation. The Δ14C difference among the three forest types was largest in bacterial C16:1w9, followed by bacillus (brC17) and common bacteria (C15), common microbes (C16:0), and anaerobes (cyC17 and cyC19) (Figure 3). Microbial pre-bomb C (Δ14C < 0‰) varied more than microbial post-bomb C (Δ14C > 0‰) across three forest types. SOC turnover rate did not vary much between the three forest types, but DOC turnover rate decreased with elevation (Table 4).
DISCUSSION
Environmental Influences on Microbial C Resource Use
It is known that soil C and N content is influenced by both climate and vegetation (Wang et al. Reference Wang, Ouyang, Zhou, Zhang, Bai and Peng2004b), and that resultant SOM influences soil microbial community structure (Smith et al. Reference Smith, Marín-Spiotta, Graaff and Balser2014). In the present study, we found a positive correlation between SOC and TN content across all sampling sites (Table_1_Supp.). This is consistent with previous results from Mount Gongga (Wang et al. Reference Wang, Ouyang, Zhou, Zhang, Bai and Peng2004b). Differences across the climate-vegetation gradient also influenced microbial plant C resource use, as reflected by the δ13C pattern of PLFAs (Figure 2). C4 vegetation is known to be more productive in warm habitats with sufficient sunlight and moderate water content (Wang et al. Reference Wang, Han, Zhou, Xiong and Wu2005a). Topographical differences resulted in less precipitation, higher temperatures and more C4 plants on the west slope than at the same elevation on the east slope. Additionally, conditions in the high elevation east slope meadow areas are generally more suitable for C4 plant growth compared with the cold and moist environment in the low elevation east slope forest areas (Sage and Sage Reference Sage and Sage2002; Su et al. Reference Su, Xie and Zhou2011; Wang et al. Reference Wang, Iv, Wu, Chu, Han, Wu, Wu and Gu2004a). Existing evidence confirms that C4 plants are rare above 2000 m asl on the east slope of Mount Gongga (Li et al. Reference Li, Wang and Liu2009) whereas there are C4 plants at 4250 m asl on the Tibetan Plateau (Wang et al. Reference Wang, Iv, Wu, Chu, Han, Wu, Wu and Gu2004a). In our results, the δ13C values of most microbial PLFAs (–32‰ to –25‰) reflected the δ13C signature of dominant C3 plants on Mount Gongga (–31‰ to –25‰) (Li et al. Reference Li, Wang and Liu2009), while the δ13C of PLFAs in the coniferous forest on the west slope and meadow on the east slope reflected the presence of C4 plants (Figure 2). The positive correlation between the δ13C values of SOC and elevation in our study provided evidence for such a C3-C4 plant distribution (Table_1_Supp.). Other work has shown that the δ13C values of C3 plants above 2000 m asl on the east slope of Mount Gongga are linearly positively correlated with the elevation (Li et al. Reference Li, Wang and Liu2009). Likewise in the present work, the δ13C values of forest microbial PLFAs were linearly and positively correlated with the elevation (Figure 2). Additionally, the PLFA structure is most correlated with elevation in this study (Table 2), suggesting that vegetation conversion in the elevation gradient altered the microbial metabolism of plant carbon source through modifying soil microbial structures. Thus, the δ13C pattern of microbial PLFAs strongly reflected the C3-C4 plant distribution across this natural climate-vegetation gradient.
Soil Microbial C Resource Use across Natural Forest Gradient
In forest ecosystems, there are many potential C resources for microbes, e.g., organic C from plant litter, plant rhizospheric C and native soil C (Kramer et al. Reference Kramer, Trumbore, Fröberg, Dozal, Zhang, Xu, Santos and Hanson2010; Schwab et al. Reference Schwab, Nowak, Elder, Trumbore, Xu, Gleixner, Lehmann, Pohnert, Muhr, Küsel and Totsche2019). Our results suggest that bacteria (PLFAs iC15 and aC15) were assimilating ancient C, with the Δ14Cvalues decreasing with forest elevation. This finding corresponds with previous observations of bacterial Δ14C (C15) in a natural ocean sediment (Zhang et al. Reference Zhang, Xu, Aziolkowski, Rsouthon, Santos and Etrumbore2010). In this study, bacterial PLFAs of C16:1w9 tended to use modern C in the mixed temperate forest, but ancient soil C in coniferous alpine forest ecosystems. The same phenomenon was observed in bacillus PLFA of brC17, but with a higher Δ14C value (Figure 3). This reflected the importance of climate as a regulator of productivity, decomposition and microbial access to C resources for both bacteria and actinomycetes. C16:0 PLFA is common to most soil microbes, and thus its Δ14C values reflect the range of C sources used by the microbial community (Keinänen et al. Reference Keinänen, Martikainen, Korhonen and Suutari2003; Pelz et al. Reference Pelz, Chatzinotas, Andersen, Bernasconi, Hesse, Abraham and Zeyer2001). Our results showed that soil microbes in evergreen broadleaved and coniferous alpine forest used a higher proportion of modern C than microbes in mixed temperate forest. This might be attributable to significant differences in vegetation composition and associated C inputs. In mixed temperate forest, the moderate temperature compared with that in broadleaved and coniferous forest in the elevation gradient might influence the balance of the plant litter decomposition and microbial metabolism into SOC, and finally changed the 14C signature of common microbes. Anaerobes (PLFAs of cyC17and cyC19) tended to use modern C, irrespective of forest types, indicating their preference for more recent C inputs. The changed Δ14C pattern of PLFAs (i/a C15, C16:1, and brC17) suggested that the source of microbial C resource was older in coniferous alpine forest than in other forest types. Considering the lower MAT (5.7°C) and the higher SOC stock (538.6 g/cm2; Figure 1) in coniferous alpine forest soils, it might be attributing to higher input of surface biomass and low bacterial activity as soils are frozen over a long period of time (Hagedorn et al. Reference Hagedorn, Gavazov and Alexander2019), microbes in coniferous alpine forest tend to use older SOC reserves.
Microbial C Metabolism Flexibility in Different Ecosystem
The differences in the Δ14C values of PLFAs observed across the forest gradient represented the changes in C resource use and, thus, offered information about the microbial C metabolism flexibility. We compared the Δ14C values of six PLFAs representing different microbes with previous studies on a range of ecosystems including a C3-C4 transition (Kramer and Gleixner Reference Kramer and Gleixner2006), agricultural soils (Rethemeyer et al. Reference Rethemeyer, Kramer, Gleixner, John, Yamashita, Flessa, Andersen, Nadeau and Grootes2005; Rethemeyer et al. Reference Rethemeyer, Kramer, Gleixner, Wiesenberg, Schwark, Andersen, Nadeau and Grootes2004), an artificial litterfall replacement experiment (Kramer et al. Reference Kramer, Trumbore, Fröberg, Dozal, Zhang, Xu, Santos and Hanson2010) and sediment (Zhang et al. Reference Zhang, Xu, Aziolkowski, Rsouthon, Santos and Etrumbore2010) (Table 4). These studies suggested that microbial C metabolism varied across different ecosystems due to the change in C resource use environments. In reported soil ecosystems, the Δ14C-variation (–315~251‰) of PLFAs with 14C signatures decreased with elevation (i/a C15, C16:1 and brC17) is also bigger than the Δ14C-variation (–87~206‰)of PLFAs with no difference (C16:0, cyC17, and cyC19) in our study (Table 4).
In our study and a previous study in ocean sediment, the Δ14C value of i/a C15 is always reported as <0‰, indicating that this bacterial C metabolism remains pre-bomb C (Zhang et al. Reference Zhang, Xu, Aziolkowski, Rsouthon, Santos and Etrumbore2010) (Table 4). The Δ14C values of C16:1w9 and brC17 in reported soil ecosystems changed significantly (i.e., 350‰ and 220‰), indicating the considerable microbial C metabolism flexibility of bacteria and bacillus related with two PLFAs across different ecological environments (Table 4).
The lower Δ14C-variation (–81~206‰) of C16:0 among different soils is speculatively caused by its high representative of different microbes. The Δ14C values of anaerobes representative cyC17and cyC19 biomarkers varied by <50‰, suggesting a narrower specificity of C metabolism reflected by larger differences in their abundances across ecosystems (Table 4).
CONCLUSIONS
Bacteria and bacillus represented by C16:1 and brC17 both showed a more flexible microbial C metabolism across the climatic zones and vegetation types (Figures 2 and 3, Table 4). This indicates their potential as regulators of terrestrial carbon cycling as climate change warms these ecosystems. Besides, microbial pre-bomb C (Δ14C < 0‰) varied more than microbial post-bomb C (Δ14C > 0‰) across different forest types (Figure3), revealing that microbes using ancient C were more “flexible” than microbes using younger C, possibly contributing to the greater sensitivity of the old soil organic C pool to temperature (Hilasvuori et al. Reference Hilasvuori, Akujarvi, Fritze, Karhu, Laiho, Makiranta, Oinonen, Palonen, Vanhala and Liski2013). Our findings reveal specific C source differences between and within soil fungal and bacterial groups across forest ecosystems that could have implications for their resilience to future climate change.
ACKNOWLEDGMENTS
This work was funded by the Local Innovative and Research Teams Project of Guangdong Pearl River Talents Program (2017BT01Z134), the Guangdong Foundation for Program of Science and Technology Research (2019B121205006), and the State Key Laboratory of Organic Geochemistry, GIGCAS (No. SKLOG 2020-4). The authors declare no competing interests.
Supplementary material
To view supplementary material for this article, please visit https://doi.org/10.1017/RDC.2021.57