It has been estimated that over 170 million people worldwide have been infected with the hepatitis C virus (HCV) (1), and HCV infection is the most common cause of liver transplantation (Reference Poynard, Yuen, Ratziu and Lai24;Reference Sharma and Lok26). The burden of the disease is large and is predicted to increase over the next decade (15;Reference Sweeting, De Angelis, Brant, Harris, Mann and Ramsay29;Reference Wong, McQuillan, McHutchison and Poynard34). Multinational randomized controlled trials (RCTs) have found that a combination of pegylated interferon and ribavirin is effective in achieving a sustained virological response (SVR) for at least 40 percent of cases with genotype 1 and 75 percent of cases with genotype non-1 (Reference Castelnuovo, Thompson-Coon and Pitt7;Reference Fried, Shiffman and Reddy12;Reference Hadziyannis, Sette and Morgan14;738). Subsequent cost-effectiveness studies have used these SVRs in economic models, and concluded that combination therapy is cost-effective for patients with chronic hepatitis C (Reference Shepherd, Jones and Hartwell27;Reference Siebert and Sroczynski28). Based partly on evidence from these studies, National Institute for Health and Clinical Excellence (NICE) recommended that combination therapy should be provided for all patients with chronic hepatitis C (21).
However, cost-effectiveness estimates based on multinational RCTs may not reflect the costs and cost-effectiveness of providing antiviral therapy in routine clinical practice. Policy makers such as NICE also require cost-effectiveness studies that provide realistic estimates of the value of delivering interventions in “real-world” settings. A further issue is that, although antiviral therapy is recommended for all patients with chronic hepatitis C, it may be that there are particular subgroups for whom antiviral treatment is not cost-effective. Whereas previous cost-effectiveness studies have shown that antiviral therapy is more cost-effective for patients with genotype non-1, further subgroup analyses have been limited (Reference Grieve, Roberts and Wright13;Reference Wong, Poynard, Ling, Albrecht and Pauker35).
This study aims to examine the cost-effectiveness of providing pegylated interferon and ribavirin for different patient subgroups based on costs and outcomes observed in routine clinical practice. The study uses data from the Trent HCV cohort study, a large observational study that includes a range of subgroups of patients with chronic hepatitis C (Reference Ryder, Irving, Jones, Neal and Underwood25). A key advantage of this data set is that it only comprises patients who attend nontertiary referral centers and is representative of the care provided in a large UK regional population. Using data from this study may therefore provide realistic estimates of the cost-effectiveness of providing the antiviral treatment in routine practice for different patient subgroups.
METHODS
Overview
This study evaluated the cost-effectiveness of antiviral treatment with pegylated interferon and ribavirin compared with no treatment for different patient subgroups. The treatment group considered for inclusion all treatment naive patients in the Trent HCV Cohort who have been treated with combination therapy with pegylated interferon and ribavirin. Individuals with HIV co-infection, hemophilia, or end-stage renal disease were excluded. To allow outcome to be assessed, only those patients who completed treatment in time to have a 6 months post-treatment PCR taken before the end of April 2006 were entered into the current analysis. No further selection criteria were applied and 347 cases met the inclusion criteria. Of these patients 33 percent had genotype 1 and 59 percent had intravenous drug use as their main risk factor for HCV, but very few patients (n = 3) were current injectors. Further details of the patient sample are given in Supplementary Table 1 (which can be viewed online at www.journals.cambridge.org/thc) and in Thomson et al. (Reference Thomson, Kwong and Ratib33). A total of 32 cases were excluded (25 without liver biopsy data, and 7 cases with missing data on the dosage of pegylated interferon), leaving 315 patients for analysis.
The treatment regimen aimed to follow NICE guidelines (20;21): patients were treated with either pegylated interferon-α2a 180 mg weekly (Pegasys; Roche) or pegylated interferon-α2b 1.5 mg/kg (Viraferon; Schering Plough) and ribavirin (Copegus; Roche or Rebetol, given per weight according to license). Local protocols allowed some deviation from this general guidance, for example in encouraging patients with cirrhosis to have antiviral therapy for 52 weeks. The no-treatment groups were assumed to have visits and investigations associated with routine monitoring as reported in a recent NHS health technology assessment (Reference Wright, Grieve, Roberts, Main and Thomas37).
The subgroups of interest for the cost-effectiveness analysis were specified in advance. The choice of groups was guided by evidence identifying the key factors associated with SVR and disease progression. HCV genotype, baseline viral load, presence of bridging fibrosis/cirrhosis, and age are independent predictors of treatment outcome (Reference Fried, Shiffman and Reddy12;Reference Hadziyannis, Sette and Morgan14;Reference Manns, McHutchison and Gordon17), while sex, age at infection, age at biopsy, and alcohol use are associated with the rate of fibrosis progression (Reference Poynard, Mathurin and Lai23;Reference Sweeting, De Angelis and Neal30;Reference Tanaka, Kumada and Ikeda31;Reference Wright, Goldin and Fabre36). In the Trent data set, information was available to examine the cost-effectiveness of antiviral therapy by the following patient subgroups: HCV genotype (1 versus non-1), baseline fibrosis stage (defined based on the Ishak scale for fibrosis where 0–2 is categorized as mild disease, 3–5 as moderate disease and 6 as cirrhosis), age at presentation for treatment (30 versus 40 versus 50 years old), and sex.
A Markov decision model simulated the lifetime costs and outcomes associated with antiviral treatment compared with no treatment for each patient subgroup. This cohort model makes the same methodological assumptions as a previously described cost-effectiveness model (Reference Grieve, Roberts and Wright13). The model's structure was extended to allow for comprehensive subgroup analyses and to incorporate new data from the Trent HCV cohort study on the effectiveness and costs of antiviral therapy. For each subgroup of patients the model followed the two hypothetical cohorts through a series of health states until death from liver disease or other causes (Supplementary Figure 1, which can be viewed online at www.journals.cambridge.org/thc). In each annual cycle, patients faced a probability of staying in the same health state, moving to the subsequent one, or dying. Each treatment cohort was assigned a probability of having a SVR. Patients that reached the SVR state no longer progressed. The life-years accumulated in each health state were multiplied by the costs and health-related quality of life (HRQOL) associated with that state. The model estimated the average quality-adjusted life-years (QALYs) and costs over the lifetime for the treatment and no-treatment cohorts, for each of the subgroups described.
Effectiveness and Natural History Data
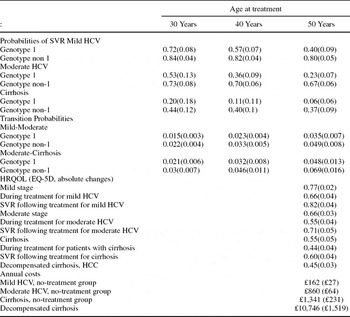
The data on the SVRs after antiviral therapy for different patient groups were obtained from the Trent HCV database. The Trent HCV cohort based study assessing the effectiveness of pegylated interferon and ribavirin has been reported in detail elsewhere (Reference Thomson, Kwong and Ratib33). Data from a sample of 315 patients were available for the analysis. Multivariate logistic regression analysis was used to estimate the independent effect on SVR of the following variables: sex, viral genotype (1 versus non-1), and disease stage (mild, moderate, cirrhosis) at the beginning of treatment. The coefficients obtained from the regression analysis were then used to predict the probability of a SVR for each subgroup of interest in the cost-effectiveness analysis (see Appendix 1). The predicted probabilities of a SVR ranged widely across the subgroups (Table 1), from 0.06 for 50-year-old patients with cirrhosis and genotype 1 to 0.84 for 30-year-old patients with mild disease and genotype non-1.
Input Parameters, Mean (SE)

SVR, sustained virological response; HCV, hepatitis C virus; HCC, hepatocellular carcinoma; HRQOL, health-related quality of life.
The probabilities of progressing from mild disease to cirrhosis were estimated by analyzing longitudinal data from the Trent database as performed in Sweeting et al. (Reference Sweeting, De Angelis and Neal30). The Trent database was chosen because there is no tertiary referral liver center within the region, and therefore the estimates of disease progression will be representative of progression rates of patients presenting for treatment in the UK more generally (Reference Fried, Shiffman and Reddy12). The models estimated the transition probabilities between these early stages, adjusted for age at infection, biological age, alcohol use, genotype, and sex, for each subgroup of interest in the cost-effectiveness analysis. The key transition probabilities in the model are presented in Table 1. Transition probabilities to subsequent stages were taken from the study by Fattovich et al. and from a UK multicenter liver transplantation study (Reference Fattovich, Giustina and Degos10;Reference Wright, Grieve, Roberts, Main and Thomas37).
Costs and HRQOL
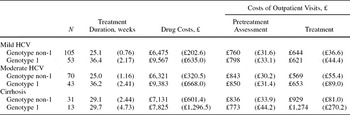
The cost measurement took a health service perspective and measured inpatient and outpatient costs directly attributable to HCV. To enable accurate assessment of the costs and outcomes associated with antiviral treatment and “no treatment,” the model used input parameters based on patient-level data collected alongside routine clinical practice. The costs for the “no treatment” cohort are reported in Table 2. For the treatment cohort, data on the duration and dosage of antiviral treatment were available for 315 patients from the Trent HCV database. Complete data on the number of outpatient visits, day cases, and patients' admissions to inpatient departments during treatment and the first 6 months of follow-up were obtained from five of the study hospitals (n = 227). Details of outpatient visits (doctor and nurse-led) were collected from patients' case-notes and nurses' diaries. Dates and duration of patients' inpatient admissions were retrieved from hospital databases. The drug unit costs were taken from the British National Formulary (5). All other unit costs were taken from a previous study (Reference Grieve, Roberts and Wright13). Data on resource use and unit costs were combined to give the costs of assessment for treatment, antiviral treatment, monitoring costs, and follow-up costs in the 6 months post-treatment for each subgroup. All costs were adjusted to 2006–07 prices using appropriate price indices (Reference Curtis8). The main cost results were converted into U.S. dollars and euros using 2007 annual average exchange rates (£: $2.00 or €1.46) to assist with the interpretation of the results (2).
Costs of Antiviral Treatment, Mean (SE)

HCV, hepatitis C virus.
HRQOL estimates for patients at each stage of the disease were taken from Grieve et al. and Longworth and Bryan. (Reference Grieve, Roberts and Wright13;Reference Longworth and Bryan16). These studies recorded each patients' HRQOL using the Euroqol (EQ-5D) questionnaire, which records HRQOL on a scale from 0 (dead) to 1 (perfect health) (Table 2).
Cost-Effectiveness Analysis
The model estimated the total costs per patient and total lifetime QALYs for the treatment and no-treatment cohorts. Future costs and outcomes were discounted at the recommended rate of 3.5 percent per annum (19). The results of the analysis were presented as incremental cost-effectiveness ratios (ICER) expressed as cost per QALY, the difference between treatment and no-treatment groups in mean lifetime costs divided by the corresponding differences in QALY gains. This was reported for each patient subgroup. Multivariate Monte Carlo sensitivity analyses were undertaken to consider the sampling uncertainty around the mean estimates. These simulations were undertaken by re-sampling 5,000 times from the appropriate input distributions for each model parameter (beta distributions for probabilities and HRQOL, gamma distributions for costs). The results from these simulations were used to report cost-effectiveness acceptability curves (CEAC) (Reference Briggs3;Reference Briggs4). CEACs show the probability that an intervention is cost-effective for different levels of willingness to pay for the cost per QALY gained. For example, NICE has stipulated that it regards interventions that have a cost per QALY of less than £20,000 to £30,000 [$40,000 to $60,000 or €29,200 to €43,800] per QALY as relatively cost-effective. However, NICE guidance for cost-effectiveness studies requires that the analysts report the probability that the intervention is cost-effective for a range of cost per QALY thresholds (e.g., from 0 to £100,000 per QALY).
Methodological Sensitivity Analysis and Threshold Analysis
To investigate the robustness of the cost-effectiveness estimates to assumptions made in the base-case model, the following sensitivity analyses were performed.
• Changes in HRQOL following SVR. HRQOL estimates for patients following an SVR were only available for patients with mild disease. In the base-case analysis, it was assumed that patients with moderate disease or cirrhosis had the same absolute gain in HRQOL as patients with mild disease. The sensitivity analysis examined whether the results changed if instead it was assumed that following a SVR, the relative gain in HRQOL was the same across disease stages.
• Monitoring following SVR. The base-case analysis assumed that patients with cirrhosis were followed-up for 5 years following an SVR, whereas patients in the precirrhosis health states were followed up for 2 years following a SVR. The sensitivity analysis examined the impact of extending these follow-up periods to 5 years for the precirrhosis health states and to lifetime monitoring for patients having a SVR following cirrhosis.
• Unit costs. The base-case analysis applied cost data for the “no treatment” stages from the UK mild hepatitis C study, which included centers with relatively high unit costs. To examine the impact of lower unit costs, the unit costs for all disease stages were reduced by 30 percent.
• Increased all-cause death rates for patients with cirrhosis. The base-case analysis followed the approach taken in previous cost-effectiveness models and assumed that the all-cause death rates for patients with hepatitis C were the same as for the general population. However, to test whether the results were robust to patients with cirrhosis having a higher probability of all-cause death, this rate was doubled in the sensitivity analysis (Reference Castelnuovo, Thompson-Coon and Pitt7).
• Reduced probability of Hepatocellular Carcinoma for non-SVR. The base-case analysis assumed that those patients who received antiviral treatment but did not have an SVR had the same probability of progression from cirrhosis to hepatocellular carcinoma (HCC) as the no-treatment cohort. Antiviral treatment for patients with cirrhosis may be associated with a reduction in the probability of progressing to HCC even in the absence of a SVR (Reference Nishiguchi, Shiomi and Nakatani22). The sensitivity analysis tested the impact of reducing the probability of progression to HCC following antiviral treatment for patients with cirrhosis.
RESULTS
The mean duration of antiviral treatment for all cases included in the study was 36 weeks for patients with genotype 1 and 25 weeks for patients with genotype non-1 (Table 2). For patients with mild or moderate disease and genotype 1, treatment duration was on average 11 weeks longer than for patients with genotype non-1. For patients with cirrhosis, treatment durations were similar across genotype groups. For all patient groups, the mean costs of the intervention were higher for patients with genotype 1 (Table 2). The costs of assessing a patient for treatment were lower for patients with mild disease as a lower proportion of these cases had a liver biopsy before treatment. For example, for patients with mild disease, 65 percent of patients had a liver biopsy in the 18 months before treatment, compared with 89 percent of cases with moderate disease Following an SVR, the mean annual costs for the first 2 years of follow-up for patients with mild disease, moderate disease, and cirrhosis were £202, £247, and £437, respectively.
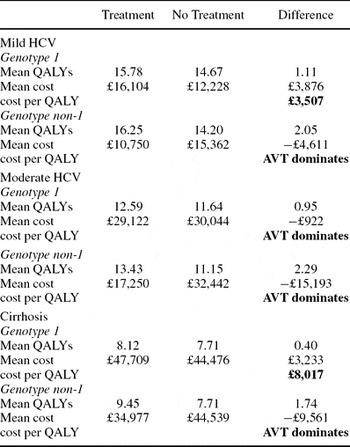
The results for the cost-effectiveness analysis are presented for patients aged 40 in Table 3. For most patient groups, the estimated lifetime costs for the antiviral treatment group were less than for the no-treatment group: the short-term costs of the intervention were more than offset by the reductions in morbidity costs from preventing disease progression. For example, for 40-year-old cases with mild disease and genotype non-1, 82 percent of treated cases were predicted to have a SVR. The overall mean lifetime costs were therefore lower for the treatment (£10,750 [$21,500 or €15,695]) than for the no-treatment group, (£15,362 [$30,724 or €22,429]), and incremental costs were negative (−£4,611 [−$9,222 or €6,732]) (Table 3). The cost-effectiveness analysis found that for patients aged 40 the intervention was associated with gains in QALYs for all groups (Table 3).
Cost-Effectiveness Results for Patients Aged 40 at Presentation for Treatment

HCV, hepatitis C virus; AVT, antiviral therapy; QALY, quality-adjusted life-years;
For all the groups of patients with genotype non-1, antiviral treatment led to lower costs and gains in QALYs, the incremental costs per QALY were negative, indicating that treatment was highly cost-effective. For other patient groups where antiviral treatment was associated with additional costs these were mainly small relative to the QALYs gained, and the ICERs were below £20,000 (Supplementary Table 2, which can be viewed online at www.journals.cambridge.org/thc).
The model estimated that the mean lifetime costs were highest for cases presenting with cirrhosis. For older cirrhotic patients (aged 50 and over) with genotype 1, only 6 percent of treated cases had an SVR. This led to a very low estimate for the QALYs gained (0.09) relative to the additional costs associated with treatment (£5,539). The net effect was that antiviral treatment for this group had a cost per QALY of over £60,000 ($120,000 or €87,000) (Supplementary Table 2).
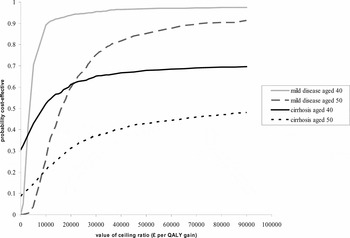
The CEAC incorporated the sampling uncertainty surrounding the model's input parameters. The results showed that at a threshold of £20,000 per QALY, the probability that the intervention was cost-effective exceeded 0.5 for the majority of the patient groups. For example, for patients aged 40 with mild disease and genotype 1, the probability that the intervention was cost-effective was 0.94 (Figure 1). The only group for whom the intervention was not cost-effective at this threshold was older cirrhotic patients (aged 50 and over) with genotype 1, for these cases the probability that the intervention was cost-effective at £20,000 per QALY was 0.31 (Figure 1).
Cost-effectiveness acceptability curves (CEACs) showing the cost-effectiveness of antiviral therapy for genotype 1 patients with mild disease and cirrhosis 40 and 50 years of age.

The sensitivity analysis showed that the results were robust to changes in four of the five main assumptions for each of the subgroups considered even for those patients aged 40 and 50 with mild disease and cirrhosis (Supplementary Table 3, which can be viewed online at www.journals.cambridge.org/thc). Assuming that the relative rather than absolute gain in HRQOL was the same across all disease stages reduced the costs per QALY for patients with cirrhosis, but they remained above £50,000 ($100,000 or €73,000) for cases with genotype 1 aged 50 (Supplementary Table 3). Increasing the follow-up period after SVR, and reducing unit costs made the intervention less cost-effective, but did not change the conclusion that it was cost-effective for all groups apart from older cirrhotic patients with genotype 1.
The only parameter to which results proved sensitive was the probability of progression to HCC. The sensitivity analysis examined the impact on the cost per QALY of assuming that, antiviral therapy reduced the probability of progression to HCC from cirrhosis even in the absence of SVR. In the sensitivity analysis, the probability of progression to HCC was reduced from 1.4 percent to 1 percent, and the ICER for cirrhotic patients with genotype 1 aged 50 fell from £63,931 to £22,694. A threshold analysis examined what reduction in the probability of HCC for cirrhotic cases aged 50 with genotype 1, would be required for treatment to become cost-effective. The results showed that antiviral therapy was only cost-effective (ICER of less than £20,000 ($40,000 or €29,200) for this subgroup, if the probability of HCC for those cases not having a SVR was 0.9 percent or less, a reduction from baseline of at least one third.
DISCUSSION
Previous cost-effectiveness studies of antiviral therapy for chronic hepatitis C have found that antiviral therapy is generally cost-effective. However, these studies relied on SVR rates from multinational RCTs that may not reflect those achievable in routine clinical practice (Reference Shepherd, Jones and Hartwell27;Reference Siebert and Sroczynski28). Our study extends this previous literature and finds that based on SVR rates reported in an observational setting, pegylated interferon and ribavirin is cost-effective in routine practice for patients with chronic hepatitis C. The study highlights that the intervention is generally cost-effective for the subgroups considered, although for the relatively small sample of older patients with cirrhosis and genotype 1, the intervention was less cost-effective.
An important reason why this study finds that pegylated interferon and ribavirin is generally cost-effective in routine clinical practice is that the SVR rates are almost as high as in multinational RCTs (Reference Fried, Shiffman and Reddy12;Reference Hadziyannis, Sette and Morgan14;Reference Zeuzem, Diago and Gane38). In this study, although the mean durations of antiviral therapy exceeded those recommended by NICE (Reference Fried, Shiffman and Reddy12;Reference Manns, McHutchison and Gordon17), they were similar to those observed in the multinational RCTs. As newer shorter antiviral treatment regimens are introduced, it can be anticipated that antiviral treatment will become even more cost-effective. The conclusion that the intervention is cost-effective in this setting is also based on relevant estimates of disease progression and cost. Previous studies used transition probabilities estimated from patients attending tertiary referral centers, where disease progression is faster than for more general populations (Reference Freeman, Dore and Law11).
Making comparisons of the cost-effectiveness of antiviral therapy for chronic hepatitis C across different patient groups was problematic before this study as estimates had to be compared across studies which adopted different methods (Reference Wong, Poynard, Ling, Albrecht and Pauker35). A clear advantage of this study is that the same data sources and model are used to compare the cost-effectiveness of antiviral therapy for different patient subgroups. This allows the reasons for any differences in cost-effectiveness across patient groups to be identified within this study.
While this study has emphasized the importance of adopting a consistent methodology to subgroup analysis, and using a data source that allows all parameters to vary by subgroup, certain limitations should be noted. The results suggesting that pegylated interferon and ribavirin is less cost-effective for older patients with cirrhosis and genotype 1 were driven by the low SVR (6 percent) predicted for this group. It should be noted though, that the SVR rates for older, genotype 1 cases with cirrhosis were based on a small sample size (n = 13), and so high levels of sampling variation surround the central estimates. This study uses recommended methods for incorporating this uncertainty through the use of cost-effectiveness acceptability curves (CEACs). CEACs summarize all the sampling uncertainty in the input parameters, by reporting the probability that the intervention is cost-effective at different levels of willingness to pay for a QALY gained. The results showed that the probability that the intervention was cost-effective for patients with cirrhosis did not exceed 0.5 at realistic levels of the ceiling ratio (19), that is, the intervention was unlikely to be cost-effective. Previous studies have also found relatively low SVRs for older patients with cirrhosis, and so the finding that antiviral therapy is unlikely to be cost-effective for this group may well apply more generally (Reference Thabut, Le Calvez and Thibault32). However, an important area for further research is to perform further CEA for antiviral treatment compared with no treatment for larger samples of older patients with genotype 1 and cirrhosis.
The cost-effectiveness estimates are based on the assumption that disease progression is halted for those cases having an SVR, and those patients who do not have an SVR are assumed to face the same probabilities of progression as untreated cases. A hypothesis in the literature is that even in the absence of an SVR, antiviral treatment for patients with cirrhosis may reduce the probability of progression to HCC (Reference Nishiguchi, Shiomi and Nakatani22). The threshold analysis suggests that, unless the probability of progression from cirrhosis to HCC is reduced by one third, the intervention is not cost-effective for this subgroup. There is no clear evidence in the literature that antiviral therapy for patients with cirrhosis can achieve this reduction in progression to HCC (Reference Bruno, Stroffolini and Colombo6;Reference Michielsen, Francque and van Dongen18). Like previous CEA models of interventions for hepatitis C (Reference Grieve, Roberts and Wright13;Reference Shepherd, Jones and Hartwell27;Reference Siebert and Sroczynski28), we assume that, following an SVR, patients do not become reinfected with HCV. Models in this area could be extended to allow for reinfection, but the available evidence suggests that reinfection rates even among former IVDUs are low (Reference Dalgard, Bjøro and K9). Hence, it would be highly unlikely that allowing for reinfection would make a substantive difference to the finding that antiviral therapy is a relatively cost-effective intervention for patients with chronic hepatitis C.
CONCLUSIONS
In conclusion, this study finds that a combination of pegylated interferon and ribavirin versus no antiviral treatment is generally cost-effective when provided in a routine clinical practice setting. The extensive subgroup analyses show that antiviral treatment is cost saving for patients with genotype non-1, and has low costs per QALY for most patient groups with genotype 1. The study suggests that antiviral therapy is less cost-effective for older patients with genotype 1 and cirrhosis.
POLICY IMPLICATIONS
This study provides policy makers with evidence that antiviral therapy is generally cost-effective for chronic hepatitis C using observational data that reflect the way patients are managed in routine clinical practice. It therefore complements the evidence available from RCT-based analyses. Policy makers have to decide whether to restrict the availability of interventions to particular subgroups, but this is often problematic as it requires using cost-effectiveness evidence from studies that adopt different methods. As this CEA is based on an observational data set that includes a broad range of patient groups it can report cost-effectiveness according to subgroups of interest to the policy maker. The CEA reports that, while the intervention is cost-effective across most subgroups, for one particular subgroup (older patients with genotype 1 and cirrhosis) the intervention was less cost-effective. However, the estimates for this subgroup were based on small samples of patients, and further CEA focusing on this subgroup are justified.
This approach is likely to be of interest to international decision makers, and provides a complement to cost-effectiveness analyses that have relied on multinational RCT data. This approach could be extended to include groups such as patients co-infected with HIV, excluded from the current study. This study illustrates the value from using observational data sets in cost-effectiveness analysis and provides a framework that subsequent economic evaluations could follow.
CONTACT INFORMATION
Marina Grishchenko, MSc, MPH (mrgr@lundbeck.com), Health Economics Manager, Global Outcomes Research & Health Technology Assessment, H. Lundbeck A/S, 37 Avenue Pierre 1er de Serbie, Paris, 75008, France
Richard D. Grieve, PhD (richard.grieve@lshtm.ac.uk), Senior lecturer, Public Health and Policy, London School of Hygiene & Tropical Medicine, Keppel St., London WC1E 7HT, UK
Michael J. Sweeting, PhD (michael.sweeting@mrc-bsu.cam.ac.uk), Research Associate, Daniela De Angelis, PhD (daniela.deangelis@mrc-bsu.cam.ac.uk), Statistician, Statistics Modelling Bioinformatics, Health Protection Agency Centre for Infections; Senior Statistician, Medical Research Council Biostatistics Unit, Institute of Public Health, University Forvie Site, Cambridge CB2 20R, UK
Brian J. Thomson, MD (brian.thomson@nottingham.ac.uk), Associate Clinical Professor, Infectious Diseases, University of Nottingham; Consultant Physician, Department of Medicine, Stephen D. Ryder, MD, FRCP (stephen.ryder@nuh.nhs.uk), Consultant Hepatologist, Department of Gastroenterology, William L. Irving, FRCP (will.irving@nottingham.ac.uk), Professor of Virology, School of Molecular Medical Sciences, University of Nottingham; Consultant Clinical Virologist, Microbiology and Infectious Diseases, Nottingham University Hospitals, Queen's Medical Centre, Nottingham NG7 2UH, UK
APPENDIX
Logistic regression analysis was used to calculate the probability p of experiencing a sustained viral response (SVR), conditional on the covariates x = (x 1, x 2, . ., xk)′ of interest. Whereas the logistic model is expressed, in terms of the odds of experiencing the event of interest:

the CEA required the predicted probability of SVR conditional on the patient's characteristics (e.g., age at treatment, disease stage, and so on).

The coefficients required ( and
 ) for calculating the predicted probability of an SVR conditional on the patient's characteristics were therefore estimated from the logistic

where the patient characteristics (x 1) are defined as:

The predicted probabilities  are thus calculated as:

Using the above equation, the predicted probability of a SVR was calculated for the individual or subgroup of interest by replacing each xi with the relevant patient characteristics. These patient characteristics were then combined with the estimated coefficients from the multivariate logistic regression model:

 to give the predicted probability of a SVR for each sub group.
For example, the predicted probability of an SVR for a female aged 40 with cirrhosis and genotype non-1(x 1 = 0, x 2 = 0, x 3 = 1, x 4 = 0, x 5 = 40, x 6 = 0) is