Introduction
Financial institutions are increasingly interested in the prospect of the $15 trillion in Baby Boomer assets that will need to be managed in retirement (McKinsey, Reference McKinsey2006). One financial product attracting attention in this marketplace is the lifetime payout annuity, which consists of a promise by an insurer to pay benefits over the retiree's remaining lifetime no matter how long she lives. Lifetime annuities can augment retirement security as they allow the retiree to protect against outliving her assets while enhancing expected returns through the ‘survival credit’.Footnote 1
Most previous studiesFootnote 2 have tended to focus on fixed payout annuities or annuities that pay a flat benefit, as these are the dominant product offered in the annuity marketplace. These are financial contracts usually offered by insurance companies which, in exchange for a non-refundable premium, pay a constant benefit amount as long as the annuitant is alive. The insurers invest the premiums mainly in bonds so as to match the annuity cash flows. Fixed payout annuities are a close substitute for bond investments as they offer a relative riskless rate of return plus a survival credit, yet they also impose on the retiree loss of liquidity, eliminate her control over her assets, and obviate leaving a bequest to her heirs. By contrast, a variable payout annuity (VPA) or investment-linked annuity is a relatively new payout product, offering the buyer both an investment element, in terms of a mutual fund-style sub-account, and an insurance element, in terms of pooling longevity risks across the retiree group. In the VPA case, the insurer pays benefits as long as the retiree is alive, where the payouts reflect returns on a specific asset portfolio (e.g. stocks, bonds, or some combinations). In contrast to the fixed payout annuity case, the VPA buyer can influence how the assets are invested in various asset categories while bearing both the risk and rewards of those investments.
A few prior analysts have included variable payout annuities in their analysis of optimal portfolio mixes in a dynamic life cycle portfolio choice context. The majority of these studies impose immediate full annuitization in their modeling structure (cf. Blake et al., Reference Blake, Cairns and Dowd2003; Brown et al., Reference Brown, Mitchell, Poterba, Campbell and Feldstein2001; Charupat and Milvesky, Reference Charupat and Milevsky2002; and Koijen et al., Reference Koijen, Nijman and Werker2006). Only Milevsky and Young (Reference Milevsky and Young2007) permit the retiree to defer annuitization until after she retires. In their study, they model within a continuous time framework a single switching date when the retiree would have (optimally) to move her entire savings into a variable annuity. Milevsky and Young (Reference Milevsky and Young2007) also analyze the possibility of gradual annuitization for the case with fixed payout annuities. Horneff et al. (Reference Horneff, Maurer and Stamos2008a,Reference Horneff, Maurer and Stamosb) extend this gradual annuitization approach by including uncertain labor income and Epstein/Zin preferences, but again they require only fixed payout annuities.
The present paper extends prior studies in several ways. First, we endogenize the retiree's annuitization decision in a discrete time framework, by permitting her to dynamically and gradually buy variable payout annuities throughout retirement. Accordingly, we do not force full annuitization at retirement or at some later single switching time; rather, we allow both partial and gradual annuitization. Second, we optimize the retiree's asset allocation decision dynamically, allowing her to annually rebalance their holdings among risky stocks and riskfree bonds both in her liquid financial wealth and inside her illiquid variable annuity. Prior work has optimized either the initial buy-and-hold mix between equity-linked and constant annuities or the constant rebalanced portfolio allocation inside a variable annuity (so-called money mix plans).Footnote 3
Our dynamic portfolio choice problem is similar in nature to the asset location and asset allocation decisions modeled by Bergstresser and Poterba (Reference Bergstresser and Poterba2004) who explore how much and which kind of assets (risky stocks and riskless bonds) to hold in taxable versus tax deferred accounts. Adopted into our setting, the retiree has to decide how much stocks and bonds to hold in her liquid financial or illiquid annuitized wealth.
We also contribute to the variable annuity literature by explicitly incorporating a bequest motive, so as to characterize the tradeoff between the annuity survival credit and the bequest potential of non-annuitized financial wealth. Finally, we examine the sensitivity of key decisions to parameters, including the degree of risk aversion, the impact of preexisting financial wealth and pension income resulting from social security or defined benefit corporate pensions, and the assumed interest rate, which is an important design parameter of an investment linked payout annuity.
Our findings contrast with earlier research which imposes initial full annuitization on variable annuities,Footnote 4 in that we show that a rational investor would not fully annuitize all her money immediately at retirement even without any bequest motive. This is because of the incompatibility between the rigid payout profile of variable payout annuities usually offered by insurers and her time preferences. Instead, she will initially annuitize only a portion of her money, and then gradually buys more annuities throughout retirement. Furthermore, she will optimally replace stocks with bonds over time in both her liquid savings and annuities.
Our study is not the first which finds that partial annuitization becomes optimal when annuity markets are incomplete. Yagi and Nishiyaki (Reference Yagi and Nishigaki1993) derive a similar result in a stylized three-period model where the incomplete annuitization arises because only constant payout annuity products are on offer. Davidoff et al. (Reference Davidoff, Brown and Diamond2005) have incompleteness of markets due to uninsured risks including medical expenses. Our work extends prior research by allowing full flexibility regarding the asset allocation and annuitization choice, by augmenting the asset space to include equity holdings (both inside and outside annuitized wealth), and by increasing the number of periods modeled. Thus we derive optimal policies for each retirement year and we further quantify the resulting asset allocation and welfare effects more realistically.
In what follows, we first discuss the mechanics of variable payout annuities. Next, we derive and discuss the optimal annuitization and asset allocation strategy for a base case. Subsequently, we examine the welfare gains from expanding the asset space using variable annuities. A final section concludes.
The mechanics of variable payout annuities
The variable payout annuities we consider here are financial contracts between a retiree and an insurer. In return for the initial (non-refundable) annuity premium A 0, the annuity buyer receives a pre-specified number of fund units n t at each point in time t∊{1, 2, …, τ}. Here T is assumed to be the retiree's maximum possible survival age, and τ∊{1, …, T} is her stochastic date of death, distributed according to tp ya which refers to the cumulative survival probability that an individual of age y survives to age y+t. In this setup, the payment P t paid to the annuitant in year t, conditional on her being alive, is P ta=Z tan t, where Z ta is the price of one annuity fund. Z ta evolves according to Z t+1a=Z taR t+1a, and R t+1a is the gross return on investment of the annuity fund in period t+1. The gross return can be stochastic when the underlying funds inside the annuity wrapper are held in risky assets. Thus, while the number of fund units received is deterministic, the payout in monetary terms is potentially stochastic. If the insurance pool is sufficiently large, the premium for the payout process (1) can be calculated according to the actuarial principle of equivalence

where 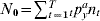 is the number of fund units needed to back the expected future payout stream n t, for t∊{1, 2, …, τ}. Then the premium paid for a variable payout annuity only depends on the current price of the annuity fund, the fund unit stream, and survival probabilities.
Simple algebra yields  , where R(0, t)=Z ta/Z 0a is the cumulative return of the annuity fund. In other words, the premium can be interpreted as the sum of discounted and survival probability-weighted payouts. Rearranging the premium function yields
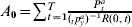 .Footnote 5 This expression shows that the discount rate is higher than the pure market return since (tp ya)−1>1; this survival credit is attributable to the assets shared among surviving members of the insurance pool when members die. Accordingly, variable payout annuities cannot be replicated through direct investments in stocks and bonds.
The Assumed Interest Rate (AIR) and payouts
Pricing variable payout annuities does not require any assumption about the functional form in general, insofar as the process for the fund units n t is concerned. In practice, it is convenient to introduce a functional form for n t which relies on the Assumed Interest Rate (AIR), a term conventionally found in insurance pricing. It is also useful to derive how the AIR influences the distribution of payouts over time. In insurance terminology, the assumed interest rate refers to the ‘shrinkage rate’ of the number of fund units over time: 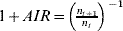 . In turn, the number of fund units decays geometrically. Then the recursive evolution of payouts is given by
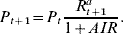
It is natural to refer the AIR as the ‘assumed interest rate’ because the conditional expected payout growth is 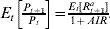 . To produce a payout stream constant in expectation, the AIR must be set exactly equal to the expected return on the assets of the annuity fund
 . When this is the case, the reduction in the number of fund units due to payouts exactly offsets their expected price increase due to investment return. Stipulating a constant AIR the premium (1) becomes
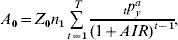
where  is similar to the usual fixed annuity factor, but the riskless discount factor is now replaced by the AIR in the case of the variable payout annuity.
Following the standard approach, the probability distribution for annuity payouts over time may be specified in assuming that prices of the annuity fund units evolve according to a multiplicative random walk with log-normal returns; in other words,  with Z 0a=1, where μa is the annuity fund's mean log-return, σa is the standard deviation of the fund's log-returns, and εt is an i.i.d. standard normal distributed shock. These assumptions allow us to derive the probability distribution for annuity payouts over time. Specifically, from (2), the payout at t is equal to
 . Hence, P t is log-normally distributed with the mean and standard deviation

The α-percentile of the payout distribution in t is then

where N −1(α) is the inverse of the normal distribution function.
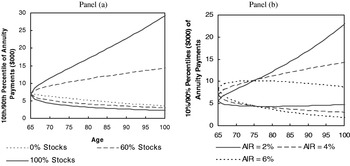
To illustrate how variable annuity payments can vary given alternative asset allocations, we refer to Figure 1. Here Panel (a) traces the 10th/90th percentiles of payment outcomes for a $100,000 immediate variable annuity, given three alternative stock allocations of 0%, 60%, and 100%, respectively. We assume that the expected real portfolio return with 100(60)% stocks is 6(4.4)% with a standard deviation of 18(10.8)%Footnote 6 the AIR is 4%, and the riskless rate 2%, respectively.Footnote 7 (The variable annuity with no stocks and an AIR set to 4% is equivalent to a riskless annuity with shrinking payouts.) The annuity stream can be seen to fall over time, because the AIR exceeds the return of the underlying portfolio. The two equity-linked annuity streams have a distribution skewed toward higher benefits over time, because setting the AIR low compared to the expected annuity fund returns produces low payments initially, with higher benefits later on.
Payment percentiles for alternative asset allocations in the annuity and varying Assumed Interest Rates (AIRs)
This illustration assumes an initial premium of $100,000 and survival probabilities from the US 1996 Annuity 2000 mortality table for females; computations are based on equation (5). Panel (a): Yearly real annuity fund returns for the 60 (100)% stock allocation are i.i.d. log-normal with mean 4.4 (6)% and standard deviation 10.8 (18)%. The real riskless rate and the AIR (Assumed Interest Rate) are set to 2 and 4%, respectively. Panel (b): The annuity fund is assumed to be invested in a 60/40 stock bond portfolio with the mean 4.4% and standard deviation 10.8%; the AIR is set to 2, 4, and 6%, respectively.

Panel (b) of Figure 1 illustrates how annuity payments would vary over time under alternative AIRs of 2%, 4%, and 6%, assuming that the annuity fund is invested 60% in equities. It is clear that the higher the AIR, the larger is the initial payment and the lower is the later payout. For example, after age 75, the variable annuity payment using the lowest AIR exceeds the benefit paid using the highest AIR. Accordingly, the retiree seeking high payouts early in the retirement period would select an annuity with an AIR higher than the expected fund return, and vice versa. It is also interesting that selecting a low AIR results in a much higher dispersion of payments; nevertheless, this dispersion is reflected mainly in the upside potential for payments, while the downside risk is limited.Footnote 8
The investor's optimization problem
Having reviewed the terminology about variable payout annuities, we now turn to a description of the retiree's dynamic portfolio choice problem when it includes stocks, bonds, and variable life annuities. We assume the investor is endowed with initial financial assets S 0, and she is exogenously entitled to constant real lifelong pension income of Y t=Y (e.g. a Social Security and/or company pension). We posit that her preferences can be characterized using a constant relative risk aversion (CRRA) utility function defined over a single non-durable consumption good. The retiree's subjective survival probability that she will survive to date t+1, given she is alive at t, is denoted p ts. In this case, the retiree's preference function is then recursively defined by

with terminal utility  .
Here C t is her consumption level at time t; ρ is her coefficient of relative risk aversion and also reflects her willingness to engage in intertemporal consumption substitution; β reflects her time preference; and B t represents her remaining financial wealth at death. The strength of her bequest motive is represented by the parameter k. In this framework, each year the retiree must decide how to allocate her current cash on hand, W t, between consumption, C t, financial wealth, S t (which are her direct stock and bond investments), and new purchases of variable life annuities, A t. Hence the budget constraint at time t is given by

In the next period, cash on hand is then

where  denotes the share of financial wealth, S t, invested in risky stocks, R f denotes the real bond growth rate, and R t+1 the risky stock return (assumed to be i.i.d. log-normally distributed).Footnote 9 The sum of annual annuity payouts from all previously purchased annuities which the investor gets in case she survives until t+1 is L t+1. If she dies, the remaining estate is given by B t+1=S t(R f+πts(R t+1−R f)). We note that neither the annuity L t+1 nor the pension income flow Y are available for bequests.
When the retiree purchases a variable payout life annuity in period t=u, her immediate single premium is defined asFootnote 10

In return for the premium paid at t=u, she receives for t>u and, until she dies, the annuity payment stream represented by Z ta(u)n t(u). Thus the value of all annuity payments received at time t+1 from all annuities purchased previously u∊{0, …, t} is given by
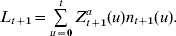
In order to derive the stochastic evolution of L t+1, we note that the price of one annuity fund unit of the annuity purchased at time u evolves as

where πta is the stock fraction at time t inside the variable annuities. Thus, in effect, the individual invests directly in two financial assets, riskless bonds and risky stocks, as well as indirectly through the annuity. By substituting (9) and (11) into (10), we may verify that the recursive evolution of L t+1 is given by

Finally, the recursive intertemporal budget restriction can then be derived by substituting equations (7) and (12) into (8)
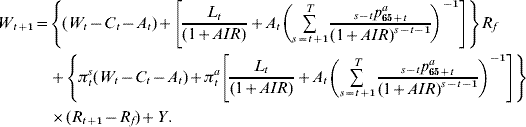
Besides the intertemporal budget restriction, the retiree is restricted from borrowing against future pension income and annuity payouts, as well as from selling short positions in annuities

Her optimization problem is then summarized by
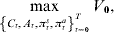
subject to restrictions (13) and (14).
Numerical solution and calibration
Analytical solutions to this type of problem do not exist, so we solve by backward induction through a three-dimensional state space {W, L, t}. Although we assume CRRA preferences, cash on hand W cannot be omitted as a state variable because illiquid annuities are included in the analysis. It is also necessary to include the sum of current annuity payouts L as a state variable, because once purchased, annuities can no longer be sold. Finally, the optimal policy depends on the retiree's age, because the price of newly purchased life annuities as well as the present value of her remaining pension income – which below we refer to as pension wealth – vary with her age.
Without loss of generality, we normalize the retiree's pension benefit Y to 1, and then we express all other cash flow variables as multiples of Y. There are three state variables, two of which – cash on hand W and annuity payouts L – are continuous, leaving age as the only discrete state variable. For each grid point, we calculate the optimal policy and the value of the value function. Thereby, we compute the integral of the expectation operator in (6)
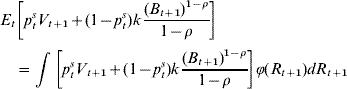
using Gaussian quadrature integration. The optimization is done by numerical constrained maximization. We estimate the policy functions C(W, L, t), A(W, L, t), πs(W, L, t), πa(W, L, t), and the value function V(W, L, t) by cubic spline interpolation. Our numerical analysis takes survival probabilities from the US 1996 Annuity 2000 female mortality table to price the annuities, and the corresponding population mortality table to compute utility. The difference between the two mortality tables reflects ongoing adverse selection in the annuity market (Brugiavini, Reference Brugiavini1993). The riskless rate is set to 2% and we assume that risky stock has an expected return of 6% and volatility of 18%; this is line with the recent portfolio choice literature and reflects US historical evidence. In our base case, we set the AIR equal to 4%, which lies between the riskless rate and the expected equity return.Footnote 11 We also discuss the impact of different AIR with respect to the optimal results in a later section.
Optimal annuitization and asset allocation policies
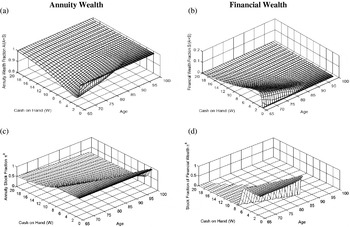
We graph the optimal positions for hypothetical retirees of different ages and different initial financial wealth values (represented as a multiple of pension income) to illustrate the range of annuitization and asset allocation strategies. In Figure 2, for instance, the retiree has moderate relative risk aversion (ρ=5), a reasonable rate of time preference (β=0.96), no bequest motive (k=0), and no income from preexisting annuities (L=0).Footnote 12 Our base cases embody no bequest motive, to isolate the impact of the incomplete annuity market on the annuitization decision. Subsequently, for the welfare analysis, we also introduce a bequest motive of (k=2) following Cocco et al. (Reference Cocco, Gomes and Maenhout2005).
Illustrative optimal dynamic positions in stocks, bonds, and variable payout annuities: variations by age and cash on hand
These figures represent optimal policies which vary as a function of cash on hand (W) and age; in all panels, no prior annuitization is assumed (L=0). In Panel (a), the age-65 retiree with cash on hand W=6 would spend 90% of her cash on annuities and the rest to financial investments (Panel (b)). Her optimal stock fraction is 100% within the variable annuity (Panel (c)) as well as in financial wealth (Panel (d)).

Panels (a) and (b) of Figure 2 show that, in all cases, immediate partial annuitization is optimal due to the incompleteness of annuity markets, even if no bequest motive is present as Davidoff et al. (Reference Davidoff, Brown and Diamond2005) predicted. Our model adds to the analysis of Davidoff et al. (Reference Davidoff, Brown and Diamond2005) by quantifying the extent to which annuitization is reduced due to incomplete markets. Panels (a) and (b) of Figure 2 show that a CRRA investor reserves 13% of initial assets in financial wealth. Full annuitization is postponed until much later in life, to around age 80. The reason that the CRRA utility maximizer holds on to her non-annuitized wealth early in retirement is that annuity payouts are low initially and rise later as the expected annuity return comes to exceed the AIR. Due to time and risk preferences, a retiree who seeks to balance consumption will keep some liquid financial wealth from which she can withdraw cash flexibly to compensate for the low initial annuity payments. Of course, while keeping some financial wealth is optimal, it is also worth noting that the survival credit in the annuity largely compensates for the rigidity of the annuity payout pattern.
Figure 2 also reveals that the retiree initially holds a substantial fraction of her annuity in stocks, and in some cases as much as 100% (Panels (c) and (d)). In most cases, the share of her financial wealth held in equities is also large early in retirement, and then it falls at older ages. The optimal stock fraction in the variable annuity and the financial portfolio also declines at older ages. The reason is that the retiree's pension wealth has bond-like traits, and it declines (in present value) over time. Accordingly, the retiree phases down her stock allocation (taking into account both financial and variable annuity assets), so as to maintain a total stock fraction as the bond-like pension wealth shrinks with age. Also, the higher her financial wealth compared to pension wealth, the higher is her desired bond exposure as a percent of her financial wealth if she is to reach her optimum investment mix. This result is similar to those suggested by recent life-cycle asset allocation studies which omit annuities (Cocco et al., Reference Cocco, Gomes and Maenhout2005), and it also conforms to financial advice recommending that stock fractions be reduced at older ages (Young, Reference Young2004).
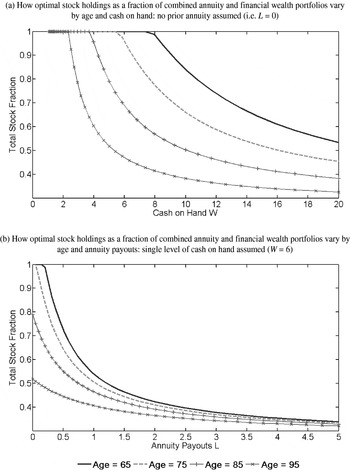
Figure 3 provides illustrative optimal stock fractions in the combined annuity and financial wealth portfolios depicted as a function of the retiree's age, cash on hand (W), and annuity payout (L). Panel (a) confirms that the investor's overall fraction in stock declines with age, more rapidly for lower levels of cash on hand (W). It is interesting that this pattern implies the retiree will follow a counter-cyclical investment strategy, boosting her stock fraction after a bear market and decreasing it in a bull market.Footnote 13 This result stands in contrast with conventional buy-and-hold pro-cyclical strategies assumed during the retirement phase by Koijen et al. (Reference Koijen, Nijman and Werker2006) and Browne et al. (Reference Browne, Milevsky and Salisbury2003), since, in the latter, the stock fraction rises when the stock market outperforms the bond market, and falls if the stock market dives. In Panel (b), the optimal stock fraction varies according to the retiree's existing annuity payouts (L), and once again it falls with age, more rapidly for lower levels of annuity payouts.
Illustrative optimal stock fractions in the combined annuity and financial wealth portfolios
These figures represent the relationship between the retiree's age and the optimal stock fraction in her combined annuity and financial asset holdings. The latter is defined as the stock fraction of her expected annuity wealth PV (the present value of remaining expected annuity payouts ) plus the stock fraction of her financial wealth S, as a percent of financial plus annuity wealth (πsS+πaPV)/(S+PV). Panel (a) shows how this stock fraction varies with age and cash on hand W; Panel (b) shows how it varies with age and pre-existing annuity payments L. In both panels, no prior annuitization is assumed (L=0).

Stochastic analysis
Next we undertake stochastic analysis to evaluate how the investor's annuity purchases, stock fraction, and consumption would be expected to evolve assuming she followed the policy functions derived above. These computations are based on Monte Carlo simulations of 100,000 life cycles, and they begin by assuming that her financial wealth at age 65 amounts to five times her pension income; accordingly, total cash on hand (including pension income) is six times pension income (W=6). Further, we assume that she holds no initial variable payout annuities (L=0).
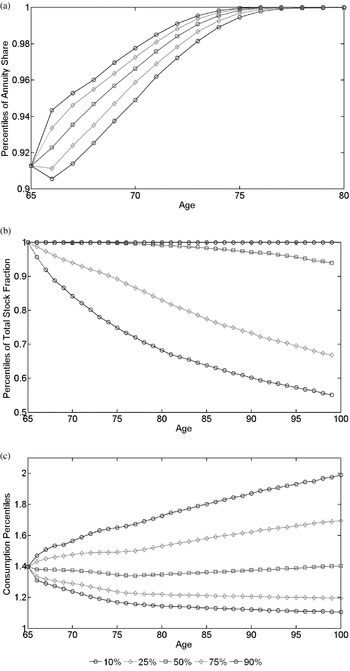
The range of simulated possibilities appears in Figure 4, taking into account the consumer's optimal portfolio rebalancing. The median path (50th percentile) in Panel (a) indicates that the retiree will purchase the bulk of her annuities at age 65 and continue to add additional units thereafter; accordingly, her annuity wealth rises with age and after age 80 she is fully annuitized. Yet because outcomes are stochastic, the 10–90th percentiles illustrate likely variability. In Panel (b), we see that the retiree permitted to rebalance her variable payout annuity asset allocation as she ages will reduce her stock fraction along the median path. In addition, the dispersion in the fraction of stock held rises over time, ranging between 50% and 100%.
Dispersion of annuity, total stock, and consumption paths: base case
Panel (a) depicts the dispersion of the annuitized fraction of wealth PV/(S+PV) as it varies with age; panel (b) reports similar age-dispersion percentiles for the stock fraction of the combined annuity and financial wealth portfolios [=(πsS+πaPV)/(S+PV)]. Panel (c) shows similar dispersion for consumption, measured as a multiple of pension income.

Panel (c) of Figure 4 traces the dispersion of consumption paths with age, where consumption is measured as a multiple of pension income. At the median, the optimizing retiree boosts consumption by 40% over her pension income for the rest of her life. The payouts could be substantially higher, doubling her consumption, if the stock market behaves extremely well when she is in her 90s; conversely the annuity would only boost consumption by 10–20% if the assets in the variable annuity perform very poorly (represented in the figure by the 10 percentile probable minimum consumption level). In other words, with variable payout annuities, the retiree may deplete her financial assets not because of longevity risk, but because of stock market risk.
Impact of the AIR
Above we noted that the AIR selected by the insurer and often restricted by regulators may have a considerable influence on the annuity payout pattern as well as the retiree's annuitization and asset allocation decisions. This is because the retiree who buys an annuity is restricted to receiving a certain payout pattern determined by the AIR. When the AIR is low, annuity cash flows are initially low but rise later in life; conversely, a high AIR produces higher initial cash flows which can be optimally reinvested according to the realized state of nature, but this comes at the cost of lower benefits late in life. It is therefore of interest to explore how changing the AIR shapes the investor's optimal asset allocation, and to determine how sensitive the optimal outcomes are to changes in the AIR.
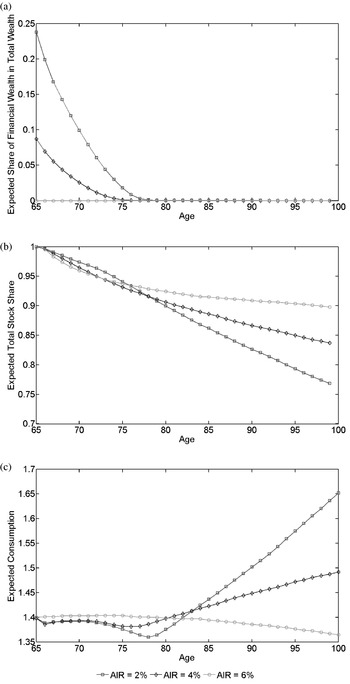
To this end, we reoptimize the investor's asset allocation policy for AIRs of 2%, 4%, and 6% and compare the Monte Carlo simulations based on the optimal policies resulting in each case. Figure 5 reports results, with Panel (a) providing expected financial wealth holdings. When the AIR is low, the retiree retains a large financial wealth position early in retirement; for instance, given an AIR of 2%, she holds 25% of her total wealth in non-annuitized form. As the AIR rises, the portion held in annuities also increases; thus, if the AIR is 6%, all wealth will be immediately annuitized at age 65. This is because annuity payments are low when the AIR is low, and to align consumption to time preferences, the retiree will retain more financial wealth. Conversely, for higher AIRs, the annuity benefits will be high, and she can invest a portion of the benefit in newly purchased annuities, if she does not need the income.Footnote 14
Impact of changing the AIR on (a) the expected share of financial wealth, (b) total stock share, and (c) consumption. This figure depicts the results from solving the optimization problem in (15) for AIRs (Assumed Interest Rates) of 2%, 4%, and 6% respectively.

Concerning the asset allocation strategy, an increase of the AIR also produces a twist in the term structure of the retiree's stock holdings as a fraction of combined financial and annuity wealth (Panel (b)). At retirement, she holds all of her assets in stock independently of the AIR; thereafter, the expected stock fraction falls with age. Furthermore, if the AIR is low, this decline in the stock fraction is slightly smaller early in retirement, compared to higher AIRs. After the retiree reaches her mid-70s, the rate of decline is greater for a lower AIR. This is because a low AIR requires the retiree to reduce her stock fraction more over time as the payout volatility rises faster than with a high AIR (see Figure 1). Finally, a higher AIR also gives the retiree a smoother consumption profile (Panel (c)), as she need not miss out on the survival credit by maintaining high levels of liquid financial wealth early in her retirement period.
Utility gains from variable payout annuities
Thus far, we have shown that the retiree will optimally devote a dominant portion of her portfolio to variable payout annuities, and she also will hold substantial equities. To evaluate how consequential variable payout annuities are for the retiree's wellbeing, we next compare the retiree's utility from having access to variable annuities, with that achievable from a phased withdrawal strategy. We compare these alternatives by computing the additional amount of financial wealth the retiree would need in the restricted scenario, that would make her as well off (provide the same expected utility) as in the unrestricted scenario. Technically, this is accomplished by equating the expected utility in the unrestricted case with that of the restricted case but with more initial financial wealth.
In particular, we examine two phased withdrawal strategies, namely (1) a pure bond strategy with no annuities, and (2) a stock/bond strategy with no annuities. The first assumes that the investor follows a dynamic optimal phased withdrawal plan, but she can hold no annuities and may invest only in bonds. This calculation offers insight into welfare gains associated with access to both the equity premium offered by the stock market and the survival credit offered by the annuity market. In the second case, the investor is assumed to optimally invest her assets in stocks and bonds, but she cannot buy annuities. This second scenario isolates the utility value of access to annuity markets alone.
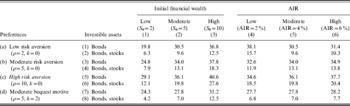
The left-hand panel of Table 1 summarizes results for a moderately risk-averse individual such as that depicted in Figure 2, for varying initial wealth levels. We also allow a bequest motive in the last panel. In line with previous studies, our results indicate that annuities enhance retiree wellbeing. Further, we can show that this result is irrespective of the investor's degree of risk aversion since the funds underlying the annuity can be aligned to her risk appetite. For instance, Table 1 (column 2, row 3) indicates utility losses of 34% when ignoring variable annuity and stock markets in the case of the moderately risk-averse investor (ρ=5) with initial wealth S 0=5. This utility change is substantial, and it is comparable to values reported by Brown et al. (Reference Brown, Mitchell, Poterba, Campbell and Feldstein2001) where their benchmark involved only immediate and full annuitization.
Required increase (in %) in financial wealth to make a retiree indifferent between the specified phased withdrawal strategy versus gaining access to variable payout annuities: impact of different preferences, initial financial wealth, and assumed interest rates (AIR)

Notes: The table entries indicate the amount of financial wealth the retiree would have to be given to make her indifferent between having access to variable annuities as well as stocks and bonds, versus having a restricted choice set as indicated in the table. For example, the investor with relative risk aversion ρ=5, no bequest motive (k=0), and an initial financial wealth of S 0=5, who can invest just in bonds, would be indifferent between having access to the variable annuity market, versus being compensated with an additional 34% of financial wealth (row b3, col. 2). The impact of financial wealth is evaluated fixing the AIR of the variable annuity to AIR=4%. The impact of the AIR is calculated fixing initial financial wealth at S 0=5.
A retiree who lacks a variable annuity but has access to both stock and bond markets is relatively better off. Column 2, row 4, for instance, shows that our moderately risk-averse retiree still allocates her funds suboptimally, but since she can now benefit from the equity premium, she requires only 13% of her initial financial wealth to be as well off as she would with access to a variable annuity. In fact, the difference between rows 3 and 4 measures the value of equity premium which, in this case, exceeds 20% of initial wealth. More generally, the higher are initial wealth and risk aversion levels, the more the retiree will value access to the variable annuity market. For example, the very risk-averse retiree (ρ=10) with a high level of initial financial wealth (S 0=10) who can only invest in bonds, would require a 41% increase in her initial wealth to make her as well off as with the full range of portfolio choices. Of course, if there is a positive bequest motive, the relative appeal of annuities is lower. But, even here, the value of access to variable annuity markets still rises with initial wealth.
The right-hand panel of Table 1 provides results for alternative AIRs at varying levels of risk aversion, assuming the initial financial wealth is fixed (S 0=5). The overall conclusion is that higher AIRs are appealing to more risk-averse individuals having access to variable annuities. By contrast, a lower AIR is preferred by the more risk tolerant. The case with bequests (rows 7 and 8) is comparable to the no-bequest scenario: the retiree will select a high AIR. In any event, changes in utility are small which suggests that offering retirees choice over AIRs (within reason) is unlikely to be consequential.Footnote 15 The relative utility loss of having access to fixed payout annuities only, as opposed to variable annuities, is also relatively low with costs up to 4%. The small utility loss is explained by the fact that the retiree has to reduce her annuitization fraction and hence foregoes some part of the mortality credit in order to purchase stocks outside the annuity wrapper, because of the incompleteness of annuity markets.
The welfare costs of following a non-optimized simpler annuitization and asset allocation strategy, such as the constant 60/40 stock/bond mix mentioned by Feldstein and Ranguelova (Reference Feldstein and Ranguelova2001), are relatively small. For retirees with the risk aversion and initial financial wealth levels considered above, the simpler rule produces utility losses equivalent to no more than 8% of initial financial wealth. Nevertheless, other simple rules (such as holding 100% of the annuity in stocks or bonds) are much less attractive.
Discussion
Our work advances research on variable payout annuities by allowing the investor to annuitize gradually year-by-year during retirement, and by allowing her to optimally and dynamically rebalance her portfolio allocation both inside and outside the variable payout annuities. In this way, the investor can construct an optimal consumption and bequest stream by combining the flexible payouts of her optimal withdrawal plan with inflexible variable annuity payouts.
Regarding the annuitization decision, we find that the utility-maximizing retiree lacking a bequest motive will not annuitize all her funds at retirement, even when variable payout annuities are available. Thus we extend to the case of variable payout annuities Yagi and Nishiyaki's (Reference Yagi and Nishigaki1993) result developed for the case of constant payout annuities. The explanation for partial annuitization has to do with the suboptimality of the payout profile of variable annuities when the assumed interest rate is set low relative to the investor's time and risk preference. For example, a moderately risk-averse and moderately endowed investor will retain up to one-quarter of her initial wealth in financial assets at retirement; after that, she will draw from this fund over time to smooth her consumption time path. Full annuitization is deferred to around age 80, at the latest. Regarding the asset allocation decision, we show that the investor will optimally hold a majority of her combined annuity and financial wealth in equities, with the stock fraction falling during retirement. We also demonstrate that the investor reacts counter-cyclically with respect to stock market trends, so as to rebalance her asset allocation. Finally, our welfare analysis shows that investors having access to variable annuities in retirement will very much value them.
Our evidence therefore implies that consumer wellbeing could be substantially enhanced if equities were integrated more fully into retirees' annuity and liquid wealth portfolios. It is worth noting that the US Congress recently recommended that life cycle funds be used as the default option for workers' pension accumulation phase, but it remained silent on how pension assets should be managed after retirement (Purcell, Reference Purcell2006). Likewise, the President's Commission to Strengthen Social Security focused on ways to help workers accumulate assets, but it did not recommend methods that would help retirees manage the asset decumulation process (Cogan and Mitchell, Reference Cogan and Mitchell2003). Ultimately, our work suggests that policymakers as well as designers of defined contribution pensions and individual retirement accounts would do well to add variable payout annuities to the set of payout options, in order to boost the efficiency of retirement decumulation strategies. In sum, combined investment and insurance solutions offer efficient and attractive ways to finance retirement.
 , where Rf is the riskless growth rate.
 .