INTRODUCTION
Numerous paleolakes with palynologically documented floras of the last interglacial period (in Europe commonly called the Eemian) have been found in NE Poland (Kupryjanowicz, Reference Kupryjanowicz2008; Kupryjanowicz et al., Reference Kupryjanowicz, Nalepka, Madeyska, Kupryjanowicz, Nalepka, Madeyska and Turner2018c, Reference Kupryjanowicz, Nalepka, Pidek, Walanus, Balwierz, Bińka and Fiłoc2018d). Generally, the European terrestrial Eemian is correlated with marine isotope substage (MIS) 5e, although absolute correlations are addressed in detail later in the paper.
Additional and equally numerous Polish Eemian paleolake sites are located slightly south and west of this region (e.g., Mamakowa, Reference Mamakowa1989; Bińka and Nitychoruk, Reference Bińka and Nitychoruk2003; Kupryjanowicz et al., Reference Kupryjanowicz, Nalepka, Madeyska, Kupryjanowicz, Nalepka, Madeyska and Turner2018c). Even more paleolakes extend to the east and northeast of Poland's borders, in Belarus (e.g., Mahnač, Reference Mahnač1971; San'ko, Reference San'ko1987; Hursevič et al., Reference Hursevič, Rylova and Fedenâ1995; Savčenko and Pavlovskaya, Reference Savčenko and Pavlovskaya1999; Savčenko and Rylova, Reference Savčenko and Rylova2001; Shalaboda, Reference Shalaboda2001; Granoszewski et al., Reference Granoszewski, Winter, Rylova and Savčenko2012), Lithuania (e.g., Satkunas et al., Reference Satkunas, Grigiene, Guobyte, Marcinkevičius and Račkauskas1997, Reference Satkunas, Grigiene and Robertsson1998, Reference Satkunas, Grigiene, Velichkevich, Robertsson and Sandgren2003; Satkunas and Grigiene, Reference Satkunas and Grigiene2012), and Latvia (e.g., Krukle et al., Reference Krukle, Lusina, Stelle and Danilans1963; Meirons, Reference Meirons and Danilans1972; Danilans, Reference Danilans1973; Kalnina et al., Reference Kalnina, Dreimanis and Murniece2000, Reference Kalnina, Strautnieks and Cerina2007; Kalnina, Reference Kalnina2001).
The dynamics of NE Poland paleolakes must be understood in order to gain a fuller appreciation for the paleoecology and paleogeography of central Europe's last interglacial period and early part of the last glacial period (Weichselian in western Europe, and Vistulian in Poland; MIS 5a–d). Importantly, this region is located in a transitional zone between the oceanic climate of western Europe and the continental climate of eastern Europe. Because of its geographic situation, all climatic changes—even relatively minor and brief ones—are more fully reflected in the vegetation here than in other parts of Europe. This is because many taxa, both boreal and non-boreal, are at their distributional range limit here. Plants respond relatively quickly to favorable climatic changes by expanding their ranges and retreat when climate changes are unfavorable. This vegetational feedback makes the region particularly useful for investigating abrupt climatic oscillations, both within the Holocene (e.g., Fiłoc et al., Reference Fiłoc, Kupryjanowicz, Szeroczyńska, Suchora and Rzodkiewicz2017, Reference Fiłoc, Kupryjanowicz, Rzodkiewicz and Suchora2018) and within the Eemian interglacial period (Kupryjanowicz et al., Reference Kupryjanowicz, Ciszek, Mirosław-Grabowska, Marciniak and Niska2005, Reference Kupryjanowicz, Granoszewski, Nalepka, Pidek, Walanus, Balwierz and Fiłoc2016; Kupryjanowicz, Reference Kupryjanowicz2008). This phenomenon is fundamental if we consider the results of many pollen studies from Europe, which indicate sharp climate oscillations developed both at the end of the Eemian interglacial period (e.g., Woillard Reference Woillard1978; Eissmann, Reference Eissmann2002; Klotz et al., Reference Klotz, Guiot and Mosbrugger2003, Reference Klotz, Müller, Mosbrugger, Beaulieu and Reille2004; Müller et al., Reference Müller, Pross and Bibus2003; Velichko et al., Reference Velichko, Novenko, Pisareva, Zelikson, Boettger and Junge2005; Borisova et al., Reference Borisova, Novenko, Velichko, Kremenetski, Junge and Boettger2007; Seelos and Sirocko, Reference Seelos, Sirocko, Sirocko, Claussen, Sánchez Goni and Litt2007; Hermsdorf and Strahl, Reference Hermsdorf and Strahl2008; Novenko et al., Reference Novenko, Seifert-Eulen, Boettger and Junge2008; Boettger et al., Reference Boettger, Novenko, Velichko, Borisova, Kremenetski, Knetsch and Junge2009) and during the first warm interstadial of the last glacial period (e.g., de Beaulieu and Reille, Reference Beaulieu and Reille1984, Reference Beaulieu and Reille1992a, Reference Beaulieu and Reille1992b; Reille and de Beaulieu, Reference Reille and Beaulieu1988; Reille et al., Reference Reille, Beaulieu, Svobodova, Andrieu-Ponel and Goeury2000; Granoszewski Reference Granoszewski2003; Kupryjanowicz, Reference Kupryjanowicz2008).
A new long sequence of Eemian and early Vistulian lake sediments was identified in the vicinity of Jałówka village in the Sokółka Hills region, NE Poland, and investigated palynologically. The initial results of this research were presented in an earlier paper, but only in a very general manner (Woronko et al., Reference Woronko, Rychel, Karasiewicz, Kupryjanowicz, Adamczyk, Fiłoc, Marks, Krzywicki and Pochocka-Szwarc2018). The aim of the current study is to reconstruct the vegetational changes in greater detail—both around and directly in the study basin. This allows the identification of environmental conditions during the time period of the accumulation of the studied deposit, in particular at a time when abrupt climate oscillations took place, at the end of the last interglacial period and the beginning of the last glacial period. The development of a pollen sequence also allows us to speculate as to its potential correlations with other sequences, including European terrestrial profiles, Greenland ice cores, and marine sequences. Such correlations are a basic component of all paleoecological studies. They are needed to compare the investigated records with other ones so as to provide some context to the data. However, in this case, any correlation of the study sequence must be undertaken with extreme caution, as this sequence has not been independently dated. As a result, this part of the study is only speculative. We await precise independent dating controls so that such speculation might be tested more robustly.
RESEARCH AREA AND STUDY SITE
The Sokółka Hills were formed by ice sheet advance and retreat during the Warta Stadial of the Odra glaciation (late Saalian, MIS 6) (Marks and Karabanov, Reference Marks and Karabanov2011). Topographic relief in the area spans several tens of meters, and some elevations reach altitudes of 190–220 m above sea level (m asl) (Fig. 1).
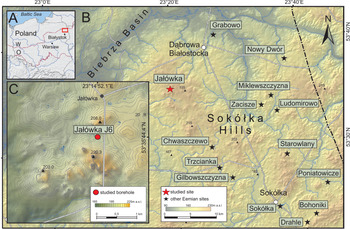
(color online) (A) Location of the study region; maximum range of the Odranian (O) and Weichselian (W) according to Marks and Karabanov (Reference Marks and Karabanov2011). (B) Location of the Jałówka site and other Eemian localities in the Sokółka Hills region, NE Poland: Ludomirowo, Zacisze, and Miklewszczyzna according to Bitner (Reference Bitner1957); Nowy Dwór according to Noryśkiewicz (Reference Noryśkiewicz2005); Bohoniki, Chwaszczewo, Drahle, Gilbowszczyzna, Grabowo, Poniatowicze, Sokółka, Starowlany, and Trzcianka according to Kupryjanowicz (Reference Kupryjanowicz2008). (C) Location of the Jałówka J6 borehole.

The studied paleolake sediments were found within a dry valley (53°35′44.4″N, 23°14′52.1″E) in the vicinity of Jałówka village, located in the northwestern part of the Sokółka Hills, situated 25 km northwest of the town of Sokółka (Fig. 1B) and about 40 km to the northeast of Białystok (Fig. 1A). This area lies about 20 km beyond (i.e., to the south of) the maximal range of the last glacial ice sheet extent as distinguished by Marks (Reference Marks2002, Reference Marks2012) and Marks and Karabanov (Reference Marks and Karabanov2011; Fig. 1A). It includes morainic hills with salients reaching up to 220 m asl. Small wet depressions were noted in the flat-bottomed valley and in the upper parts of the first-order dry valleys (Woronko et al., Reference Woronko, Rychel, Karasiewicz, Kupryjanowicz, Adamczyk, Fiłoc, Marks, Krzywicki and Pochocka-Szwarc2018). An upper-reach portion of a dry valley near Jałówka village was subjected to detailed studies. Here the valley bottom is flat and slightly wet, reaching an altitude of 194 m asl, a width of 250 m (Fig. 1C).
Several Eemian-aged sites have been palynologically documented in the Sokółka Hills (Fig. 1B). Pollen profiles from these sites correlate well with each other (Kupryjanowicz, Reference Kupryjanowicz2008).
MATERIAL AND METHODS
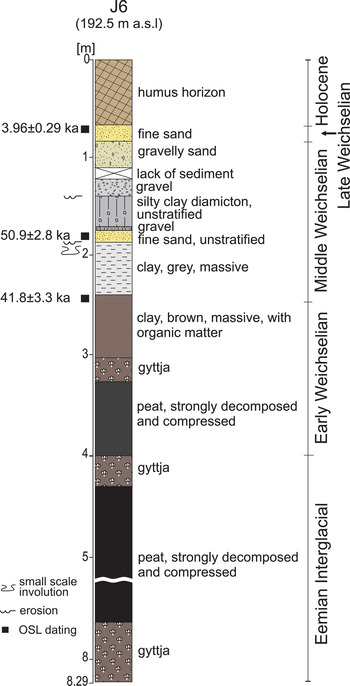
Field studies included drilling a cored borehole Jałówka J6 (Geoprobe) to a depth of 8.3 m in the bottom of the dry valley at the Jałówka site (Woronko et al., Reference Woronko, Rychel, Karasiewicz, Kupryjanowicz, Adamczyk, Fiłoc, Marks, Krzywicki and Pochocka-Szwarc2018). Drilling was carried out at 192.5 m asl in the axis of the dry valley, where its floor expands and it changes direction from NWN-SES to E-W (Fig. 1C). In our core, the sediment sequence at a depth of 7.69–8.29 m began with gyttja (~0.6 m thick) (Fig. 2). The basal unit was overlain by strongly decomposed and very compressed peat (3.55 m thick). Above this layer, again there was gyttja (0.20 m thick), and then once more peat (0.25 m thick), and once more gyttja (0.64 m thick). The sediment overlying the uppermost layer of gyttja was brown massive clay containing organic matter (0.66 m thick). The next lithologic unit was composed of mineral sediments developed as gray massive clay (0.57 m thick) and nonstratified, fine-grained sand (0.1 m thick). Next in the upward sequence was nonstratified, completely decalcified silty clay diamicton with coarse gravel toward the bottom (0.34 m thick). In the upper portion of this layer, epigenetic thermokarst-modified sand wedges occur (Woronko et al., Reference Woronko, Rychel, Karasiewicz, Kupryjanowicz, Adamczyk, Fiłoc, Marks, Krzywicki and Pochocka-Szwarc2018). Gravel (0.15 m thick) and gravelly sand (0.25 m thick) directly overlie the diamicton. The top of the Jałówka J6 profile was composed of fine-grained sand with a massive structure (0.3 m thick), underlain by single gravels and sand–fine sand sediments, enriched in organic matter and with traces of plowing (0.65 m thick) (Fig. 2).
(color online) Lithology of the Jałówka J6 core (modified from Woronko et al., Reference Woronko, Rychel, Karasiewicz, Kupryjanowicz, Adamczyk, Fiłoc, Marks, Krzywicki and Pochocka-Szwarc2018). OSL, optically stimulated luminescence.

Three dating samples were collected from the studied sediment profile. Optically stimulated luminescence (OSL) ages were determined at the Laboratory of Luminescence Dating, Institute of Physics, Silesian University of Technology, Poland (Fig. 2).
Material for palynological analyses was collected at depths between 8.25 and 2.47 m from gyttja, peat, and brown massive clay (Figs. 2–4). Sixty-six samples of 1 cm3 volume were taken for pollen analysis. Each sample was treated by Erdtman's acetolysis method (Faegri and Iversen, Reference Faegri and Iversen1989). A method of gravitational separation of mineral and organic components was employed for silt and clay using a heavy liquid solution including potassium and cadmium iodides (Dorogoniewska et al., Reference Dorogoniewska, Shenfinkel and Grichuk1952). The processed material was then mounted in glycerin. Samples were then analyzed using a Nikon Eclipse 400 light microscope with magnifications of 600× and 1000×. Pollen and spores were identified using keys (e.g., Moore et al., Reference Moore, Webb and Collinson1991; Beug, Reference Beug2004). Counted content ranged between 500 and 2000 pollen grains per sample, which in most cases reached ~1000 grains per sample.
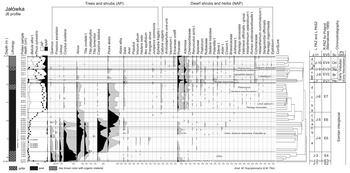
Jałówka J6 profile. Pollen percentage diagram illustrating the succession of terrestrial vegetation around the studied depression. L PAZ, local pollen assemblage zones; L PASZ, local pollen assemblage subzones; R PAZ, regional pollen assemblage zones (according to Mamakowa, Reference Mamakowa1989); Br, Brørup interstadial; He, Herning stadial; MW, Middle Weichselian; Od, Odderade interstadial; Re, Rederstall stadial; Sc, Schalkholz stadial; light gray vertical line near column of depth indicates samples poor in pollen, and dark gray vertical line identifies samples very poor in pollen not drawn on the diagram.

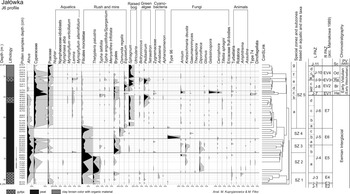
Jałówka J6 profile. Pollen percentage diagram illustrating the succession of mire and aquatic vegetation in the studied depression. For explanations see Fig. 3.

The palynological results are presented here as percentage pollen diagrams prepared with POLPAL software (Walanus and Nalepka, Reference Walanus and Nalepka1999; Nalepka and Walanus, Reference Nalepka and Walanus2003). The percentage values of particular taxa were calculated in relation to the sum of tree and shrub (AP) and terrestrial herbaceous plant pollen (NAP) but excluded all other palynotaxa (see Berglund and Ralska-Jasiewiczowa, Reference Berglund, Ralska-Jasiewiczowa and Berglund1986). The percentage pollen diagram of terrestrial plants was divided into local pollen assemblage zones (L PAZ), and the percentage diagram of aquatic and mire plants and non-pollen palynomorphs (NPPs) was divided into special zones (SZ) representing changes only in the taxa of these groups. Their delimitation was based on the taxonomic composition and percentage values of the taxa recorded in the pollen spectra as supported by ConSLink numerical analysis (Walanus, Reference Walanus1995).
RESULTS
The age of the uppermost lacustrine layer deposit of palynological study, determined by OSL methodology, was 41.8 ± 3.3 ka, whereas the age of the clay covering these deposits was 50.9 ± 2.8 ka (Fig. 2). This date inversion attests to the challenges of using OSL dating in such contexts. Hence, these optical dates provide only a very rough guide to the actual age for the deposits (Woronko et al., Reference Woronko, Rychel, Karasiewicz, Kupryjanowicz, Adamczyk, Fiłoc, Marks, Krzywicki and Pochocka-Szwarc2018).
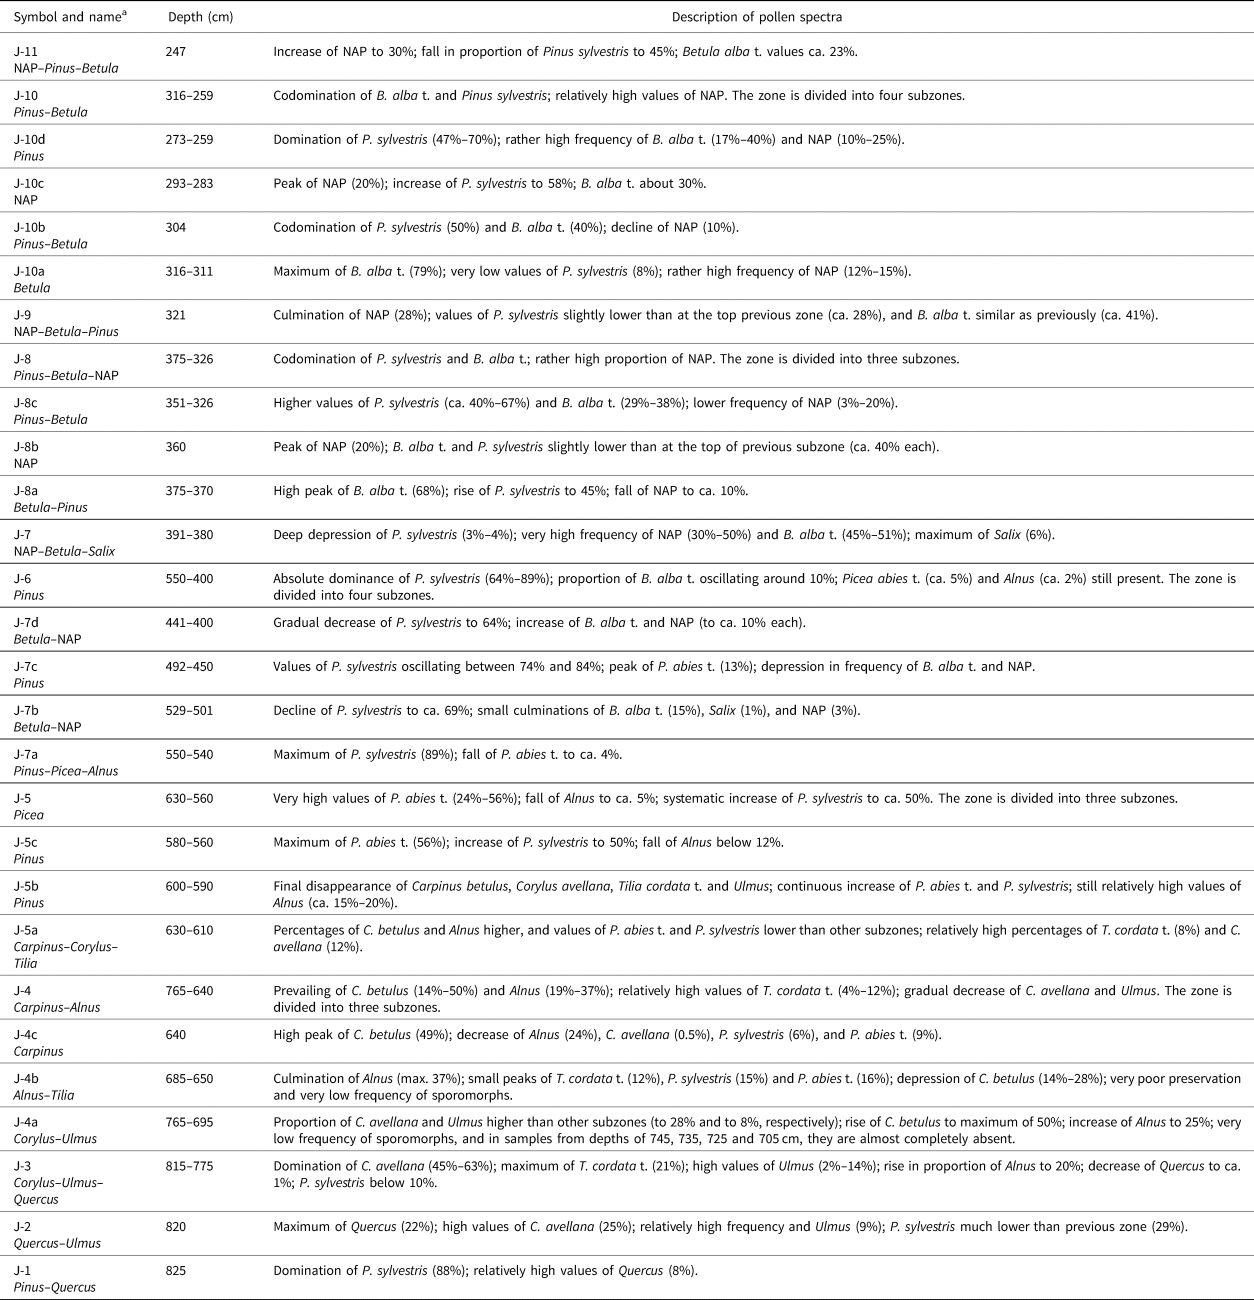
The pollen percentage diagram illustrating the development of terrestrial plants around the study basin was divided into 11 local pollen assemblage zones (Fig. 3). Their short descriptions are presented in Table 1.
Jałówka J6 profile: characteristics of the local pollen assemblage zones (L PAZ) and subzones (L PASZ) representing changes in terrestrial vegetation around the studied depression (zones are shown in stratigraphic order from bottom to top, as in the pollen diagram in Fig. 3).

a NAP, sum of terrestrial herbaceous plant pollen.
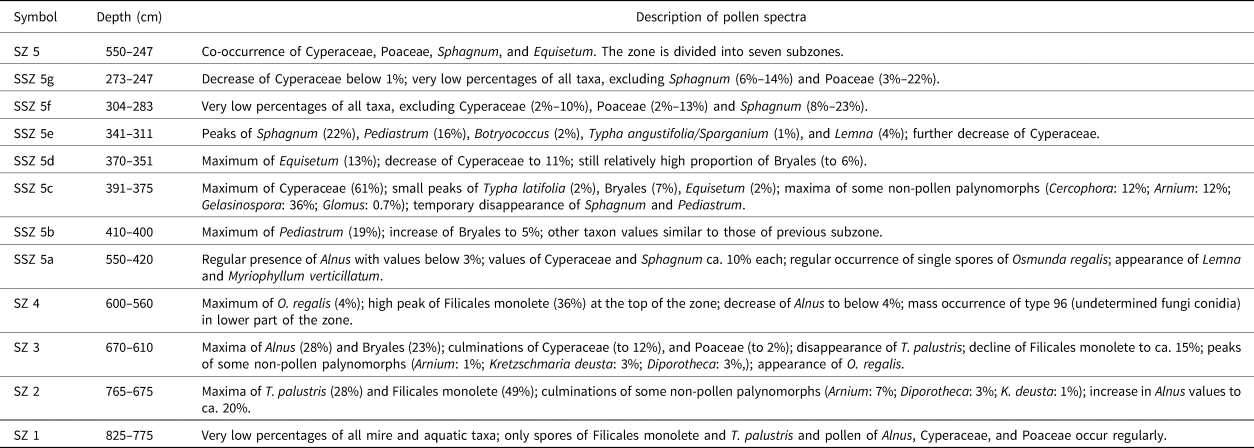
The pollen percentage diagram illustrating the succession of mire and aquatic vegetation growing directly within the study basin was divided into five special pollen zones. This distinction was based only on changes in the frequencies of the taxa of these two groups and the taxa of non-pollen palynomorphs (NPPs) (Fig. 4, Table 2). In a diagram of mire and aquatic plants, we took into account (as presented in Figure 3) the pollen curves of Alnus and Salix—tree genera typical of wet habitats—and species of both the sedge (Cyperaceae) and grass (Poaceae) families that can grow in dry, moist, and wet places.
Jałówka J6 profile: characteristics of special pollen zones (SZ) and subzones (SSZ) illustrating succession of mire and aquatic vegetation in the studied depression (zones are shown in stratigraphic order from bottom to top as in the pollen diagram in Fig. 4).

CHRONOSTRATIGRAPHIC CORRELATION OF LOCAL POLLEN ASSEMBLAGE ZONES
The six lower-lying local pollen assemblage zones—distinguished in the Jałówka J6 profile (J-1–J-6 L PAZ)—represent an interglacial succession of vegetation (Fig. 3). Typical features of this palynological record include: (1) very high values of Corylus; (2) the expansion of trees and shrubby hazels (Corylus) in the following order: Pinus, Quercus–Ulmus–Fraxinus, Corylus, Alnus, Tilia, Carpinus, Picea, and Pinus; and (3) a marked increase in Carpinus with a concurrent high occurrence of Corylus. The three preceding palynological features in concert allow an unequivocal correlation of this sequence with the Eemian interglacial (see Zagwijn, Reference Zagwijn1961; Mamakowa, Reference Mamakowa1989; Cleveringa et al., Reference Cleveringa, Meijer, van Leeuwen, de Wolf, Pouwer, Lissenberg and Burger2000).
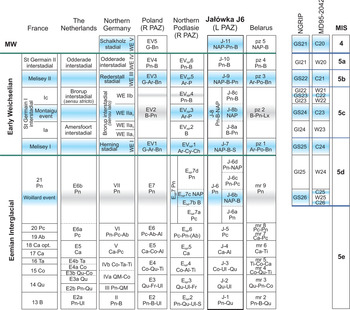
Local pollen assemblage zones J-1–J-6 correlate well both with regional pollen zones published for the Eemian interglacial period in NE Poland (Kupryjanowicz, Reference Kupryjanowicz2008) and with regional pollen zones assigned by Mamakowa (Reference Mamakowa1989) for the whole of Poland, as well as with pollen zones in regional palynostratigraphies from eastern, central, and western Europe (Fig. 5). This correlation is not considered understated despite the low maximal values of Quercus in the Jałówka J6 profile (≤20%), which is very much lower than in other profiles from NE Poland (Kupryjanowicz, Reference Kupryjanowicz2008) and in other regions of the country (Mamakowa, Reference Mamakowa1989). Due to the extremely limited thickness of the oak (Quercus) pollen zone in the Jałówka J6 profile (~0.10 m), the occurrence of a hiatus within this part of the profile is probable. This deposit layer accumulated at the very beginning period of lake formation at the study site (see following sections of this article), so disturbances in sedimentation were very likely.
Proposed correlation of local pollen assemblage zones (L PAZ) and subzones (L PASZ) distinguished in the Jałówka J6 profile with regional pollen zones (R PAZ) of northern Podlasie, NE Poland (from Kupryjanowicz, Reference Kupryjanowicz2008), Poland (from Mamakowa, Reference Mamakowa1989), Germany (from Menke and Tynni, Reference Menke and Tynni1984), the Netherlands (from Zagwijn, Reference Zagwijn1961), France (from Woillard Reference Woillard1978; de Beaulieu and Reille, Reference Beaulieu and Reille1992b), and Belarus (from Savčenko and Rylova, Reference Savčenko and Rylova2001; Granoszewski et al., Reference Granoszewski, Winter, Rylova and Savčenko2012), and with some other stratigraphic units of the Eemian, early and middle Weichselian: stadials and interstadials in Germany according to Behre and Lade (Reference Behre and Lade1986), interstadials in the Netherlands according to Zagwijn (Reference Zagwin1996), Greenland stadials (GS) and interstadials (GI) according to Dansgaard et al. (Reference Dansgaard, Johnsen, Clausen, Dahl, Gundestrup, Hammer, Hvidberg, Steffensen, Sveinbjornsdottir, Jouzel and Bond1993), North Atlantic warm (W) and cold (C) periods according to McManus et al. (Reference McManus, Bond, Broecker, Johansen, Labeyrie and Higgins1994), oxygen isotope stages according to Pisias et al. (Reference Pisias, Martinson, Moore, Shackleton, Prell, Hays and Boden1984). Ab, Abies; Al, Alnus; Ar, Artemisia; B, Betula; Bn, Betula nana; Ca, Carpinus; Ch, Chenopodiaceae; Co, Corylus; Cy, Cyperaceae; Fr, Fraxinus; G, Gramineae (Poaceae); QM, Quercetum mixtum (mixed oak forests); NAP, non-arborescent pollen; Lx, Larix; P, Poaceae; Pc, Picea; Pn, Pinus; Qu, Quercus; S, Salix; Ta, Taxus; Ti, Tilia; Ul, Ulmus. Cold periods are shaded in blue. Coolings not reflected in regional palynostratigraphies, but registered in some pollen records from these regions, are shaded in gray. (For interpretation of the references to color in this figure legend, the reader is referred to the web version of this article.)

Our correlation of the studied pollen succession with the Eemian interglacial period is not lessened by the rather low pollen values of Carpinus registered in J-4b L PAZ, which corresponds to the younger part of Poland's regional E6 Carpinus zone. In actuality, this only illustrates a local underrepresentation of hornbeam pollen. Their diminution is likely a consequence of the corrosion susceptibility of pollen grains. Specifically, the decay was induced under changing hydrological conditions as waterlogged alder-dominated (Alnus) “carr” wetlands formed in the study basin area at this time (see next section).
In the absence of radiometric dating, pollen zones may be used to provide a chronological framework for the Eemian throughout Europe. The similarity of the Eemian vegetational succession from western France, across the North European Plain to Moscow, and to Lake Onega in the north implies that the major pollen zones are broadly synchronous; although some delay may be expected at sites farthest from the original source (Grichuk, Reference Grichuk and Velichko1984; Menke and Tynni, Reference Menke and Tynni1984; Zagwijn, Reference Zagwin1996; Cheddadi et al., Reference Cheddadi, Mamakowa K., Beaulieu, de, Reille, Andrieu, Granoszewski and Peyron1998; Funder et al., Reference Funder, Demidov and Yelovicheva2002; Turner, Reference Turner2002). Zagwijn (Reference Zagwin1996) concluded that the consequent zonal boundaries probably do not differ by more than 200–500 years across the whole of northern Europe. However, Zagwijn's estimate should perhaps be treated with caution, partly by comparison with Holocene vegetation developments, but also from noting that Taxus in the Eemian does not follow this trend but appears successively later in different areas.
Environmental change age determination presented in this work is obtained through event stratigraphy, which is here used to correlate the local pollen record at Jałówka with that at Bispingen (Müller, Reference Müller1974) and Gross Todtshorn (Caspers, Reference Caspers1997) in Germany, where a length of ~10–11 ka of the Eemian record has been calculated by varve counting and estimation for the unlaminated parts of the profiles. In contrast to Müller's time span assumptions, a duration of about 17 ka was obtained from the more recent Bispingen cores (Lauterbach et al., Reference Lauterbach, Brauer, Litt and Schettler2012a, 2012b). This estimate is in good accordance with results from a Portuguese marine record (e.g., Shackleton et al., Reference Shackleton, Chapman, Sánchez-Goñi, Pailler and Lancelot2002, 2003) and with a 16 ka interval of Eemian woodland presence in southwest Europe (e.g., Tzedakis et al., Reference Tzedakis, Lawson, Frogley, Hewitt and Preece2002). However, these data have never been published.
The aforementioned correlation avoids the problems that would otherwise occur in any attempt at correlation of different local pollen zonations (e.g., applying the Danish pollen zonation of Andersen [1966, 1975] to the Jałówka record), the respective zonal boundaries of which may be defined using slightly different criteria. The Bispingen records give the duration of pollen zones in years, although later pollen zone durations are estimated from incompletely laminated sediment.
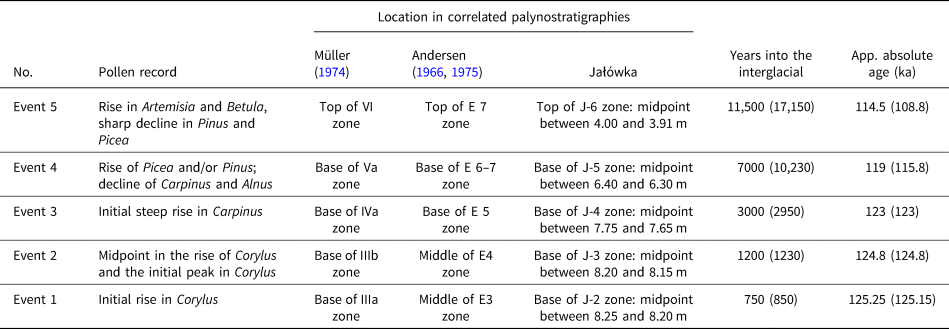
We identify five distinct events in the Jałówka pollen record, all of which can be tied to Müller's (Reference Müller1974) Bispingen zonation. The events are defined as shown in Table 3. For comparative purposes, we adopted absolute ages to distinguish the pollen events (see the rightmost column of Table 3) following the chronology of Shackleton et al. (Reference Shackleton, Chapman, Sánchez-Goñi, Pailler and Lancelot2002, Reference Shackleton, Sánchez-Goñi, Pailler and Lancelot2003) and Sánchez Goñi et al. (Reference Sánchez-Goñi, Loutre, Crucifix, Peyron, Santol, Duprat, Malaizé, Turon and Peypouquet2005), which place the Eemian's beginning at ~126 ka. We emphasize that tying the Bispingen record to an absolute time scale is an approximation and note also that there are some doubts as to whether the earliest Eemian is even represented at Bispingen (Müller and Kukla, Reference Müller and Kukla2004).
Characteristics of events distinguished in pollen record from the Jałówka J6 profile and their correlation with annually laminated Eemian sediments at Bispingen, N Germany.a

a The ages, as years from the Saalian/Eemian boundary, are based on Müller (Reference Müller1974) and Lauterbach et al. (Reference Lauterbach, Brauer, Litt and Schettler2012a, Reference Lauterbach, Brauer, Litt and Schettler2012b); these latter are shown in brackets.
Local pollen assemblage zones J-7–J-11 correspond well to regional pollen zones representing the beginning of the last glaciation both in NE Poland and Poland as a whole, as well as with pollen zones in regional palynostratigraphies from eastern, central, and western Europe (Fig. 5). The first of these zones—J-7 L PAZ—illustrates a treeless period (Fig. 3), being an equivalent of the Herning stadial in northern Germany (Menke and Tynni, Reference Menke and Tynni1984) and of the Melisey I stadial in France (Woillard, Reference Woillard1978; de Beaulieu and Reille, Reference Beaulieu and Reille1992b).
J-8 L PAZ shows forest interstadial—known as the Brørup sensu lato in northern Germany and as the Saint Germain I in France—while in the Netherlands the unit is divided into two interstadials —Amersfoort and Brørup sensu stricto—being separated by an unnamed stadial. A middle subzone of the J-8 local pollen zone from Jałówka (J-8b L PASZ) is characterized by increased values of NAP (Fig. 4), which is the equivalent of this unnamed stadial, and similar to the Montaigu event recorded in French pollen profiles (Woillard, Reference Woillard1978). J-8a L PASZ, representing the beginning birch (Betula) phase of the Brørup interstadial, includes only one pollen spectrum with high percentages of Betula alba t. pollen and one spectrum with co-domination of both B. alba t. and Pinus sylvestris pollen (Fig. 3). Perhaps these data reflect a hiatus in this section of the study profile. Such a gap could be the result of the oxidation of the peat surface layer that formed in response to a lowered water level within the studied peat bog. This inference is suggested by the noted changes in wetland communities (see next section).
Local pollen zone J-9 correlates with the Rederstall stadial in northern Germany and Melisey II stadial in France, and J-10 correlates with the German and Dutch Odderade and the French Saint Germain II interstadials.
The uppermost local pollen zone from the Jałówka J6 profile (J-11) represents the oldest stadial of the middle Weichselian (Plenivistulian). In northern Germany it is called the Schalkholz (Menke and Tynni, Reference Menke and Tynni1984).
CHANGES IN TERRESTRIAL VEGETATION
Eemian interglacial period
Generally, the terrestrial Eemian is correlated with marine MIS 5e. In more detail, this correlation is discussed later in the paper.
During the pine–oak (Pinus–Quercus) phase (J-1 L PAZ, E2 R PAZ; Fig. 3), pine was the dominant forest tree, but the presence of relatively high pollen values of Quercus reflects the development of an oak subcomponent. The presence of Ulmus and Fraxinus excelsior pollen may be evidence of elm–ash riverine forests. The rather low pollen proportion of other trees points to their limited importance.
An increase in Quercus pollen values points to a rise in the significance of oak to the forest communities during the next phase of the interglacial period (J-2 L PAZ, E3 R PAZ; Fig. 3). At that time, oak was the absolute dominant tree and most likely grew in various forest communities; in some habitats, it could even form pure stands. On the hills and slopes around the lake, together with pine (high values of Pinus pollen), it formed mixed forests. In river valleys, oak and elm built floodplain forests. According to Granoszewski (Reference Granoszewski2003), the last communities perhaps corresponded to the contemporary west European riverine forest of the Ulmo–Quercetum association (see Ellenberg, Reference Ellenberg1988). They were widespread thanks to the humid oceanic climate.
During the hazel phase (J-3 L PAZ, E4 R PAZ; Fig. 3), there was a strong expansion of Corylus, which at that time had reached its maximum spread. The magnitude of Tilia cordata in stands gradually rose. Elm–oak–ash floodplain forests continued to be very important communities in fertile habitats. However, at the same time, an alder expansion is marked by a consequent rise in Alnus pollen percentages. This genus extended along riverbanks and lakeshores as well as in habitats that had originated from dried-up and overgrown small water bodies or shallow parts of larger lakes (see Jörgensen, Reference Jörgensen1963).
During the younger part of the hazel phase, a strong expansion of lime (Tilia) took place. This increase led to the formation of a mixed broadleaf forest. Hazel formed an important element of this mixed community's understory, and lime was the most prominent forest tree. The genus Tilia was represented by three species at that time—T. cordata, T. platyphyllos, and T. tomentosa (Fig. 3). The last species is now alien to the contemporary Polish flora (Szafer et al., Reference Szafer, Kulczyński and Pawłowski1986); however, T. tomentosa was a forest component across the whole of Poland during the last interglacial period (e.g., Mamakowa, Reference Mamakowa1989; Granoszewski, Reference Granoszewski2003; Kupryjanowicz, Reference Kupryjanowicz2008; Kupryjanowicz et al., Reference Kupryjanowicz, Granoszewski and Fiłoc2018b), extending into the whole of central Europe (e.g., Kalnina et al., Reference Kalnina, Strautnieks and Cerina2007; Kupryjanowicz et al., Reference Kupryjanowicz, Granoszewski and Fiłoc2018b). It should be noted that most T. tomentosa pollen grains are difficult to distinguish from pollen grains of T. cordata (see Beug, Reference Beug2004). For this reason, they are usually included as T. cordata t. (e.g., Mamakowa, Reference Mamakowa1989). In light of this, pollen grains identified as T. tomentosa in the Jałówka profile were characterized by features that, according to Mamakowa (Reference Mamakowa1989), are specific to this species, including smaller funnel-shaped concavities and narrower thickenings of endexine surrounding an aperture that in width attenuates to almost no thickening at all. The coexistence of pollen grains with these distinctive characteristics, together with numerous nutlets of T. tomentosa in Eemian sediments at the Hieronimowo site, NE Poland (Kupryjanowicz et al., Reference Kupryjanowicz, Granoszewski and Fiłoc2018b), confirm the utility of Mamakowa's suggestion. The proportion of hornbeam in the study area stands was very low at that time. Riverine forests still occurred, but their extent was much smaller than during the older part of the hazel phase, because their habitats were partly transforming into alder carrs.
Vegetation development during the next phase of the Eemian (J-4 L PAZ, E5 R PAZ) was characterized by an expansion of hornbeam, which then became the predominant forest-forming species. Together with lime and hazel, Carpinus betulus constituted the principal component of mixed broadleaf forests. As the dominant tree, it probably formed the uppermost tree canopy. Alder still prevailed in waterlogged habitats, forming alder carrs. The proportion of Ulmus and Fraxinus pollen, lower than in the previous period, indicates a reduction in the extent of riverine forests. This, together with an increase in Picea abies t. pollen value (Fig. 3), suggests that elm and ash may have been gradually replaced by spruce (Picea). This likely resulted in the transformation of the ash–alder forests into alder–spruce riverine forests.
The older part of the hornbeam phase (J-4a L PASZ) witnessed an optimum development of ivy (Hedera) and mistletoe (Viscum). Their presence implies a warm and mild climate of suboceanic character.
The deep decline of C. betulus pollen values in the J-4b L PASZ does not reflect real changes in the forest communities during the younger part of the hornbeam phase. This downturn is probably the effect of a local underrepresentation of Carpinus pollen and local overrepresentation of Alnus and Tilia pollen, presumably resulting from repeated desiccations of the basin sediment. Alder carr, which by that time had developed within the studied depression (Fig. 3), is subject to significant seasonal changes in water level, so any sporomorphs deposited in alder carr peat would have had poor preservation or even no preservation at all. Sporomorph destruction caused by the periodic desiccation of basin sediments may have been a selective operation. Grains with a thin fragile sporoderm (e.g., C. betulus) decomposed faster, while those with a thick sporoderm (e.g., Alnus, Tilia) were more resistant to decomposition, which can help explain the latter's overrepresentation here in dry sediment layers (e.g., Kupryjanowicz et al., Reference Kupryjanowicz, Filbrandt-Czaja, Noryśkiewicz, Noryśkiewicz, Nalepka, Ralska-Jasiewiczowa, Latałowa, Wasylikowa, Tobolski, Madeyska, Wright and Turner2004).
An increase in coniferous tree values during younger part of the hornbeam phase (J-4b and J-4c L PASZ; Fig. 3) likely reflects a worsening of climatic conditions, suggesting the region was becoming colder and more humid. Such a climate adjustment might have advanced soil degradation as a result of acidification and podsolization (Iversen, Reference Iversen1973).
The Eemian interglacial spruce phase (J-5 L PAZ, E6 R PAZ; Fig. 3) was the first stage of an apparent cooling accompanied by an increase in wetness. Harshening climatic conditions promoted pedogenic changes connected to soil acidification and podsolization (Dzięciołowski and Tobolski, Reference Dzięciołowski and Tobolski1982). An intensification of soil-altering processes had already begun at the very beginning of the spruce phase (J-5a L PASZ), resulting in rapid vegetation changes. This transformation is reflected by an expansion of coniferous trees with a consequent reduction in deciduous trees that previously formed mixed broadleaf forests (Tilia, Carpinus), alder carrs (Alnus), and riverine forests (Ulmus, Quercus, Fraxinus).
A significant increase in the pollen value of P. abies t. in J-5b L PASZ indicates that a spruce appeared at that time in almost all forest types, with subsequent essential changes in the character of forest stands. Strong decreases in C. betulus, T. cordata t., and Corylus pollen values suggest a substantial diminution of the deciduous species component. Lime–hornbeam forests might have been replaced by various kinds of pine, pine–spruce, or spruce–pine forests.
A gradual rise in P. sylvestris pollen values coupled with a fall in P. abies t. (J-5c L PASZ) implies essential changes in composition of coniferous woodlands resulted from the spread of pine and reduction in spruce's relevance. No other forest type, except alder carrs, were present in the Jałówka vicinity at that time. This dearth of woody plant diversity may reflect a drastic worsening of the climate, especially an enhancement of continentality.
The pine phase (J-6 L PAZ, E7 R PAZ; Fig. 3) represented the latest stage of interglacial forest development. Increasing wetness and climate cooling resulted in a change of habitat conditions and, accordingly, the character of plant communities. Even during the oldest part of this phase (J-6a L PASZ) P. sylvestris became the truly dominant tree in the landscape, attaining its maximum development at this time. Pine trees formed thick boreal forests, which probably diversified into various types of pine communities. This expansion of pine forests was ushered in by the decline of all other forest-type communities. Spruce gradually lost its position as a subdominant forest component, a position that it had held at the beginning of this phase. Alder carr habitat decreased considerably, most likely replaced by marshy pine or spruce forests.
During the later part of the pine phase (J-6b L PASZ), pine forests became sparser, with slightly lower proportions of spruce, which was probably being replaced by birch. The area of open communities expanded more than in the previous period, as evinced by ascending NAP curves. Communities of cold steppe probably developed on arid sandy soils, reflecting a higher frequency of Artemisia, Poaceae, Chenopodiaceae, and Helianthemum oelandicum t. (Fig. 3). Plant communities resembling today's shrub tundra with shrub willow species (Salix) might have occupied moist habitats. Other marshy areas sustained tall herb communities, being the probable source of Thalictrum and Valeriana officinalis group pollen grains.
Temporary climate cooling seems to be the most probable cause of changes registered in J-6b L PASZ. It is presumed that the mean July temperature decreased to about 10°C (see Kupryjanowicz, Reference Kupryjanowicz2008). It is worth mentioning that the contemporary northern forest range limit is expressed by herb values of at least 50%, which coincides with the 10°C July isotherm (Zagwijn, Reference Zagwijn1989). In the Jałówka region, the proportion of herbs did not reach these high herb values. This deficiency suggests that the mean July and January temperatures were higher than the baseline values.
After a short cold period, the climate once again became slightly warmer (J-6c L PASZ). This amelioration was accompanied by the return of pine forests to some habitats that were previously occupied by birch and open vegetation. Forest associations were similar to those dominating the J-6a L PASZ. A new phase of Pinus forest development commenced, and this change was at the expense of herbaceous vegetation, as slightly milder, more temperate climate conditions prevailed.
Tendencies in the sequence of vegetational succession point to a continuous decline of climate conditions during the youngest part of the pine phase (J-6d L PASZ), which exemplifies a gradual increase in the proportion of both NAP and B. alba t. (Fig. 3). Cold steppe communities developed once again on arid sandy soils. Contemporary wet habitats would have been occupied by damp willow thickets and by rushes and sedges (Cyperaceae), and reeds (Phragmites). Meadow rue (Thalictrum) occurred in marsh and fen vegetation in a subsidiary role.
Early Weichselian (MIS 5d to MIS 5a)
During the first post-Eemian stadial of the early Weichselian (Herning, J-7 L PAZ, EV1 R PAZ) the vegetational landscape would have been a mosaic of cold steppe, tundra, and small shrub–willow clusters. An increase in the herbaceous plant pollen value of up to 50% and an increase in plant group diversity in tandem provide evidence of an expansion toward open plant communities of various types. With regard to trees, apparently only birch was extant (high values of B. alba t. pollen), forming small patches in open areas (Fig. 3). Very low percentages of P. sylvestris pollen indicate that pine had by then retreated considerably, so much so that even the potential of long-distance pollen transport was very low.
The disappearance of coniferous woodlands and a dominance of open vegetation indicate that the northern forest line was situated to the south of Jałówka. This suggests that the mean temperature of the warmest month was below 10°C and the mean temperature of the coldest month was below −5°C.
Environmental conditions had changed significantly during the Brørup interstadial (J-8 L PAZ, EV2 R PAZ). An older birch phase of this interstadial is represented in the study profile by just two pollen spectra (J-8a L PASZ; Fig. 3), which indicates an initial domination of birch forests had been followed by birch–pine forests containing a small admixture of spruce, as represented by pollen of P. abies t. Relatively high NAP values evince a low density of forests, indicating the existence of large areas covered by open communities of herb plants. However, the role of these associations was much smaller than during the preceding period.
In the middle part of the Brørup interstadial (J-8b L PASZ), the pollen record registered a brief expansion of open vegetation. Cold steppe communities with Artemisia, Poaceae, and Chenopodiaceae were reestablished in dry places. In wetter habitats, sedges, rushes, and reeds dominated. In marsh and fen vegetation, Thalictrum occurred regularly. Pine–birch forests were present in some habitats, as they had been at the end of the birch phase of the interstadial.
The pollen record of the last, pine phase of Brørup (J-8c L PASZ) is relatively well developed. An expansion of pine took place at that time, with a simultaneous but small decrease in the role of birch. Various types of pine and pine–birch forests emerged.
The Rederstall stadial (EV3 R PAZ) is represented in the study profile only by a single pollen spectrum (J-9 L PAZ). The presence of a cold continental climate led to an expansion of cold-steppe communities. This is indicated by the high pollen values of Artemisia, which was the most important element of those communities, and by a high proportion of Poaceae and Chenopodiaceae. Pollen of Anthemis, Aster, Helianthemum nummularium, Centaurea scabiosa, Silene, and Potentilla types is also likely derived from communities of the cold-steppe type. Wetter habitats were occupied by tall herb and moist meadow-like communities that supported Thalictrum and Polemonium. Forest communities decreased. Nevertheless, single trees and small groups of trees probably existed.
The Odderade interstadial (J-10 L PAZ, EV4 R PAZ) was the next period characterized by an expansion of trees exemplifying improving climatic conditions. Pinus and Betula were present, suggesting that this second stadial of the early Weichselian was not colder than the first one. The interstadial vegetation succession can be divided into four main parts. The first stage began with a spread of birch forests (J-10a L PASZ; Fig. 3). Tree birches dominated, whereas the role of pine was insignificant at the time. Note that the Pinus pollen value did not exceed 5%, hence it may be assumed that pine was almost completely absent from the Jałówka region. The relatively low values of NAP—including Artemisia and Poaceae—imply a reduction of open-steppe associations. Then pine slightly increased in area, which resulted in the transformation of birch forests into birch–pine communities (J-10b L PASZ). At the end of the interstadial (J-10d L PASZ), pine forests dominated. These forests were not very dense (NAP proportion ~10%; Fig. 3). Between the birch and pine phase of the Odderade interstadial, a temporary expansion of open communities took place (J-10c L PASZ), an apparent response to climate cooling.
Middle Weichselian (MIS 4)
Changes in vegetation composition point to a colder and more continental climate. Pine forests became sparse, so the overall area occupied by open communities increased. Meadow-like communities flourished again (high proportion of Poaceae pollen; Fig. 3). Steppe-like communities dominated by Artemisia gradually advanced.
STAGES OF AQUATIC AND MIRE VEGETATION DEVELOPMENT
Nutrient enrichment phase (SZ1–SZ3)
Beginning with the phase (SZ1; Fig. 4) the study basin was a shallow lake. Its periphery was overgrown by a reed swamp community with Thelypteris palustris, which is suggested by the abundant presence of spores of this species in the sediment. This community could also have been developed along with other ferns (spores of Filicales monolete), bryophytes (Bryales), Menyanthes trifoliata, and Typha angustifolia and/or Sparganium. The deepest parts of the basin contained stagnant water (possibly ~1–1.5 m deep according to our estimates) and were occupied by shallow-water plants such as Myriophyllum verticillatum and Nuphar luteum along with other Nymphaeaceae species (Fig. 4). This composition of vegetation suggests that the study basin was a small shallow eutrophic lake surrounded by wide zone of reed swamp.
Then in the SZ2 phase, a reed swamp community with T. palustris proliferated across the study paleolake (very high values of T. palustris and Filicales monolete spores). Terrestrialization resulted from a natural accumulation of sediments within the basin, the process potentially accelerated by a drop in paleolake water level caused by increased transpiration associated with an interglacial climatic optimum (Fig. 4). A similar water-level decrease was also recorded in an earlier study of a neighboring lake that was located in the same depression. The accumulation of biogenic sediments in the second lake clearly ended at the same time (Rychel et al., Reference Rychel, Karasiewicz, Krześlak, Marks, Noryśkiewicz and Woronko2014).
During the youngest part of the eutrophic phase (SZ3), the study basin area was colonized by alder (high values of Alnus pollen and Alnus wood remains within the peat). Alder frequently invades habitats derived from dried-up and overgrown small water bodies (Jörgensen, Reference Jörgensen1963). Tree presence in the study basin is implied by the presence of fungal spores that had once been living on live trees and decaying wood (Diporotheca, Kretzschmaria deusta, Arnium, Glomus, and Cercophora), as detected in basin sediments. Specifically, an occurrence of Diporotheca rhizophila may be an indicator of soil erosion due to livestock trampling within a wetland and/or lakeshore ecosystem (Hillbrand et al., Reference Hillbrand, Hadorn, Cugny, Hasenfratz, Galop and Haas2012, Reference Hillbrand, van Geel, Hasenfratz, Hadorn and Haas2014). This species is known to grow in association with ungulates feces, so the presence of D. rhizophila spores can attest to the high stability of the basin's enclosing soil, being solid enough to allow animal penetration into the study basin (or animals visited this place when the ground was frozen or the season was particularly dry). Alder carrs are by nature characterized by significant seasonal changes in water level, so any sporomorphs deposited in carr peat accumulated at that time would likely have been poorly preserved or not preserved at all in some layers (Fig. 3).
Shift toward mesotrophy (SZ4)
Alder growing in the study basin at this time dwindled, which would have involved an encroachment of spruce and pine into the carr stands. This shift could be associated with changes in the climate, which became colder and more humid, encouraging further soil degradation through acidification and podsolization (Iversen, Reference Iversen1973; Dzięciołowski and Tobolski, Reference Dzięciołowski and Tobolski1982). The decrease in Alnus pollen value suggests a diminution in alder communities. Alder carr habitat was likely reduced for the most part because of swampy spruce and pine forest succession (maximum of P. abies t., increased values of P. sylvestris t.). This transformation is confirmed by the occurrence in the sediment of Osmunda regalis, a fern well adapted to acidic, wet, peaty humus-rich soil (Fig. 4).
Mesotrophic phase (SZ5)
A continued progression of soil acidification and oligotrophization led to the complete disappearance of alder carr and allowed their replacement by boggy pine forest at the beginning of this phase (SSZ5a). The tree forest component became pine dominated, probably with an admixture of birch, while Sphagnum mosses were abundant on the forest floor (Fig. 4).
Then, Lemna and green algae (Botryococcus, Pediastrum) developed (SSZ5b; Fig. 4), signifying waterlogging of the study basin, as the depression likely transformed into an open-water lake.
In the middle part of the mesotrophic phase (SSZ5c–SSZ5d), the water level in the study basin dropped, leaving the basin to function as a mire densely covered by sedges (Cyperaceae) and bryophytes (Bryales). Numerous spores of coprophilous fungi (Cercophora, Gelasinospora, Glomus, Arnium) were found in the mire sediment. They could have developed on abundant dead wood floating upon the pond surface as a result of trees being killed by the rising water level during the previous phase. However, it cannot be ruled out that some of the many fungal spores detected in the sediment might have originated from inflowing surface water. The cold arctic climate was particularly intense at that time, so significant deforestation would have enveloped the land surrounding the study basin paleolake.
The study basin had become a mire formed by bryophytes or by bryophytes and sedges (SSZ5d). An abundant growth of Equisetum may signify an increased water level leading to the spread of horsetails (Fig. 4).
The increased share of Pediastrum, Botryococcus, and Tetraedron algae indicates a further increase of the water level in the study basin, now functioning again as a lake. High values of Sphagnum spores and the presence of Myriophyllum alternifolium pollen (SSZ5e; Fig. 4) suggest that dystrophic areas existed in the lake.
ASYNCHRONY IN THE UPPER BOUNDARY OF TERRESTRIAL EEMIAN AND MIS 5E
The Eemian interglacial period is recognized as an interval dominated by forest elements, as defined by vegetation development. It had been preceded by open vegetation during the previous glacial–late glacial period, then succeeded by open vegetation at the beginning of the last glacial complex. This interglacial period was for many years considered to be an equivalent of MIS 5e, as anticipated by Shackleton (Reference Shackleton1969). However, at the turn of the last century, Kukla et al. (Reference Kukla, McManus, Rousseau and Chuine1997, Reference Kukla, de Beaulieu, Svobodova, Andrieu, Thouveny and Stockhausen2002) proposed that the Eemian in NE France is not a terrestrial equivalent of MIS 5e, but instead encompasses the entire MIS 5e and an older part of MIS 5d. This countervailing proposal is based on an indirect correlation between benthic isotopic curves from North Atlantic cores and the Grande Pile pollen record from NE France. Later investigations further revealed that in southern Europe the Eemian also lacks a precise relationship to MIS 5e. For example, studies of Sánchez-Goñi et al. (Reference Sánchez-Goñi, Eynaud, Turon and Shackleton1999, Reference Sánchez-Goñi, Loutre, Crucifix, Peyron, Santol, Duprat, Malaizé, Turon and Peypouquet2005) and Shackleton et al. (Reference Shackleton, Chapman, Sánchez-Goñi, Pailler and Lancelot2002, Reference Shackleton, Sánchez-Goñi, Pailler and Lancelot2003), based on a direct correlation of marine and terrestrial climatic records in the MD95-2042 profile from the SW Iberian Peninsula margin, have shown that the Iberian vegetational Eemian ended ~5000–6000 years after the transition between MIS 5e and MIS 5d, as determined by a substantial accumulation of ice that developed in high northern latitudes, defined as the GS25 Greenland stadial and C26 and C25 North Atlantic cold events.
Pollen profile J6 from the Jałówka site is especially interesting, in that it reflects climate oscillations at the end of the Eemian interglacial period, during the pine phase (E7 R PAZ, J-6 L PAZ). The oldest part of this phase (J-6a L PASZ) was characterized by the dominance of dense pine forests. Then the area of pine shrank slightly (J-6b L PASZ). There was also a coeval increase in abundance of herbaceous plants and birch. Both these events were probably in response to a drop in temperature. A subsequent restoration of Pinus (J-6c L PASZ) reflected temporary climate amelioration. Finally, at the close of the interglacial period (J-6d L PASZ), the regional climate gradually and consistently deteriorated until there was a return to glacial conditions.
Climate-induced changes in vegetation within the Eemian pine phase registered in the J-6 profile from Jałówka are rather minor. So we can assume that the cooling in the middle of this phase was insignificant. However, pollen records encoded in some profiles from NE Poland document this cold climatic oscillation as much more pronounced (Kupryjanowicz et al., Reference Kupryjanowicz, Ciszek, Mirosław-Grabowska, Marciniak and Niska2005; Kupryjanowicz, Reference Kupryjanowicz2008). This phenomenon can also be seen at several other Polish sites, such as Konopki Leśne and Szwajcaria 1 (Borówko-Dłużakowa and Halicki, Reference Borówko-Dłużakowa and Halicki1957), Nakło (Noryśkiewicz, Reference Noryśkiewicz1978), Imbramowice (Mamakowa, Reference Mamakowa1989), and Horoszki Duże (Granoszewski, Reference Granoszewski2003). The regional scale of this phenomenon is clearly visible on isopollen maps (Kupryjanowicz et al., Reference Kupryjanowicz, Granoszewski, Nalepka, Pidek, Walanus, Balwierz and Fiłoc2016).
The cold event that registered in the middle part of the Eemian pine phase (E7 R PAZ) should not be considered (according to its palynological criteria) as an initial stadial to the glacial period that followed the Eemian interglacial period (Kupryjanowicz et al., Reference Kupryjanowicz, Granoszewski, Nalepka, Pidek, Walanus, Balwierz and Fiłoc2016). This pollen zone is decidedly too low in NAP values (<10%) and too limited in herb taxa variety for such an inclusion. A palynologically defined boundary of the Eemian and early Weichselian can only be placed above this zone, as such a rise in herb pollen values indicates a decline of closed forests co-occurring with the formation of open subarctic communities having a fairly high proportion of compositionally diversified heliophytes. These are the same criteria that have been applied since the middle of the twentieth century across the whole of Europe to establish the upper boundary of the Eemian interglacial period (e.g., Andersen et al., Reference Andersen, Vries and Zagwijn1960; Zagwijn, Reference Zagwijn1961; Erd Reference Erd1973; Mamakowa, Reference Mamakowa1989).
Similar climatic fluctuations during the final part of the Eemian interglacial period have been registered across numerous sites in western, central, and eastern Europe. In an Eemian sequence from Gröbern, Germany, stable isotope data indicated that a brief cooling was followed by a pronounced warming toward the very end of the interglacial period—just before the transition to the glacial epoch (Boettger et al., Reference Boettger, Novenko, Velichko, Borisova, Kremenetski, Knetsch and Junge2009). A congenial climate oscillation was also recorded in other German profiles (Odderade [Averdieck, Reference Averdieck1967]; Sulzberg-Baden [Welten, Reference Welten and Kasser1981]; Gondiswill [Wegmüller, Reference Wegmüller1986]; Klinge [Striegler, Reference Striegler and Cepek1986; Novenko et al., Reference Novenko, Seifert-Eulen, Boettger and Junge2008]; Neumark-Nord [Eissmann, Reference Eissmann2002; Velichko et al., Reference Velichko, Novenko, Pisareva, Zelikson, Boettger and Junge2005; Novenko et al., Reference Novenko, Seifert-Eulen, Boettger and Junge2008; Hermsdorf and Strahl, Reference Hermsdorf and Strahl2008]. Strong abrupt cooling was accompanied by intensive loess deposition during the late Eemian aridity pulse, as noted by Sirocko et al. (Reference Sirocko, Seelos, Schaber, Rein, Dreher, Diehl, Lehné, Jäger, Krbetschek and Degering2005) and by Seelos and Sirocko (Reference Seelos, Sirocko, Sirocko, Claussen, Sánchez Goni and Litt2007) in northern and western Germany. A cold oscillation in the late part of the Eemian interglacial period has been described at the Les Echets site, southern France (de Beaulieu and Reille, Reference Beaulieu and Reille1989) and at the Brørup site, the Netherlands (Andersen, Reference Andersen1961). This event is also distinctly visible in the reconstruction of mean January and July temperatures in Bispingen, northern Germany (Kühl and Litt, Reference Kühl and Litt2003). In eastern Europe, cooling and then slight warming occurred at the very end of the last interglacial period in the profile from Ples, upper Volga region (Novenko et al., Reference Novenko, Seifert-Eulen, Boettger and Junge2008), and additionally recognized in several other profiles in the northwest Russian Plain (e.g., Grichuk, Reference Grichuk and Markov1961; Borisova et al., Reference Borisova, Novenko, Velichko, Kremenetski, Junge and Boettger2007) and into Lithuania (Kondratiene, Reference Kondratiene1996).
Even though the Eemian pine-phase cold oscillation has not been recorded in the many other European profiles, its absence may be due to different reasons. In some cases, the final part of the Eemian interglacial oscillation sediment record is scant; the encompassing layer is too thin to be noticed with the standard resolution of pollen analysis (every 5–10 cm). According to de Beaulieu and Reille (Reference Beaulieu and Reille1989), it is also possible that this short and low-amplitude oscillation induced notable vegetation changes only adjacent to ecotones in north-central and eastern Europe. For these reasons, it is proposed that the cool event within the E7 R PAZ in retrospect was not distinguished in Mamakowa's (Reference Mamakowa1989) regional palynostratigraphy for Poland and was missed in some other European palynostratigraphies (e.g., in those for the Netherlands, Germany, and Belarus) (Fig. 5). However, as shown in more recent studies, this elusive pollen record appears to be quite commonly noted (e.g., Kupryjanowicz et al., Reference Kupryjanowicz, Granoszewski, Nalepka, Pidek, Walanus, Balwierz and Fiłoc2016). As a result, the record is registered in pollen profiles where the final phase of the Eemian interglacial period has been investigated with high stratigraphic resolution.
It has been decidedly difficult to correlate abrupt late Eemian intra–interglacial climatic oscillations contained within European terrestrial records with records currently associated with cold and warm events contained within Greenland ice and North Atlantic cores. A lack of absolute age attribution to a specific record of change is undoubtedly where current difficulties lie. Lüthgens et al. (Reference Lüthgens, Böse, Lauer, Krbetschek, Strahl and Wenske2011) established the first time frame of the Eemian interglacial period in central Europe based on OSL techniques involving a terrestrial sedimentary archive from the Vevais site, NE Germany. The Eemian onset was dated to 126 ± 16 ka, and its termination to 108.9 ± 7.8 ka. The U/Th data obtained for five samples from the Eemian profile at Hinterste Mühle, NE Germany, have yielded an age of 116 ± 13/10 ka (Börner et al., Reference Börner, Hrynowiecka, Stachowicz-Rybka, Niska, Moskal-del Hoyo, Kuznetsov, Maksimov and Petrov2018). Unfortunately, in both cases the dating standard deviation error is large enough to disable comparison with the time frame defined for the Eemian interglacial period in southern Europe by Brauer et al. (Reference Brauer, Allen, Mingram, Dulski, Wulf and Huntley2007). The last study set 127.2 ± 1.6 ka as the Eemian onset, which then lasted for 17.7 ± 0.2 ka.
The only direct evidence for correlation between the continental and ocean records derives from marine core MD95-2042, obtained from the southwestern margin of the Iberian Peninsula (Sánchez Goñi et al., Reference Sánchez-Goñi, Eynaud, Turon and Shackleton1999, Reference Sánchez Goñi, Turon, Eynaud and Gendreau2000, Reference Sánchez Goñi, Sirocko, Claussen, Sánchez Goñi and Litt2007). In this profile, the end of the palynologically defined Eemian interglacial period was younger than a substantial cooling event demonstrated in the MIS 5e/MIS 5d transition. That transition appeared in the isotope record, occurring synchronously in the North Atlantic associated with the C26 and C25 cold event surface temperatures (Fig. 6). Both of these marine cold events were correlated with GS26 cooling in Greenland (Sánchez Goñi et al., Reference Sánchez Goñi, Sirocko, Claussen, Sánchez Goñi and Litt2007).
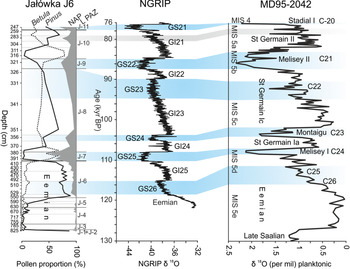
Proposed correlation of changes in pollen percentage values of Pinus, Betula, and herb pollen (NAP) in the Jałówka J6 profile with NGRIP δ 18O record (according to NGRIP Members, 2004) on the GICC05modelext time scale, and δ 18O record in marine core MD95-2042 (according to Sánchez Goñi, Reference Sánchez Goñi, Sirocko, Claussen, Sánchez Goñi and Litt2007). Cold periods are shaded in blue. The North Atlantic sea-surface cooling events (C26 to C20) and the terrestrial stadials and interstadials follow Sánchez Goñi (Reference Sánchez Goñi, Sirocko, Claussen, Sánchez Goñi and Litt2007). The correlation between the marine and terrestrial events in MD95-2042 core and the NGRIP record was inferred from fig. 13.1 in Sánchez Goñi (Reference Sánchez Goñi, Sirocko, Claussen, Sánchez Goñi and Litt2007). GS, Greenland stadials; GI, Greenland interstadials. Original data for MD95-2042 core were downloaded from doi: 10.1594/PANGEA.58228; and for NGRIP from www.iceandclimate.dk/data. Cold periods defined as stadials are shaded in blue. Slight cooling not distinguished as stadials is shaded in gray. (For interpretation of the references to color in this figure legend, the reader is referred to the web version of this article.)

In our opinion, abrupt vegetational and climatic changes during the youngest part of the Eemian interglacial period are represented in the Jałówka J6 profile, specifically the three upper subzones of J-6 Pinus L PAZ, and may correspond to the older part of the MIS 5d, not to MIS 5e. The temporary intra-Eemian cooling (J-6b L PASZ) may be better correlated with the C26 and C25 North Atlantic cold events and GS26 Greenland stadial, while the subsequent improvement of climate (J-6c L PASZ) is better correlated with the GI25 Greenland interstadial (Fig. 6).
A diachronic upper boundary of the Eemian interglacial period in terrestrial European pollen profiles and MIS 5e in deep-marine sediments has been suggested in many papers (e.g., Sier et al., Reference Sier, Peeters, Dekkers, Pares, Chang, Busschers, Cohen, Wallinga, Bunnik and Roebroeks2015). At the same time, many authors proved that the glacial inception in the North Atlantic, as marked by the C26 event, implied a strong shift in European continental environments (e.g., McManus et al., Reference McManus, Bond, Broecker, Johansen, Labeyrie and Higgins1994; Kühl and Litt, Reference Kühl and Litt2003; Müller and Kukla, Reference Müller and Kukla2004; Sánchez Goñi et al., Reference Sánchez-Goñi, Loutre, Crucifix, Peyron, Santol, Duprat, Malaizé, Turon and Peypouquet2005). Warm-temperate broadleaf plants persisted, but only at sites south of 48°N and only in reduced quantities (Tzedakis et al., Reference Tzedakis, Frogley and Heaton2003; Müller and Kukla, Reference Müller and Kukla2004). An alpine signature of C26—testified to by a major δ18O drop—interrupted the relatively stable minor δ18O interglacial values derived from an Austrian Alps cave, here U/Th dated between 119 ± 2 ka and 117 ± 2 ka (Meyer et al., Reference Meyer, Spotl and Mangini2008).
CORRELATION OF EARLY WEICHSELIAN CLIMATE OSCILLATIONS IN EUROPE WITH GREENLAND AND NORTH ATLANTIC EVENTS
J-7 L PAZ from the Jałówka J6 pollen profile represents the first post-Eemian cooling of the early Vistulian and its attendant pronounced reduction in forest cover (Figs. 4 and 6). These data suggest a very dry and cold continental climate prevailed. The stratigraphic position and climatic signature of J-7 L PAZ allow its correlation with the first stadial after the Eemian. Thus, the Herning at 45°N in Europe may now be correlated with the GS25 Greenland stadial (Müller and Kukla, Reference Müller and Kukla2004) with onset at 110.5 ± 1.5 ka (NGRIP Members, 2004) and correlated with the C24 stadial in North Atlantic cores, and with both correspondents belonging to the younger part of MIS 5d (Fig. 6).
The J-8L PAZ characterizes a new forest phase that correlates with the first interstadial of the early Weichselian—that is, the Brørup sensu lato—and with MIS 5c (Figs. 5 and 6). The pollen record of its older birch phase reflects the GI24 interstadial in Greenland cores and in North Atlantic warm event W23 records but is poorly developed in profile J6 from Jałówka.
A peak of Betula in J-8a L PASZ foreruns a short, sudden episode of reduced forestation, along with herb peaks, as shown in J-8b L PASZ (Fig. 4). These peaks could be correlated to the Montaigu event, first found in the La Grand Pile record (Woillard, Reference Woillard1978) and interpreted as an abrupt cooling that may be synchronous across Europe (Müller and Sánchez Goñi, Reference Müller, Sánchez Goñi, Sirocko, Claussen, Sánchez Goñi and Litt2007). It is believed to match the GS24 Greenland stadial and North Atlantic C23 cold event dated to ~103 ka (Shackleton et al., Reference Shackleton, Sánchez-Goñi, Pailler and Lancelot2003). Cooling within the Brørup interstadial has not been distinguished in Mamakowa's (Reference Mamakowa1989) regional palynostratigraphy. Nevertheless, this abrupt cooling period has been quite commonly identified in more recent profiles from Poland (e.g., Granoszewski, Reference Granoszewski2003; Kupryjanowicz, Reference Kupryjanowicz2008).
After a short contraction related to the Montaigu event (GS24, C23) the forest quickly recovered during the younger part of the Brørup interstadial (J-8c L PASZ). The transition to pine forests with a small admixture of Picea points to an increase in temperature at a time that probably corresponds to GI23 (Figs. 5 and 6).
Open communities returned to dominance during the second post-Eemian stadial (J-9 L PAZ), which corresponds to the German Rederstall and French Melisey II, as well as the GS23 and GS22 Greenland stadials and C22 and C21 marine stadials (Figs. 5 and 6). Evidence for an interstadial occurrence between these two stadials (GI22, W21) is not registered in the pollen record from Jałówka. This absence is most likely due to insufficient pollen analysis resolution, which was too low due to the slow rate of sediment accumulation in this part of the study profile. However, a slight warming at the end of the Brørup corresponding to this interstadial has been noted in some NE Poland profiles, for example, at the Dzierniakowo and Solniki sites (Kupryjanowicz, Reference Kupryjanowicz2008).
Trees expanded again in the J-10 local pollen zone, which represents the second interstadial of the early Weichselian—Odderade/Saint Germain II being an equivalent to MIS 5a as well as the Greenland GI21 and marine W20 interstadials (Figs. 6). This is similar to numerous other sites in Poland. This interstadial's pollen record is characterized in the Jałówka J6 profile by a steady domination of Pinus and by a short but strong increase of Betula only at the very beginning of the interstadial.
The uppermost pollen zone in the Jałówka J6 profile (J-11 L PAZ) corresponds to the very beginning of the middle Weichselian, marking the onset of MIS 4—that is, the Schalkholz stadial in European terrestrial profiles (GS21 and C20 stadials) (Figs. 5 and 6).
Direct pollen-based correlation of individual central European interstadials with their respective Greenland interstadials (GI) is problematic. This issue is due to the biological similarity between subsequent interstadial zones; it is not currently feasible to compare the two without the support of independent proxies being developed in the same core, as was done for the offshore Iberian cores of Sánchez Goñi et al. (Reference Sánchez Goñi, Landais, Fletcher, Naughton, Desprat and Duprat2008).
On a basis of a chronology from Lago di Monticchio, southern Italy (Allen and Huntley, Reference Allen and Huntley2000, Reference Allen and Huntley2009; Allen et al., Reference Allen, Watts and Huntley2000; Brauer et al., Reference Brauer, Mingram, Frank, Gu, Schettler, Wulf, Zolitschka and Negendank2000, Reference Brauer, Allen, Mingram, Dulski, Wulf and Huntley2007; Wulf et al., Reference Wulf, Keller, Paterne, Mingram, Lauterbach, Opitz and Sottili2012), the absolute age of primary climatostratigraphic units within the early Weichselian in southern Europe could be determined, including (1) the lower boundary of the Herning stadial (the upper part of MIS 5d) is dated at ~109.5 ka; (2) the beginning of the Brørup sensu lato interstadial (MIS 5c) at 107.60 ka and its end at 86.6 ka; and (3) the onset of the Odderade interstadial (MIS 5a) at 84.2 ka and its close at 75.4 ka. On the other hand, the upper boundary of the Odderade (MIS 5a) in the profile from the Oerel site, Germany, was dated by radiocarbon methodology at ~61.0 ka BP (Behre and van der Plicht, Reference Behre and van der Plicht1992). Another date was provided by Welten (Reference Welten1982) at 61.3 ka from Dürnten in the Alpine Foreland.
CONCLUSIONS
Pollen data obtained from the Jałówka J6 profile have allowed the reconstruction of changes in terrestrial vegetation in NE Poland during the Eemian interglacial period and early Weichselian, along with the development of mire–lacustrine communities that grew at that time. The pollen record documents two abrupt changes in forest vegetation illustrated by sharp decreases in tree pollen along with a simultaneous rise in herb pollen.
The older climate change was the intra–interglacial event that occurred at the end of the Eemian interglacial period, during its pine phase (E7 R PAZ). Because this event was also registered at many other sites located across various parts of Europe (e.g., Poland, Germany, Russia, and in France as the aforementioned Woillard event), it can be inferred that the event was caused by regional—not local—factors. In our opinion, the change correlates well with the GS26 stadial in the Greenland cores and with the C25 cold event in North Atlantic records. These findings allow us to speculate that the Eemian in NE Poland may comprise not only MIS 5e, but also a part of MIS 5d. This supposition could shed light on the potential for non-synchrony boundaries of MIS 5e and a terrestrial (vegetational) Eemian in Europe. A thesis invoking non-synchrony is developed in light of paleoecological studies from the last two decades. However, only through precise independent dating controls can a theory such as the one proposed here be more widely tested.
A younger, more abrupt climate change was the intra–interstadial cooling event that occurred within the first interstadial of the early Weichselian (EV2 R PAZ; Brørup; MIS 5c), at the transition between its birch and pine phases. A similar event was palynologically documented at some other Polish sites. The change corresponds to a stadial separating the Amersfoort and Brørup sensu stricto interstadials in The Netherlands, to the Montaigu event recognized in France, and to the Greenland GS26 stadial and C25 cooling of the North Atlantic.
Moreover, shifts in study basin development were recognized. First, it was a small and shallow eutrophic lake with a wide zone of reed swamp. During the middle Eemian hornbeam phase (E5 R PAZ), an alder carr expanded at this place. At the turn of the hornbeam and spruce phases (E5/E6 R PAZ), the carr's transformation toward spruce and/or pine boggy forest started, due to conditions changing to mesotrophic or slightly oligotrophic. This process intensified at the transition to the pine phase (E7 PAZ), which led to the complete disappearance of alder carr, replacing it with a boggy pine forest. At the very end of the Eemian interglacial period, the basin became a waterlogged peat bog. Then it functioned as a lake throughout almost the entirety of the early Weichselian and continued as such up to the beginning of the middle Weichselian, except during the Herning stadial (EV1 R PAZ; upper part of the MIS 5d), when it was again, albeit temporarily, a peat bog.
Acknowledgments
We are grateful Karl-Ernst Behre and an anonymous reviewer, as well as editors Derek B. Booth and Pete Langdon, for their comments on the article and valuable suggestions for improving it. Mark Demitroff (Stockton University, USA) is thanked for English proofreading that significantly improved our article.
Financial Support
This work was financially supported by the Polish Ministry of Science and Higher Education (research project no. UMO-2013/09/B/ST10/02118).