INTRODUCTION
Varroa destructor (Acari: Varroidae) is a haemolymph feeding parasitic mite of the honeybee (Apis spp.) that has been implicated in global colony losses (Rosenkranz et al. Reference Rosenkranz, Aumeier and Ziegelmann2010). Mites can either be found on adults or inside cells containing developing brood (Donzé and Guerin, Reference Donzé and Guerin1994). Of all honeybee life stages, pupae are the most exposed to damage as a result of prolonged mite feeding during development (Rosenkranz et al. Reference Rosenkranz, Aumeier and Ziegelmann2010). Damage caused by Varroa mites during feeding on individuals has been reported in honeybees in Europe and the USA, with the most pronounced effects being a reduction in the weight, water content, haemolymph protein content, haemolymph volume, carbohydrate titre, hypopharyngeal gland development and ultimately the lifespan (De Jong et al. Reference De Jong, De Jong and Gonçalves1982; De Jong and De Jong, Reference De Jong and De Jong1983; Glinski and Jarosz, Reference Glinski and Jarosz1984; Weinberg and Madel, Reference Weinberg and Madel1985; Schneider and Drescher, Reference Schneider and Drescher1987; Bowen-Walker and Gunn, Reference Bowen-Walker and Gunn2001; Duay, Reference Duay2002; Duay et al. Reference Duay, De Jong and Engels2003; Amdam et al. Reference Amdam, Hartfelder, Norberg, Hagen and Omholt2004; Contzen et al. Reference Contzen, Garedew, Lamprecht and Schmolz2004; Yang and Cox-Foster, Reference Yang and Cox-Foster2007; Pinto et al. Reference Pinto, Souza, Sanches and Serrão2011; Annoscia et al. Reference Annoscia, Del Piccolo and Nazzi2012; van Dooremalen et al. Reference van Dooremalen, Gerritsen, Cornelissen, van der Steen, van Langevelde and Blacquière2012).
In addition to the direct physiological damage caused by feeding, Varroa mites can transmit several viruses and other pathogens (e.g. bacteria and fungi) to honeybees (Strick and Madel, Reference Strick, Madel, Needham, Page, Delfinado-Baker and Bowman1988; Glinski and Jarosz, Reference Glinski and Jarosz1992; Liu, Reference Liu1996; de Miranda et al. Reference de Miranda, Bailey, Ball, Blanchard, Budge, Chejanovsky, Chen, Gauthier, Genersch, de Graaf, Ribière, Ryabov, De Smet, van der Steen, Dietemann, Ellis and Neumann2013; McMenamin and Genersch, Reference McMenamin and Genersch2015) that can negatively affect the individual honeybee and possibly the whole colony. As a result, beekeepers in most countries have to treat their colonies annually to ensure their survival (Rosenkranz et al. Reference Rosenkranz, Aumeier and Ziegelmann2010). However, some honeybee populations survive mite infestations without chemical treatment (De Jong and Soares, Reference De Jong and Soares1997; Kefuss et al. Reference Kefuss, Vanpouke, De Lahitte and Ritter2004; Fries et al. Reference Fries, Imdorf and Rosenkranz2006; Le Conte et al. Reference Le Conte, de Vaublanc, Crauser, Jeanne, Rousselle and Bécard2007; Seeley, Reference Seeley2007; Locke and Fries, Reference Locke and Fries2011; Locke et al. Reference Locke, Le Conte, Crauser and Fries2012; Seeley et al. Reference Seeley, Tarpy, Griffin, Carcione and Delaney2015). It is not yet clear whether their survival is due to tolerance that limits the detrimental effects of parasitism on the host or exclusively to resistance mechanisms reducing the fitness of the parasites (Råberg et al. Reference Råberg, Sim and Read2007, Reference Råberg, Graham and Read2009).
Since wild colonies cannot be treated, wild populations of European A. mellifera have, with a few exceptions, been eradicated by the invasive mite (Seeley et al. Reference Seeley, Tarpy, Griffin, Carcione and Delaney2015). Such negative effects could result in significant selection among colonies exposed to the mites, especially in honeybee populations that are not being managed by beekeepers, e.g. the wild population in Africa (Dietemann et al. Reference Dietemann, Pirk and Crewe2009; Pirk et al. Reference Pirk, Human, Crewe and vanEngelsdorp2014). In South Africa, the presence of Varroa mites was first recorded in savannah (Apis mellifera scutellata) and Cape (Apis mellifera capensis) honeybee colonies in the late 1990s (Allsopp, Reference Allsopp1997, Reference Allsopp2006; Martin and Kryger, Reference Martin and Kryger2002). It has been suggested that in both South African sub-species there has been selection among colonies for survival to mite infestation. In A. m. capensis, the short post-capping stage (Moritz, Reference Moritz1985), grooming behaviour (Moritz and Mautz, Reference Moritz and Mautz1990) and the removal of mites through hygienic behaviour are likely explanations for colony survival (Allsopp, Reference Allsopp2006). In A. m. scutellata colonies, survival has been attributed to reduced Varroa population growth (Strauss et al. Reference Strauss, Pirk, Crewe, Human and Dietemann2015) and the low prevalence of viruses (Strauss et al. Reference Strauss, Human, Gauthier, Crewe, Dietemann and Pirk2013).
To gain a better insight into the factors that contribute to colony survival in A. m. scutellata, we investigated the physiological effects of the parasite at the individual host level. We assessed the degree of tolerance of uninfested and mite-infested individuals by estimating the physiological costs of parasitism on weight, water, lipid and protein content of individuals. The fertility, fecundity and reproductive success of mites were similarly compared to determine resistance to the parasite. Since Varroa mites reproduce on drones and workers of A. mellifera (Rosenkranz et al. Reference Rosenkranz, Aumeier and Ziegelmann2010), we considered brood of both sexes. Drones are of particular interest since variation in physiological parameters, such as weight have direct effects on flight ability and sperm quantity (Jarolimek and Otis, Reference Jarolimek and Otis2001; Schlüns et al. Reference Schlüns, Schlüns, van Praagh and Moritz2003). Indeed, male competition appears particularly high in African honeybee populations (Wallberg et al. Reference Wallberg, Han, Wellhagen, Dahle, Kawata, Haddad, Simões, Allsopp, Kandemir, De la Rúa, Pirk and Webster2014). Slight variations in the damage caused by parasitism can have large and direct effects on their competitiveness and hence on their fitness (Jandricic and Otis, Reference Jandricic and Otis2003). Measurement of the damage caused to individuals and of the reproductive success of the Varroa mite in savannah honeybee colonies allows for a better understanding of the various ways survival to V. destructor develops in honeybee populations. This knowledge is crucial to develop programmes aimed at the sustainable mitigation of losses caused by this parasite (Dietemann et al. Reference Dietemann, Pflugfelder, Anderson, Charrière, Chejanovsky, Dainat, de Miranda, Delaplane, Dillier, Fuchs, Gallmann, Gauthier, Imdorf, Koeniger, Kralj, Meikle, Pettis, Rosenkranz, Sammataro, Smith, Yañez and Neumann2012). In addition, investigating Varroa mites in the presence of a potentially resistant and/or tolerant honeybee population like the one in South Africa will improve our general understanding of this host–parasite interaction.
MATERIALS AND METHODS
Collection of honeybees
Queenright honeybee (A. m. scutellata) colonies situated at the Experimental Farm of the University of Pretoria, South Africa were used in this study. These colonies were trapped in the wild and were never treated against Varroa mites. Drone combs were mainly collected during spring, and on some occasions during autumn and winter. Worker combs, on the other hand, were mostly collected during autumn and winter and in some cases during spring and summer. To reduce disturbance triggered absconding of the colonies, combs with capped brood were removed from the colonies and placed in an incubator (Labcon Model LTIE, South Africa) at 34 °C until a sufficient number of samples were collected. Drone and worker comb were kept for 2·9 ± 0·4 and 3·0 ± 2·1 days, respectively, in the incubator. The number of days brood was kept in the incubator did not affect mite reproduction. For drones, 35 ± 25 (mean ± s.d.) cells in each of 13 colonies and for workers 100 ± 0 cells in each of 15 colonies were examined for the presence of adult Varroa mites and their offspring. Only cells in which individuals just started to chew through the wax capping were used to prevent any mites from escaping before they could be counted. Thus, only honeybees that were physically able to emerge from their cells were included. We used individuals at the time of emergence, because this encompasses the whole period during which Varroa mites feed on their hosts and reproduce. Opening the cells before emergence would have reduced the extent of damage caused by these mites and biased the measure of their reproductive output. The observed number of honeybees with deformed wings or no wings at emergence was recorded.
Measures of physiological costs of parasitism in emerging drones and workers
The weight, water, lipid and protein content of Varroa infested and uninfested drones and workers was measured to quantify the physiological cost of parasitism by V. destructor. Following collection (as described above), individual drones (n = 452) and workers (n = 1500) were weighed (Mettler Toledo MS204S, Switzerland) to the nearest 0·1 mg, placed in Eppendorf tubes and stored in the freezer (−20 °C) until analysis. To measure the water content, all the drones and workers were transferred to 24 well cell culture plates (Thermo Fisher Scientific, Rochester, NY, USA) and dried in an incubator (Memmert HCP 108, GmbH + Co.KG, Schwabach, Germany) at 60 °C until constant mass was reached. To determine the water content of each drone and worker, the final dry weight was subtracted from the original wet weight. The dried honeybees were placed in the freezer (−20 °C) until the lipid and protein content was measured.
For lipid and protein quantification, the methods of Human et al. (Reference Human, Archer, du Rand, Pirk and Nicolson2014) were used. The legs and wings of drones (83 < n < 85 from 13 colonies) and workers (n = 88 from 15 colonies) were removed, and the individuals were weighed again to obtain dry weight without legs and wings. Briefly, for lipid analysis, 2 and 1 mL of Folch's reagent (2:1 chloroform:methanol) was added to drones and workers, respectively, once every 24 h for 3 days in a fume hood. Heavy duty household foil was used to cover the vials after the first two washes and after the last wash the foil was removed to allow the reagent to evaporate. Twenty-four hours after the last wash, drones and workers were placed into an incubator (Memmert HCP 108, GmbH + Co.KG, Schwabach, Germany) at 60 °C to dry for 3 days. Drones and workers were then weighed (Mettler Toledo MS204S, Switzerland) again to determine their dry weight after lipid removal by the reagent.
For protein analysis, drones and workers were individually homogenized in a lysis buffer [40 mm Tris: pH 7·6, 7 m urea, 2% (v/v) Triton X-100 and SIGMAFAST Protease Inhibitor tablets] (300 and 200 µL per drone and worker, respectively) using pestles. Samples were sonicated for 30 min. Following this, samples were centrifuged for 10 min at 12 000 g , the supernatant was collected from each tube and centrifuged for an additional 5 min at 12 000 g . The supernatants were then collected and diluted 50 (drones) and 20 (workers) fold in a re-suspension buffer (100 mm Tris: pH 7·6). The total protein content of drones and workers was determined using the Bradford method and the absorbance of samples and standards (Bovine serum albumin protein standard, Sigma-Aldrich) was measured at 595 nm using a plate reader (Biotek Eon; Analytical and Diagnostic Products, Johannesburg, South Africa) (Bradford, Reference Bradford1976). The weight, water, lipid and protein content of newly emerged drones and workers (uninfested or infested with foundress mites) were compared between the following conditions: (1) drones/workers not parasitized by Varroa mites; (2) drones/workers parasitized by 1 foundress; (3) drones/workers parasitized by 2–3 foundresses; and (4) drones/workers parasitized by ⩾4 foundresses. We chose these categories to allow for a comparison with previous studies. In addition, the relationship of these physiological parameters to the number of foundresses and their offspring was investigated. Cells in which dead foundresses were found were included in our analyses under the assumption that they had fed for an undetermined time before death and therefore had an effect on the physiology of the host.
Assessment of Varroa mite reproduction in drone and worker brood
To quantify Varroa mite reproduction, the number of foundresses, mature daughter mites, immature daughter mites and males were counted in each infested cell. The following parameters were recorded: infertility (live and dead foundresses with no offspring), fertility (production of offspring), fecundity (number of offspring produced), number of mature daughters and presence (alive and dead) or absence of adult males (Dietemann et al. Reference Dietemann, Nazzi, Martin, Anderson, Locke, Delaplane, Wauquiez, Tannahill, Frey, Ziegelmann, Rosenkranz, Ellis, Dietemann, Ellis and Neumann2013). Foundresses were distinguished from mature daughters by their darker colouration (Dietemann et al. Reference Dietemann, Nazzi, Martin, Anderson, Locke, Delaplane, Wauquiez, Tannahill, Frey, Ziegelmann, Rosenkranz, Ellis, Dietemann, Ellis and Neumann2013), which can be a reliable distinction in some African honeybee sub-species due to the short post-capping time (Moritz, Reference Moritz1985). Cells containing one foundress were considered in determining Varroa reproductive success. Reproductive success was defined by the simultaneous presence of one live mature daughter and one live adult male in a cell (Locke et al. Reference Locke, Le Conte, Crauser and Fries2012). Multiply infested cells that contained one or more, but not only dead foundresses, were pooled with cells where all foundresses were alive. In multiply infested cells, foundresses with no offspring were considered to be infertile.
Statistical analysis
Statistical analysis was performed using STATISTICA 64 Version 12. To examine whether the extent of the physiological effects measured correlated with the number of foundress mites as well as the total number of mites (foundresses and their offspring), a Pearson or Spearman Rank Order correlation (depending on whether the data were normally distributed or not) was performed. A Kruskal–Wallis analysis of variance (ANOVA) with multiple comparisons of mean ranks for all groups was done to examine differences in each of the physiological parameters between individuals parasitized by 0, 1, 2–3 and 4 or more foundresses. A Mann–Whitney U test was performed to test for differences in the number of mature daughters and total number of offspring produced in drone vs worker cells. To examine the differences in the number of mite offspring and mated daughters produced per cell and per foundress in drone and worker cells, a Kruskal–Wallis ANOVA with multiple comparisons of mean ranks for all groups was performed.
RESULTS
Effect of Varroa mite infestation on the physiological parameters of honeybees
Drones
Significant differences (weight decreased with an increase in mite number) were found between the weight of drones infested with 0 and 1 (H 3,452 = 48·73, P < 0·05), 0 and 2–3 (H 3,452 = 48·73, P < 0·001) and 0 and ⩾4 (H 3,452 = 48·73, P < 0·001) foundresses (Fig. 1). Similarly, the water content of drones was significantly different between individuals infested with 0 and 1 (H 3,452 = 62·21, P < 0·05), 0 and 2–3 (H 3,452 = 62·21, P < 0·001) and 0 and ⩾4 (H 3,452 = 62·21, P < 0·001) foundresses. No significant differences were found in drone lipid (H 3,84 = 0·73, P > 0·87) and protein (H 3,85 = 3·10, P > 0·38) content when each of the groups were compared.
Physiological parameters (mean ± s.d.) of Apis mellifera scutellata drones and workers affected by foundress (Varroa destructor) mites. I: Weight (mg); II: Water content (mg); III: Lipid content (mg); IV: Protein content (mg mL−1). Significant differences (Kruskal–Wallis ANOVA; P < 0·05, with multiple comparisons of mean ranks for all groups) of physiological parameters for each of the Varroa groups are denoted by different letters. No letters indicate no significant differences.

There was a significant, but weak negative correlation in drone weight (n = 452, r = −0·33, P < 0·05) and water content (n = 452, r = −0·37, P < 0·05) with an increase in the number of foundresses. There was no correlation between the lipid (n = 83, r = 0·02, P > 0·05) or protein (n = 85, r = −0·11, P > 0·30) content of drones and the number of foundresses.
When considering the total number of infesting mites, including foundresses and offspring, the correlation with weight (n = 452, r = −0·33, P < 0·0001) and water content (n = 452, r = −0·37, P < 0·0001) of drones was also significant and weakly negative. For each additional mite, a weight loss of 2·8 mg (1·2% of the weight of an uninfested drone) was estimated from the correlation equation. There was no correlation between the total number of mites and the lipid (n = 84, r = 0·01, P > 0·95) and protein (n = 85, r = −0·12, P > 0·27) content of drones.
Workers
The weight of workers was significantly different (weight decreased as mite number increased) between cells infested with 0 and 1 (H 2,1500 = 199·50, P < 0·001), as well as 0 and 2–3 (H 2,1500 = 199·50, P < 0·001) foundresses (Fig. 1). Significant differences were also found in the water content of workers infested with 0 and 1 (H 2,1500 = 215·86, P < 0·001), as well as 0 and 2–3 (H 2,1500 = 215·86, P < 0·001) foundresses. The lipid (H 2,88 = 3·74, P > 0·15) and protein (H 2,88 = 4·70, P > 0·10) content of workers was not significantly different between the various groups.
The weight (n = 1500, r = −0·36, P < 0·05) and water content (n = 1500, r = −0·38, P < 0·05) of workers were significantly but weakly negatively correlated with an increase in the number of foundresses. This was not the case for lipid (n = 88, r = 0·08, P > 0·44) or protein content (n = 88, r = −0·21, P > 0·05).
The weight (n = 1500, r = −0·36, P < 0·05), water (n = 1500, r = −0·38, P < 0·05) and protein (n = 88, r = −0·24, P < 0·05) content of workers decreased significantly, but weakly, as the total number of mites (foundresses and their offspring) increased. For each additional mite, a weight loss of 2·8 mg (3·3% of the weight of an uninfested worker) could be estimated from the regression equation. No correlation was found between the total number of mites and the lipid (n = 88, r = 0·05, P > 0·62) content of workers.
Assessment of Varroa mite reproduction in drone and worker brood
Varroa infestation rates
In total for drones, 452 cells were opened of which 335 cells (74·1%) were not infested, 42 cells (9·3%) were infested with one foundress, 27 cells (6·0%) were infested with 2–3 foundresses and 48 cells (10·6%) were infested with ⩾4 foundresses. Therefore, based on a 25·9% overall infestation rate of the cells, one can calculate the probability of a mite being found in a cell by solving the 4th-order equation [(1) 0·257 = p d + p d 2 + p d 3 + p d 4] focusing on up to 4 mites per cell for simplicity sake. With p d being the probability that a mite enters a drone cell. The only positive real solution of equation (1) is p d = 0·206, which means that one would expect that 5·2% (=0·2062 + 0·2063) of the cells have 2–3 mites by chance but only 0·2% (=0·2064) of the cells should have 4 or more mites which is lower than the observed infestation rate of 10·6%.
In total, 1500 worker cells were opened, of which 1386 (92·4%) were not infested, 84 (5·6%) were infested with one foundress and 30 cells (2·0%) were infested with 2–3 foundresses. No worker cells were infested with ⩾4 foundresses. Since no worker cells with 4 or more mites were observed, one would have to solve the following 3rd-order equation: [(1) 0·076 = p w + p w 2 + p w 3] with p w being the probability that a mite enters a worker cell. The only positive real solution of equation (2) is p w = 0·0706; therefore, the expected frequency of cells with 2–3 mites should be 0·5% which is 4 times lower than the observed value of 2%. The differences between the expected and observed values show that the distribution of the mites is not random but clumped.
Reproduction in singly infested cells
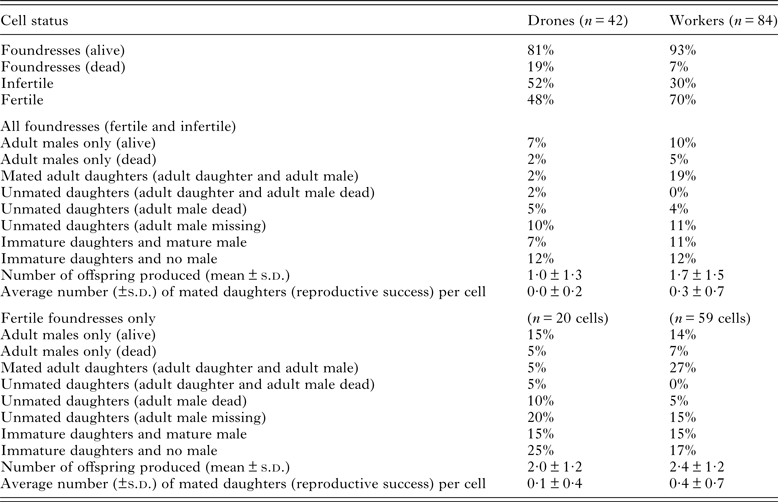
In drones, a single foundress was found in 42 of the 452 cells (9%) examined. In 8 of the 42 (19%) singly infested cells the foundress died. In 7 of these cells there was no reproduction and therefore these foundresses were considered to be infertile. In the remaining cell, there was reproduction and this foundress was regarded as fertile (Table 1). Varroa mites produced at least one offspring in 20 out of the 42 cells (47%) and thus 20 cells were used to assess reproductive success (Table 1).
Reproduction of Varroa destructor in Apis mellifera scutellata drone and worker cells infested with one foundress

Of the 1500 worker cells examined, 84 (5·6%) were infested with one foundress. Dead foundresses were observed in 6 out of the 84 cells (7%). No reproduction occurred in these cells and as a result these foundresses were classified as infertile (Table 1). Varroa mites reproduced in 59 out of the 84 cells (70%) and therefore 59 cells were used to measure reproductive success (Table 1).
Reproduction in cells containing 2–3 foundresses
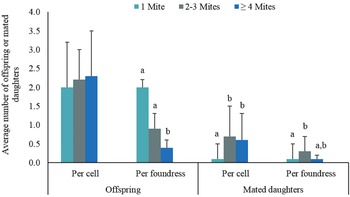
In 5 out of 27 (19%) drone cells infested with 2–3 live foundresses there was no reproduction. In total (considering all cells with foundresses where reproduction occurred) 49 offspring were found with 2·2 ± 0·8 offspring produced per cell (Fig. 2).
The number of offspring and mated daughters (mean ± s.d.) produced per cell and per foundress in drone brood parasitized by 1, 2–3 or ⩾ 4 foundresses (only fertile foundresses were considered). Significant differences (Kruskal–Wallis ANOVA; P < 0·05, with multiple comparisons of mean ranks for all groups) are denoted by different letters for each category. No letters indicate no significant effects for each category.

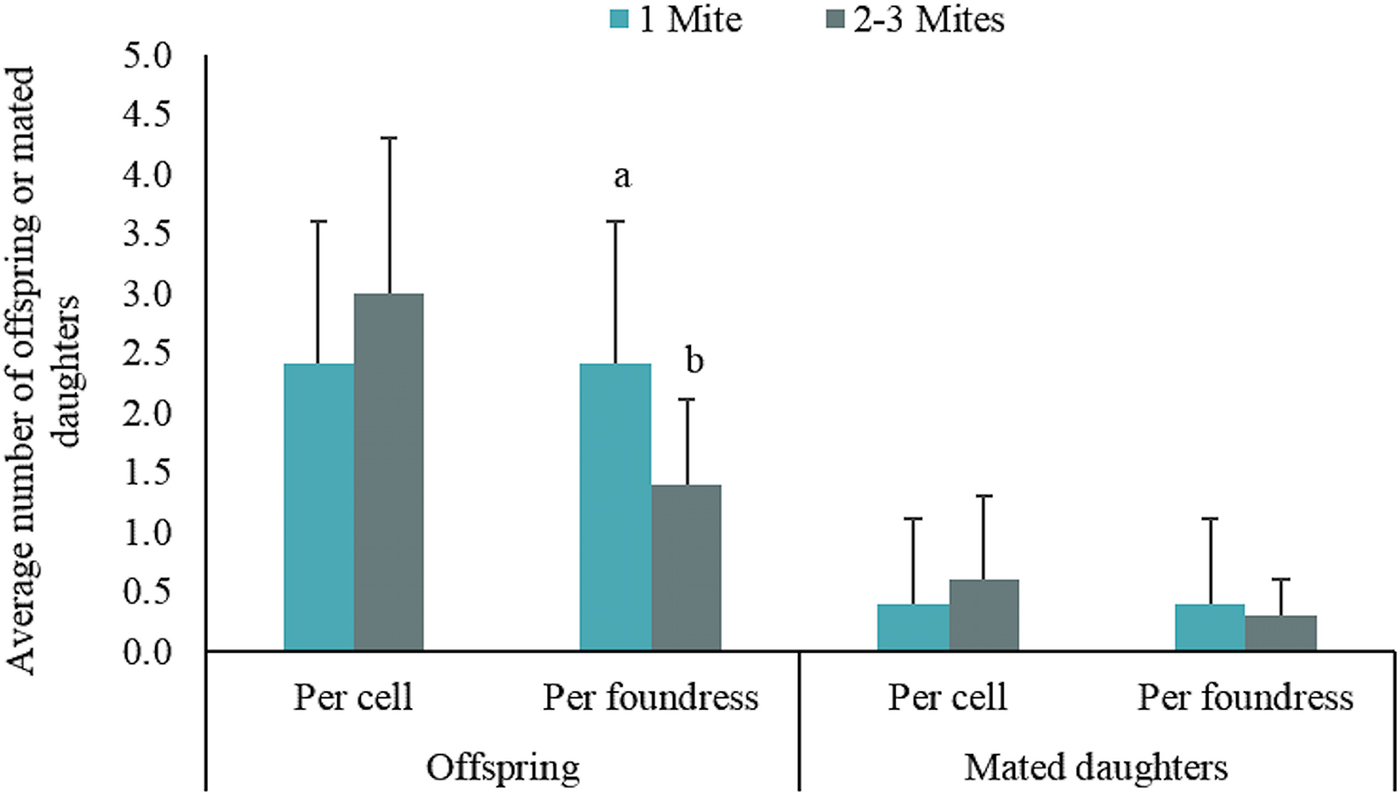
In worker cells, Varroa mite reproduction occurred in all 30 cells infested with 2–3 foundresses. A total (considering all cells with foundresses where reproduction occurred) of 90 offspring were produced, with 3·0 ± 1·3 offspring produced per cell (Fig. 3).
The number of offspring and mated daughters (mean ± s.d.) produced per cell and per foundress in worker brood parasitized by 1 or 2–3 foundresses (only fertile foundresses were considered). Significant differences (Kruskal–Wallis ANOVA; P < 0·05, with multiple comparisons of mean ranks for all groups) are denoted by different letters for each category. No letters indicate no significant effects for each category.

Reproduction in cells containing ⩾4 foundresses
The highest number of foundresses found in one drone cell was 12, and on average 5·8 ± 2·2 foundresses were found per cell infested by 4 or more mites. In 7 out of 48 cells (15%) there was no mite reproduction. In total (considering all cells with foundresses where reproduction occurred), 94 offspring were found in 41 cells and on average 2·3 ± 1·2 offspring were produced per cell (Fig. 2).
Reproductive output per cell and per foundress in singly vs multiply infested cells
A significantly higher number of offspring per foundress was produced in drone cells infested with 1 foundress compared to ⩾4 foundresses (H 2,83 = 50·23, P < 0·001) as well as in cells with 2–3 foundresses compared with ⩾4 foundresses (H 2,83 = 50·23, P < 0·001; Fig. 2). The number of mated daughters produced increased significantly (H 2,83 = 11·06, P < 0·05) per drone cell as the number of foundresses increased.
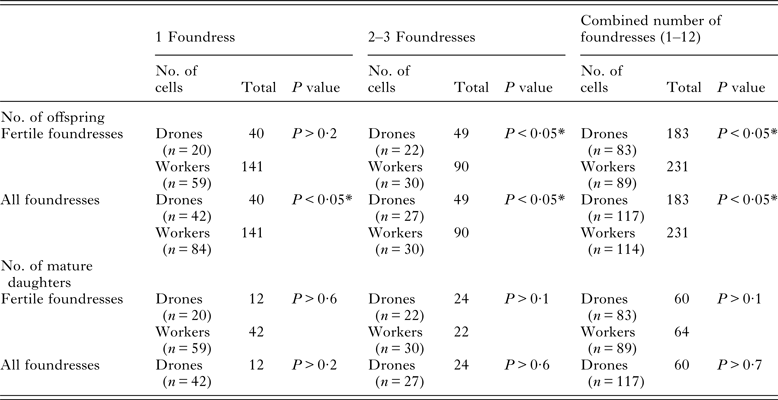
In worker cells, a significantly (H 1,89 = 10·89, P < 0·01) higher number of offspring were produced per foundress in singly infested cells (Fig. 3). In terms of the number of offspring produced per cell, no significant differences were observed between singly and multiply infested worker brood (H 1,89 = 0·46, P > 0·50). The same was true for the number of mated daughters produced per cell (H 1,89 = 3·40, P > 0·07) and per mite (H 1,89 = 3·40, P > 0·07). A comparison of the total number of offspring and daughter mites produced in drone vs worker cells is presented in Table 2.
A comparison of the total number of offspring and total number of mature daughter mites (all daughters irrespective of whether male was absent/present) produced in drone and worker cells infested with 1, 2–3 foundresses and a combined number of foundresses (1–12). Data are presented for fertile foundresses as well as all foundresses (fertile and infertile)

*Significant differences: Mann–Whitney U test, P < 0·05.
Presence of deformed drones and workers
The percentage of deformed drones infested with 0, 1, 2–3 and ⩾4 foundresses was 0, 7·1, 7·4 and 6·3%, respectively. The percentage of deformed workers infested with 0, 1 and 2–3 foundresses, was 0·3, 2·4 and 13·3%, respectively.
DISCUSSION
We provide the first report on the physiological costs of Varroa mite parasitism in an African honeybee sub-species, A. m. scutellata. The weight and water content of drones and workers of this population decreased significantly as the number of foundresses and the total number of mites (foundresses and their offspring) increased. Drone and worker lipid content was not affected by Varroa mites. The protein level of workers was significantly reduced, but only as the total number of mites increased. Mite infertility was 52 and 30% in drone and worker cells, respectively.
Number of deformed honeybees
Honeybees with wing deformities usually die shortly after emergence (Yang and Cox-Foster, Reference Yang and Cox-Foster2007) and therefore the health of the colony may be negatively affected if a large number of deformed honeybees emerge that cannot contribute to the normal functioning of the colony (de Miranda and Genersch, Reference de Miranda and Genersch2010). In this study, only 7% of drones and 8% of workers were deformed when infested with one or more mites. We observed the highest percentage of physical deformity (no wings or deformed wings) in drones (7·4%) and workers (13·3%) infested with 2–3 foundresses. In Africanized honeybees, De Jong et al. (Reference De Jong, De Jong and Gonçalves1982) showed that only 6% of workers with mites were deformed, which is consistent with our results. In contrast, Marcangeli et al. (Reference Marcangeli, Monetti and Fernandez1992) found that 29% of European worker honeybees with one or more mites were deformed. Wing deformity is most often noticed in honeybees parasitized by Varroa mites that are capable of transmitting deformed wing virus (DWV) during pupal development (Gisder et al. Reference Gisder, Aumeier and Genersch2009; de Miranda and Genersch, Reference de Miranda and Genersch2010). DWV has to replicate in the mite transmitting the virus with a high-enough titre to produce honeybees with deformed wings (Gisder et al. Reference Gisder, Aumeier and Genersch2009). However, DWV was shown to be absent from the population studied here and hence cannot be implicated in producing these deformities. It has recently been suggested that VDV-1, which was found in both honeybees and Varroa mites of our study population (Strauss et al. Reference Strauss, Human, Gauthier, Crewe, Dietemann and Pirk2013) could also produce deformed wings (Zioni et al. Reference Zioni, Soroker and Chejanovsky2011). The role of Varroa mites and their associated viruses in wing deformity in this A. m. scutellata population therefore needs to be investigated further.
Effect of Varroa parasitism on the physiological parameters of drones and workers
Lipid levels measured in this study were slightly higher than was previously found for A. m. scutellata workers and other sub-species at emergence (Hrassnigg and Crailsheim, Reference Hrassnigg and Crailsheim2005 and references therein) most likely due to inter-population variation. Lipid levels of drones and workers were unaffected by Varroa mite parasitism and this is in agreement with what Bowen-Walker and Gunn (Reference Bowen-Walker and Gunn2001) found for newly emerged European workers. Significant differences between infested and uninfested individuals may have been too small to detect due to the low lipid levels at emergence as well as due to methodological constraints (Bowen-Walker and Gunn, Reference Bowen-Walker and Gunn2001). The absence of differences in lipid contents between a susceptible honeybee population and A. m. scutellata does not allow a conclusion regarding the occurrence of tolerance in the latter.
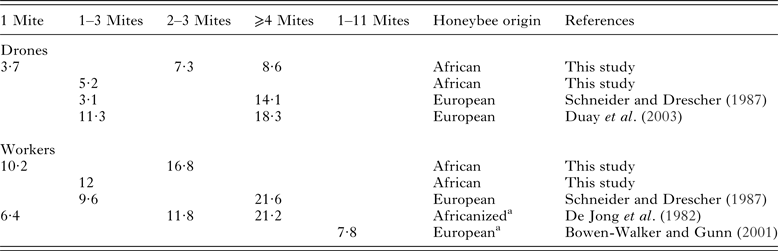
In this and other studies, the weight of drones and workers decreased as the number of foundresses as well as the total number of mites increased (De Jong et al. Reference De Jong, De Jong and Gonçalves1982; Schneider and Drescher, Reference Schneider and Drescher1987; Bowen-Walker and Gunn, Reference Bowen-Walker and Gunn2001; Duay et al. Reference Duay, De Jong and Engels2003; Annoscia et al. Reference Annoscia, Del Piccolo and Nazzi2012). A comparison between the degree of weight reduction between mite-infested and uninfested individuals of surviving and susceptible honeybee populations is given in Table 3. Our results suggest a generally lower effect of mite parasitism on the weight of drones compared with these reported in the literature for susceptible honeybees. This is unexpected since African drones are smaller than their European counterparts and should thus suffer proportionally greater haemolymph loss (Bowen-Walker and Gunn, Reference Bowen-Walker and Gunn2001) than larger individuals. A lower effect due to infestation by 1–3 mites described by Schneider and Drescher (Reference Schneider and Drescher1987) constitutes an exception to this trend and suggests that there is no consistent evidence for higher tolerance in A. m. scutellata. Similarly, the effect of parasitism on the weight of newly emerged workers in our study tended to be higher than that of susceptible European as well as surviving Africanized honeybees. Compared with European workers, African workers are smaller (Fletcher, Reference Fletcher1978) and are expected to have suffered proportionally larger weight loss. The difference, however, was small with a loss of 3·3% body weight per mite in our study compared with approximately 3% reported by Bowen-Walker and Gunn (Reference Bowen-Walker and Gunn2001). A comparison of the data on worker weight loss, calculated from the slopes of a regression line obtained from Table 3 (data not shown), gave varying results. Compared with Schneider and Drescher (Reference Schneider and Drescher1987), A. m. scutellata can either be more or less tolerant due to insufficient details in the results, and seems more tolerant to infestations by Varroa mites in De Jong et al. (Reference De Jong, De Jong and Gonçalves1982).
Weight loss (%) of mite-infested drones and workers compared with uninfested individuals in this study, as well as in the literature

a Number of foundresses was considered except in these two studies where foundresses and deutonymphs were pooled. However, our data show that individual offspring accounts for a maximum of 2% of the decrease in weight due to infestation, allowing for a meaningful comparison of these figures.
It has been suggested that the weight loss experienced by Varroa-infested honeybees results from the loss of water due to the damage caused to the honeybee cuticle during mite feeding (Annoscia et al. Reference Annoscia, Del Piccolo and Nazzi2012), and the depletion of haemolymph (Bowen-Walker and Gunn, Reference Bowen-Walker and Gunn2001). In our study as well as in Bowen-Walker and Gunn (Reference Bowen-Walker and Gunn2001) and Annoscia et al. (Reference Annoscia, Del Piccolo and Nazzi2012), the water content of workers and drones decreased as the number of foundresses and total number of mites present increased. However, workers of A. m. scutellata lost a higher percentage of their body water ranging from 11·8% (one foundress present) to 18·8% for individual workers infested with 2–3 foundresses. A comparison of the data on the loss in the water content of workers, calculated from the slopes of a regression line (data not shown), showed that A. m. scutellata appears less tolerant than a susceptible population (Bowen-Walker and Gunn, Reference Bowen-Walker and Gunn2001). For drones, we observed water loss of 4·8% in singly infested individuals and this number increased to 9·6% for multiply infested individuals. These results suggest that workers of A. m. scutellata are more affected by Varroa mite infestation than those of susceptible populations and therefore that no tolerance mechanism evolved to reduce the detrimental effects of mite feeding. There is limited information on the loss in water content of mite-infested drones, and thus whether this A. m. scutellata drone population is tolerant or not requires further investigation.
A reduction in the total protein content of mite-infested workers has been observed in purple eye pupae (Aronstein et al. Reference Aronstein, Saldivar, Vega, Westmiller and Douglas2012) and newly emerged honeybees (Yang and Cox-Foster, Reference Yang and Cox-Foster2007). Other studies however, did not find any differences in the total protein content of mite-infested vs uninfested drone pre-pupae (Żółtowska et al. Reference Żółtowska, Lipiński and Dmitryjuk2005) and newly emerged workers (Aronstein et al. Reference Aronstein, Saldivar, Vega, Westmiller and Douglas2012). Similarly, in our study, the protein levels of drones were not influenced by the feeding activities of foundress mites or the total number of mites (foundresses and their offspring). In workers, protein levels were significantly reduced as the total number of mites in a cell increased, but not when only the number of foundresses was considered. Similar to the other physiological parameters measured, we do not find clear evidence for tolerance when the effect of parasitism on protein content of A. m. scutellata is considered.
Losses suffered during pupal development as a result of Varroa mite parasitism can affect some aspects of adult honeybee life. Varroa mites reduced the lifespan and flight ability of European worker honeybees (Schneider and Drescher, Reference Schneider and Drescher1987; Kralj and Fuchs, Reference Kralj and Fuchs2006; Annoscia et al. Reference Annoscia, Del Piccolo and Nazzi2012), while Varroa-infested drones were found to produce less sperm and did not perform as well during flight (Duay et al. Reference Duay, De Jong and Engels2002). Alaux et al. (Reference Alaux, Dantec, Parrinello and Le Conte2011) and van Dooremalen et al. (Reference van Dooremalen, Stam, Gerritsen, Cornelissen, van der Steen, van Langevelde and Blacquière2013) found that individuals that had been parasitized by Varroa mites and given pollen as adults were unable to compensate for the damage inflicted by mites during their pupal development, thus likely affecting their performance. Here we studied the physiological cost of parasitism to immature honeybees, but whether adults show a tolerance to infestations that could decrease the effect of parasitism by V. destructor requires further studies.
Mite reproduction in singly infested cells
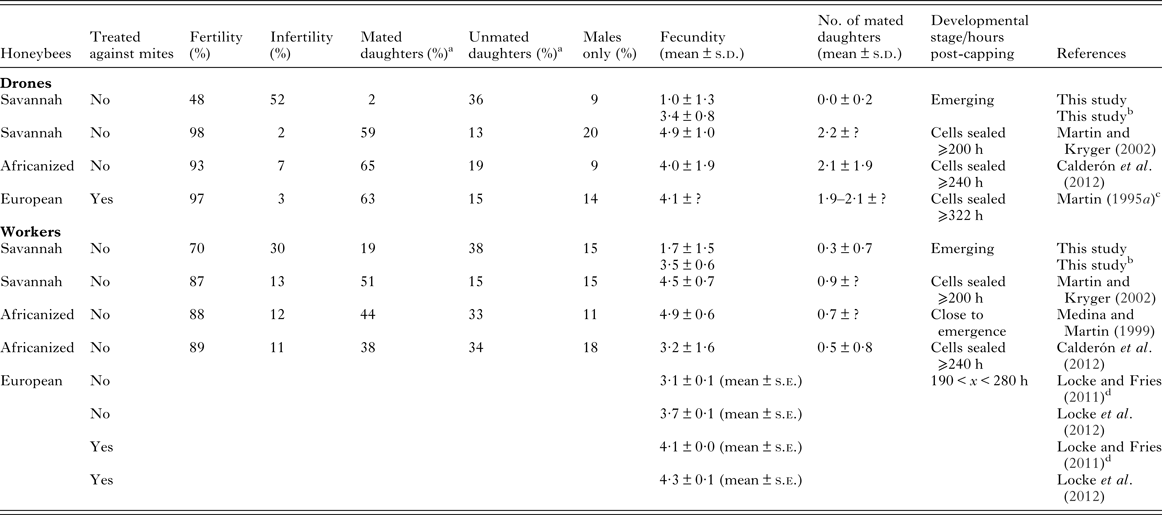
Infertility or low reproductive success of the parasite could indicate host resistance (Rosenkranz and Engels, Reference Rosenkranz and Engels1994; Rosenkranz, Reference Rosenkranz1999; Locke and Fries, Reference Locke and Fries2011; Locke et al. Reference Locke, Le Conte, Crauser and Fries2012). The proximate mechanism leading to low population growth can be the frequent occurrence of unmated daughter mites that enter brood cells even though they cannot reproduce (Martin et al. Reference Martin, Holland and Murray1997). Alternatively, many female mites that mated also fail to reproduce (Martin et al. Reference Martin, Holland and Murray1997; Kirrane et al. Reference Kirrane, de Guzman, Rinderer, Frake, Wagnitz and Whelan2011; Frey et al. Reference Frey, Odemer, Blum and Rosenkranz2013), thereby adding to the proportion of infertile individuals. We found infertile mites in 52% of drone and 30% of worker brood (Table 1). In the same population of savannah honeybees investigated a decade earlier, Martin and Kryger (Reference Martin and Kryger2002) found no offspring in 13% of worker cells and only in 2% of drone cells. Our results therefore suggest that the rate of Varroa mite reproductive failure has increased over time. Infertility rates are also higher than those reported for Varroa tolerant Cape honeybees, on which mites remained infertile in 26% of both worker and drone cells (Allsopp, Reference Allsopp2006). This could reflect the effect of selection on savannah honeybee colonies that has resulted in a reduction of mite population growth. The infertility levels measured in this study were much higher compared with surviving and susceptible honeybee populations mentioned in Table 4. Our high infertility rates are not unusual, since infertility rates as high as 40–65% (Ritter, Reference Ritter, Connor, Rinderer, Sylvester and Wongsiri1993) and 60–90% (Ruttner and Marx, Reference Ruttner and Marx1984) have been reported in other surviving African and Africanized honeybees, respectively. In our study, the high level of mite infertility indicates a strong suppression of mite reproduction and hence high host resistance.
A comparison of reproductive parameters between savannah (Apis mellifera scutellata), Africanized and European honeybees in drone and worker cells naturally infested with one foundress. All singly infested cells were considered (fertile and infertile foundresses)

Methodology can differ between the studies cited. The number of offspring observed may be slightly overestimated compared with our results since mortality could have occurred, had the honeybee been allowed to emerge. For the other parameters measured, cells were opened late enough for valid comparisons to be made. ’?’ indicates that values are not available.
a Live mature daughters are assumed to have mated when a live adult male was present in the cell. Daughters are assumed unmated when immature, dead or when the male was dead/missing.
b Fecundity calculated in cells containing 3 or more offspring, to allow for a better comparison with Martin and Kryger (Reference Martin and Kryger2002).
c Values as re-calculated by Martin and Kryger (Reference Martin and Kryger2002).
d Only fertile foundresses were included in the fecundity assessment.
In A. m. scutellata, single fertile foundresses invading drone and worker cells produced 2·0 ± 1·2 and 2·4 ± 1·2 offspring, respectively. When considering all foundresses (including those that did not produce offspring at all), fecundity decreased to 1·0 ± 1·3 (drones) and 1·7 ± 1·5 (workers) offspring being produced per mite. This is much lower than in other surviving or susceptible populations for which fecundity, irrespective of host sex, is described (Table 4). However, similar and even lower fecundity rates have also been reported in surviving Africanized honeybees from Brazil (1·7 ± 0·5) during the late 1980s (Carneiro et al. Reference Carneiro, Torres, Strapazzon, Ramirez, Guerra, Koling and Moretto2007). They found that, after 20 years, this number increased to 2·6 ± 0·6, thereby showing that this parameter can change over time. Fecundity rates in our study are also lower than previously reported for this population (Martin and Kryger, Reference Martin and Kryger2002). The low fecundity of mites measured in this study may be the cause of the slow rate at which mite populations grow in these colonies (Strauss et al. Reference Strauss, Pirk, Crewe, Human and Dietemann2015).
Fecundity does not necessarily reflect reproductive success of a foundress. For fertile individuals to reproduce successfully during a reproductive cycle, they have to contribute at least one mature mated daughter to the mite population (Martin, Reference Martin1994, Reference Martin1995a ). In this study, reproductive success was observed in 2 and 19% of infested drone and workers cells, respectively. In comparison with other studies (Table 4) this parameter confirms high resistance of A. m. scutellata to infestation by V. destructor. According to Rosenkranz et al. (Reference Rosenkranz, Aumeier and Ziegelmann2010) there are several factors that can explain the absence of mated daughters; foundresses may die early without producing offspring, they may produce only a male or only females, or may have started egg laying too late to produce mature daughters at the time of emergence The percentage of A. m. scutellata cells in which only male offspring was produced (9% drones and 15% workers) was similar to those reported by Martin and Kryger (Reference Martin and Kryger2002) and to other honeybee populations studied to date (Table 4). This trait is therefore not likely to be involved in resistance to the mite. In cells with mature daughters, a higher percentage of adult males were either dead or missing in both drone (17%) and worker (15%) cells (Table 1) compared with the results of Martin and Kryger (Reference Martin and Kryger2002) (9 and 11%, respectively) in the same population. In surviving Africanized honeybees, adult males died in 13–19% of cells containing close to emergence workers (Medina and Martin, Reference Medina and Martin1999). Our data show that the percentage of dead males increased in both drone and worker brood compared with measurements of Martin and Kryger (Reference Martin and Kryger2002) and are similar to those found in surviving populations of Africanized workers (Medina and Martin, Reference Medina and Martin1999). However, European susceptible honeybees also show high proportions of infested cells with no or dead males (mortality rates of 10% in drone brood and 13–21% in worker brood; Martin, Reference Martin1994, Reference Martin1995a , Reference Martin2001) and this trait does not appear to be sufficient to decrease mite population growth to levels that result in host colony survival. Reasons for the absence of males have been attributed to males either being killed by the pupae during development, or as a result of not being able to find the feeding site made by the foundress (Donzé et al. Reference Donzé, Herrmann, Bachofen and Guerin1996). Nonetheless, Varroa mite reproductive success is variable since it can be influenced by many factors (e.g. climatic conditions, season or sub-species of the host; Rosenkranz et al. Reference Rosenkranz, Aumeier and Ziegelmann2010), and the reproductive values obtained here need to be verified in other savannah honeybee populations. Long-term monitoring of Varroa mite reproduction under South African conditions is also necessary to better understand the interaction between mites, environmental factors and host colony health.
Another factor to consider is the importance of host signals used by Varroa mites for oogenesis activation (Garrido and Rosenkranz, Reference Garrido and Rosenkranz2004). It is possible that larval signals of certain honeybee populations prevent (Milani et al. Reference Milani, Della Vedova and Nazzi2004) or delay the initiation of the reproductive cycle of the mites, therefore resulting in a decrease in reproductive success (Locke et al. Reference Locke, Le Conte, Crauser and Fries2012). The family composition observed in our population of A. m. scutellata corresponded with possible reproductive delay in only approximately one-third of the cases (data not shown). In the other cases, the composition was more likely due to an interruption or disturbance of the normal reproductive programme of the mites as described by Martin (Reference Martin1994, Reference Martin1995a ). The hygienic behaviour of host workers may also lead to an increase in the proportion of infertile mites via the disruption of Varroa mite reproduction and/or the specific removal of fertile mites (Harbo and Harris, Reference Harbo and Harris2005; Allsopp, Reference Allsopp2006; Harris et al. Reference Harris, Danka and Villa2010; Kirrane et al. Reference Kirrane, de Guzman, Rinderer, Frake, Wagnitz and Whelan2011). The intensity of hygienic behaviour and the role this behaviour may play in colony survival of the savannah honeybee in South Africa is currently being investigated (Strauss et al., unpublished data).
Varroa reproduction in multiply infested drone and worker cells
The monitoring of reproduction in naturally infested brood allowed us to investigate mite reproduction in cases in which several foundresses invaded the same cell. In this situation, there is more competition for resources and as a result the reproductive success of individual foundresses is usually lower compared with that of singly infested cells (Fuchs and Langenbach, Reference Fuchs and Langenbach1989; Eguaras et al. Reference Eguaras, Marcangeli and Fernandez1994; Martin, Reference Martin1995b ; Mondragón et al. Reference Mondragón, Martin and Vandame2006; Kuster et al. Reference Kuster, Boncristiani and Rueppell2014). In this study, we also observed a significant decrease in the number of offspring produced per individual foundress between drone cells infested with 1 and 4 or more foundresses, as well as between worker cells infested with 1 and 2–3 foundresses. The differences were significant for drones, but not for workers, which may be related to the low number of multiple infestations observed in the latter. The reproductive success (number of mated daughters produced) in drone cells per foundress was higher in cells containing 1 foundress than in cells infested with 2–3 foundresses. However, if we consider the number of mated daughters that emerge from multiply infested drone cells, the output is significantly higher compared with singly infested cells. In singly infested cells there was a high incidence of missing adult males, and as a result daughters could not mate. In contrast, in multiply infested cells where more than one adult male can be produced, daughter mites have a better chance of mating if one or more males remain alive (Martin, Reference Martin1995b ). Indeed, the observed clumped distribution of mites in drone and worker cells could be a mechanism for these mites to deal with the founder effects (Abel et al. Reference Abel, Abel zur Wiesch, Davis and Waldor2015) of the relatively new established mite population. Nevertheless, the quantity of sperm a male is able to transfer to one or more daughter mites can be a limiting factor, so even if there are more adult daughters in multiply infested cells, there is a chance that not all of them will get sufficient spermatozoa to ensure reproductive success in the next cycle (Donzé et al. Reference Donzé, Herrmann, Bachofen and Guerin1996; Wendling et al. Reference Wendling, Guillet, Roy, Kreiter and Colin2014).
Mite preference for drone brood
Varroa mite preference for drone brood has been reported in all honeybee populations studied (Fuchs, Reference Fuchs1990; Boot et al. Reference Boot, Schoenmaker, Calis and Beetsma1995a ). This is associated with the fact that the period of maturation of drone brood is longer than that of workers, providing more time for mite reproduction and therefore a higher reproductive success (Boot et al. Reference Boot, van Baalen and Sabelis1995b ; Martin, Reference Martin1995a ; Tribe and Allsopp, Reference Tribe, Allsopp and Johannsmeier2001). In our study, infestation rates of drone brood were three times that of worker brood, confirming the preference for drones. Despite the longer time available for mites to reproduce on drone brood, the reproductive success of drone infesting mites was one-third of that for mites infesting workers. This was linked to higher infertility in singly infested drone cells (52%) compared with worker cells (30%). This is in contrast to what has been observed in most other studies that show that infertility in worker brood is similar or higher than in drone brood (Martin et al. Reference Martin, Holland and Murray1997 and references therein; Garrido et al. Reference Garrido, Rosenkranz, Paxton and Gonçalves2003; Calderón et al. Reference Calderón, Ureña and van Veen2012). The reasons for this lower reproductive success on drones are not known, but may be related to the high frequency of missing or dead males and immature females. The level of preference measured in A. m. scutellata appears lower compared with that of other honeybee populations where the ratio between the sexes’ infestation rates ranges from 5 to 12 (Fries et al. Reference Fries, Camazine and Sneyd1994 and references therein; Boot et al. Reference Boot, Schoenmaker, Calis and Beetsma1995a ). The lower preference could be related to the reduced reproductive success measured in our population. However, this ratio has remained the same in the last decade (Martin and Kryger, Reference Martin and Kryger2002). Thus, the decrease in mite reproductive success did not result in a decrease in preference for drone brood. Such a relationship may become established over longer evolutionary periods. At present, this phenomenon may constitute a mite trapping mechanism by which the parasites are attracted to individual hosts on which their reproductive success is lower. Such a mechanism could contribute to a decrease in colony infestation rates and an increase in resistance to the parasite.
Resistance rather than tolerance of savannah honeybees towards V. destructor
The A. m. scutellata population studied here shows no conclusive evidence of tolerance towards the effects of infestation by V. destructor. Further studies using more precise and standardized methods are needed to allow for more accurate comparisons between susceptible and surviving populations. In contrast, clear evidence for resistance was found in the low fertility, fecundity and reproductive success of Varroa mite foundresses. This low reproduction explains the slow rate at which mite populations grow in savannah honeybee colonies and may constitute the major adaptation allowing for colony survival. The absence of acaricide use in savannah honeybee colonies may have facilitated the development of this resistance by allowing natural selection to take place (Rosenkranz, Reference Rosenkranz1999). What we may be witnessing is the establishment of a stable host–parasite relationship where the reduced negative effects of mite infestation result in a level of damage that can be tolerated at the colony level. This is supported by the fact that since the last assessment of Varroa mite reproduction in the savannah honeybee, infertility rates measured in this study have increased and fecundity rates as well as reproductive success decreased (Martin and Kryger, Reference Martin and Kryger2002). Similar observations of tolerance or resistance development over time in the absence of treatment have been observed in other honeybee populations invaded by Varroa mites (De Jong and Soares, Reference De Jong and Soares1997; Kefuss et al. Reference Kefuss, Vanpouke, De Lahitte and Ritter2004; Fries et al. Reference Fries, Imdorf and Rosenkranz2006; Le Conte et al. Reference Le Conte, de Vaublanc, Crauser, Jeanne, Rousselle and Bécard2007; Seeley Reference Seeley2007; Locke and Fries, Reference Locke and Fries2011; Locke et al. Reference Locke, Le Conte, Crauser and Fries2012; Seeley et al. Reference Seeley, Tarpy, Griffin, Carcione and Delaney2015). These studies show a variety of mechanisms leading to colony survival and their identification provides us with an array of traits that can be selectively bred into susceptible honeybee populations to increase their survival to infestations by this most damaging parasite.
Nevertheless, a more detailed understanding is needed in order to identify all the possible behaviours of the savannah honeybee from South Africa (e.g. hygienic and grooming behaviour, swarming frequency) that may contribute to keeping mite numbers low and consequently reducing and/or preventing mite population growth above the damage threshold for the colony.
ACKNOWLEDGEMENTS
We thank Kendall Richardson for assistance in the field and laboratory. We are grateful to three reviewers for constructive comments on the manuscript.
FINANCIAL SUPPORT
The financial assistance of the National Research Foundation (NRF) and the University of Pretoria towards this research is hereby acknowledged. Agroscope is acknowledged for providing travel funds for VD. Opinions expressed and conclusions arrived at, are those of the authors and are not necessarily to be attributed to the NRF.