





1. Introduction
The unmanned aerial vehicle (UAV) and small micro air vehicle (MAV) industries are expected to grow at a compound annual growth rate of approximately 20.7 % yearly until  $2022$ (MRC Statistics 2016). Like UAVs and MAVs, micro-turbine and small scale cooling fans used in ventilation systems operate at low to moderate Reynolds numbers based on the tip chord and low tip Mach numbers. These lifting devices have become omnipresent in our society. Consequently, noise emitted by these devices and their impact on human health and comfort cannot be overlooked. Therefore, aerofoils operating in such Reynolds and Mach number regimes need to be optimised not only for lift and drag but also for noise. Among the various aerofoil self-noise mechanisms (see Brooks, Pope & Marcolini (Reference Brooks, Pope and Marcolini1989), for classifications of aerofoil self noise), aerofoil tonal noise can in particular be a cause of major annoyance. This is because tonal noise is several dB higher than the corresponding broadband noise (see Nash, Lowson & McAlpine (Reference Nash, Lowson and McAlpine1999), for instance). At low to moderate Reynolds numbers based on chord length
 $Re_c$ (from
 $5 \times 10^{4}$ to
 $6 \times 10^{5}$) an aerofoil has been shown to generate an intense whistling sound. Paterson et al. (Reference Paterson, Vogt, Fink and Munch1973) and Fink (Reference Fink1975) were probably the first to show that aerofoil tonal noise was caused by a nonlinear feedback mechanism in which the tonal frequency locked in over certain flow speeds, and jumped to a different frequency when the flow speed was increased. The resulting ladder-type structure of tonal noise frequencies with flow speed was later confirmed by many studies on different aerofoils (Arbey & Bataille Reference Arbey and Bataille1983; Kingan & Pearse Reference Kingan and Pearse2009; Chong & Joseph Reference Chong and Joseph2012; Pröbsting, Scarano & Morris Reference Pröbsting, Scarano and Morris2015; Padois et al. Reference Padois, Laffay, Idier and Moreau2016; Yakhina et al. Reference Yakhina, Roger, Moreau, Nguyen and Golubev2020) including the present controlled-diffusion (CD) aerofoil, as illustrated in figure 1(a). As shown by Padois et al. (Reference Padois, Laffay, Idier and Moreau2016), the frequency of the primary tone
 $f_S$ on the CD aerofoil follows Paterson's law (Paterson et al. Reference Paterson, Vogt, Fink and Munch1973), confirmed by Arbey & Bataille (Reference Arbey and Bataille1983) on several NACA 0012 and modified NACA 0012 (termed NACA 0012
 $^{\star }$) aerofoils
 \begin{equation} f_S = K U_\infty^{1.5}/\sqrt{C \nu},\end{equation}
but with a constant  $K ({\simeq }0.017)$ larger than for the NACA 0012 cases (
 ${\simeq }0.011$). Here,
 $C$ is the chord length,
 $U_\infty$ the free-stream velocity and
 $\nu$ is the fluid kinematic viscosity. The secondary tones
 $f_n$, evidence of a feedback loop, also follow a power law with velocity but with a shallower slope (Tam Reference Tam1974). Moreover, Padois et al. (Reference Padois, Laffay, Idier and Moreau2016) have also confirmed the nonlinear origin of tonal noise with wavelet and bicoherence spectral analyses on the CD aerofoil, and have also shown that several tonal noise regimes exist, particularly a regime with a single and strongly intermittent tone, which is the targeted flow condition of the present study. As illustrated in figure 1(b), the present flow condition marked by a star lies at the junction between a single steady tone and multiple tones on this aerofoil, and closely corresponds to the critical limit for tonal noise on the NACA 0012 aerofoil, which makes the present case appealing for detailed aero-acoustic analysis.
Tonal noise on the CD aerofoil: (a) evolution of the frequency of tones vs flow velocity, demonstrating the ladder-type structure (Paterson et al. Reference Paterson, Vogt, Fink and Munch1973); (b) presence of tones as a function of Reynolds number and angle of attack (present case marked with a red star).

Several authors (see Nash et al. (Reference Nash, Lowson and McAlpine1999), Desquesnes, Terracol & Sagaut (Reference Desquesnes, Terracol and Sagaut2007), de Pando (Reference de Pando2012), Pröbsting (Reference Pröbsting2015) and Padois et al. (Reference Padois, Laffay, Idier and Moreau2016), for instance) have reported the presence of flow instability near the trailing edge, whenever aerofoil tones are heard. With a global stability analysis, de Pando (Reference de Pando2012) argues that these boundary-layer instabilities are convectively unstable (Huerre & Monkewitz Reference Huerre and Monkewitz1985), as such the existence of self-sustained tonal noise would require an existence of a feedback loop. Similarly, Wu, Sandberg & Moreau (Reference Wu, Sandberg and Moreau2021) performed a global stability analysis on three different direct numerical simulation (DNS) databases at similar Reynolds and Mach numbers on two different aerofoils. They showed that the flow separation and reattachment at the trailing edge on the suction side of the aerofoil seems to be the only prerequisite of the establishment of the feedback loop, regardless of the presence of tones in the DNS. Several aerofoil tonal noise studies have previously evidenced the existence of a feedback loop (see Arcondoulis et al. (Reference Arcondoulis, Doolan, Zander and Brooks2013), Pröbsting (Reference Pröbsting2015), Arcondoulis, Liu & Xu (Reference Arcondoulis, Liu and Xu2019) and Yakhina (Reference Yakhina2017), for instance). Tam & Reddy (Reference Tam and Reddy1977) were the first to pitch the idea of a feedback loop between acoustic sources in the wake and upstream boundary-layer disturbances. In contrast, Arbey & Bataille (Reference Arbey and Bataille1983) reasoned that the acoustic disturbance generated at the trailing edge instead is responsible for the feedback loop. Nash et al. (Reference Nash, Lowson and McAlpine1999) conjectured that hydrodynamic instabilities present near the trailing edge or in the near wake were responsible for feedback. Nash et al. (Reference Nash, Lowson and McAlpine1999) laid a hypothesis that large scale hydrodynamic oscillations are responsible for that frequency selection, which results in acoustic tones. Gelot & Kim (Reference Gelot and Kim2020) gave indirect evidence of acoustic feedback using Reference Arbey and BatailleArbey & Bataille's (?)emi-empirical formula. However, Reference Gelot and KimGelot & Kim's (?)nalysis assumes constant convective velocity, which is in disagreement with their own results and previous measurement data (Yakhina et al. Reference Yakhina, Roger, Moreau, Nguyen and Golubev2020). Furthermore, Reference Gelot and KimGelot & Kim's (?)nalysis assumes that acoustic wave fronts enter the laminar separation bubble (LSB) region. This claim cannot be substantiated without a receptivity analysis. In particular, the LSB must be shown to convert the longer acoustic waves to shorter hydrodynamic waves or pressure gusts. This is especially true for low Mach number flows because the ratio of the acoustic to hydrodynamic wavelength is inversely proportional to the Mach number. In fact, for low Mach number flows, analytical results of leading-edge receptivity theory (Goldstein Reference Goldstein1983; Saric, Reed & Kerschen Reference Saric, Reed and Kerschen2002) point to the leading edge as the most probable location where wavelength conversion of the disturbances can take place. In addition, when an aerofoil is acoustically excited, Pröbsting & Yarusevych (Reference Pröbsting and Yarusevych2021) have demonstrated that the wavelength conversion processes take place in the leading-edge region of the aerofoil. Furthermore, Yakhina et al. (Reference Yakhina, Roger, Moreau, Nguyen and Golubev2020) have found the existence of principal and secondary tone frequencies in their wall-pressure spectra measurements. These high-amplitude peaks have also been measured by the probes that are located close to the leading edge of the aerofoil. Since the disturbance induced by the hydrodynamic events is likely to be damped more quickly than acoustic disturbances, which are known to propagate with little attenuation, these peaks in the wall-pressure spectra (measured at the leading edge of the aerofoil) are likely caused by acoustic disturbances. However, a more direct proof is lacking that would confirm the precise nature of the disturbances. Therefore, the first objective of this paper is to substantiate the existence of a feedback loop, and provide direct evidence as to whether this feedback loop is acoustic or hydrodynamic in nature. In order to show the presence of principal and secondary tone peaks, the wall-pressure spectra close to the leading edge are measured in the case of the CD aerofoil. For the tonal noise generated by an aerofoil, this will help to identify the region of wavelength (acoustic to hydrodynamic) conversion.
Acoustic or hydrodynamic forcing has important consequences for the flow transition and boundary-layer instability. In particular, it has been shown that Kelvin–Helmholtz-type instabilities are receptive to disturbances generated by an external acoustic source (Andan & Lee Reference Andan and Lee2018; Kurelek, Kotsonis & Yarusevych Reference Kurelek, Kotsonis and Yarusevych2018; Kurelek, Yarusevych & Kotsonis Reference Kurelek, Yarusevych and Kotsonis2019; Pröbsting & Yarusevych Reference Pröbsting and Yarusevych2021) or a plasma actuator (Michelis, Yarusevych & Kotsonis Reference Michelis, Yarusevych and Kotsonis2018b). The type of boundary-layer instability that generates aerofoil tones has been a source of controversy in the past. Tam & Reddy (Reference Tam and Reddy1977), for example, had conjectured a Tollmien–Schlichting (TS) flow instability to be responsible for the emission of aerofoil tones. The TS waves are the first stages of flow transition from the laminar to the turbulent boundary layer. However, Atassi (Reference Atassi1984) pointed out that the flow separation near the trailing edge implies the presence of separated shear flow-type instability, similar to that of Kelvin–Helmholtz type. This has been supported more recently by de Pando (Reference de Pando2012) and Pröbsting & Yarusevych (Reference Pröbsting and Yarusevych2015). In particular, Pröbsting & Yarusevych (Reference Pröbsting and Yarusevych2015) argued that the velocity fluctuations measured near the trailing edge exceed the fluctuations typically present in TS wave instability. Recently, Sanjose et al. (Reference Sanjose, Towne, Jaiswal, Moreau, Lele and Mann2019) performed a three-dimensional DNS on the CD aerofoil in the present flow regime, and found a Kelvin–Helmholtz-type instability to be the cause of tonal noise. Therefore, the second objective of the present study is to experimentally confirm the findings of Sanjose et al. (Reference Sanjose, Towne, Jaiswal, Moreau, Lele and Mann2019).
Once the nature of the boundary-layer instability responsible for aerofoil tones has been established, it will be helpful to understand the modal structure of the boundary-layer instability from a noise or flow-control point of view. Previous experimental investigations confirm the presence of a LSB (Nash et al. Reference Nash, Lowson and McAlpine1999). The vortices emanating from the LSB have high spanwise coherence (see Burgmann & Schröder (Reference Burgmann and Schröder2008), for instance). These highly correlated structures are mostly two-dimensional spanwise vortices. Usually, soon after the formation of these two-dimensional vortices, they start to become distorted and may undergo a complete three-dimensional breakdown (Maucher, Rist & Wagner Reference Maucher, Rist and Wagner1997). To reveal the modes of the flow when a LSB is subjected to external forcing, Michelis (Reference Michelis2017), Michelis, Kotsonis & Yarusevych (Reference Michelis, Kotsonis and Yarusevych2018a) and Kurelek et al. (Reference Kurelek, Kotsonis and Yarusevych2018) performed proper orthogonal decomposition (POD) (see Holmes et al. (Reference Holmes, Lumley, Berkooz and Rowley2012), for instance). However, these studies did not explicitly look into the cases where aerofoil tones are generated through a self-sustained mechanism.
Furthermore, previous experimental studies on aerofoil self-noise (McAlpine Reference McAlpine1997; Nash et al. Reference Nash, Lowson and McAlpine1999; Nakano, Fujisawa & Lee Reference Nakano, Fujisawa and Lee2006; Pröbsting, Serpieri & Scarano Reference Pröbsting, Serpieri and Scarano2014; Pröbsting et al. Reference Pröbsting, Scarano and Morris2015) have only performed two-dimensional velocity measurements; as such, they were unable to capture full three-dimensional flow features. On the other hand, previous DNS on aerofoil tones were mostly two-dimensional (Desquesnes et al. Reference Desquesnes, Terracol and Sagaut2007; Tam & Ju Reference Tam and Ju2012; de Pando, Schmid & Sipp Reference de Pando, Schmid and Sipp2014), with the exception of Sanjose et al. (Reference Sanjose, Towne, Jaiswal, Moreau, Lele and Mann2019), who performed a three-dimensional DNS including the open-jet environment. Yet, for the present Reynolds number, a two-dimensional flow is characteristically different from a three-dimensional one (Kraichnan Reference Kraichnan1967), in that the process of energy cascade can no longer be linked to vortex stretching in the spanwise direction. Hence, studying an inherently three-dimensional flow phenomenon with a two-dimensional DNS can be misleading. Yet, de Pando et al. (Reference de Pando, Schmid and Sipp2014) argued, based on existing experimental measurements, that as the boundary-layer instabilities associated with aerofoil tones are coherent in the spanwise direction; therefore, the main features of the generation of tones can be assessed by two-dimensional simulations. Moreover, these numerical studies were achieved at Mach numbers much higher than their experimental counterpart. However, if the feedback loop is caused by acoustic disturbances travelling upstream, towards the leading edge, then the flow Mach number becomes an important metric. Nevertheless, a full three-dimensional DNS with a significant span at these Reynolds numbers ( ${\sim }0.5 - 6.0 \times 10^{5}$) and Mach number (
 ${\sim }0.05$) remains computationally prohibitive. Thus, the third objective of the paper is a three-dimensional flow-field measurement and its modal decomposition at low Mach number of
 $0.05$ and low to moderate Reynolds number (based on the chord) of
 $1.4 \times 10^{5}$, at a geometric angle of attack of
 $5^{\circ }$. Furthermore, these measurements have been performed in a unique anechoic and low turbulence intensity environment to decouple aerofoil self-noise from external forcing. No external forcing either acoustic or hydrodynamic is applied, and the problem of self-sustained aerofoil tonal noise is therefore studied.
The choice of the CD aerofoil in the present study comes from its broad range of applications in various modern ventilation and propulsion systems, from high-speed turbofans and compressors to aircraft and automotive low-speed ventilators. Indeed, this aerofoil geometry reduces drag by controlling the turbulent boundary-layer diffusion on its suction side. Therefore, such a study is expected to additionally advance knowledge and understanding not only on aerofoil tones but also on boundary-layer transition, in various low-speed (low Mach number) and low–moderate Reynolds number applications such as small scale fans, ventilation systems, model drones and UAVs. Furthermore, these velocity–pressure data sets will provide a benchmark for validation of future three-dimensional DNS (with a significant span) at this Reynolds and Mach number.
2. Experimental set-up and instrumentation
As mentioned above, to mitigate contamination of the measured signal from external spurious sources, all the measurements for the aerofoil tonal noise case have been carried out in the anechoic open-jet wind-tunnel facility located at the Université de Sherbrooke (UdeS) (Padois et al. Reference Padois, Laffay, Idier and Moreau2015). The CD aerofoil has a  $0.1347$ m chord (
 $C$), a
 $0.3$ m span, a
 $4\,\%$ thickness-to-chord ratio and a
 $12^{\circ }$ camber angle. The aerofoil is equipped with several pinholes, which are located along the chord and span as shown in figure 2. These pinholes are used to measure pressure fluctuations using remote microphone probes (RMP) (Perennes & Roger Reference Perennes and Roger1998) and mean static pressure using pressure sensors (see Sanjose et al. (Reference Sanjose, Towne, Jaiswal, Moreau, Lele and Mann2019) for details). In particular, Knowles FG
 $23329$-P
 $07$ microphones with a nominal sensitivity of approximately
 $22.4$ mV Pa
 $^{-1}$ and a dynamic range of
 $115$ dB have been used. These microphones are connected remotely using a 0.5 mm pinhole. Since these microphones are connected remotely, a correction in phase and magnitude is needed. This has been achieved by performing an in situ calibration of the RMP (see Jaiswal et al. Reference Jaiswal, Moreau, Avallone, Ragni and Pröbsting2020). Lastly, to measure mean wall pressure the pinholes are connected to a capacitance based manometer, which has an accuracy of
 ${\pm }0.25\,\%$ on the reading range.
Location of pinholes on the CD aerofoil.

The CD aerofoil is placed at a  $5^{\circ }$ geometric angle of attack with the help of Plexiglas plates of thickness
 $4.725$ mm laser cut to reduce uncertainty in angle of attack while placing the aerofoil and at the same time giving good optical access. All the measurements are performed at
 $16$ m s
 $^{-1}$ corresponding to
 $Re_c=1.4\times 10^{5}$. At these conditions, as reported previously, acoustic tones are heard (Padois et al. Reference Padois, Laffay, Idier and Moreau2016; Sanjose et al. Reference Sanjose, Towne, Jaiswal, Moreau, Lele and Mann2019), as shown in figure 1(b).
2.1. Synchronised planar particle image velocimetry measurements
Synchronised velocity–pressure measurements have been performed to reveal the causality between local flow-field disturbances and far-field acoustics. The time-averaged correlation map is expected to reveal the pattern and region of the boundary layer that is responsible for far-field noise. The synchronised measurements are achieved by simultaneously measuring velocity, wall pressure and far-field pressure using particle image velocimetry (PIV), RMP and a  $1/2$ inch microphone with an integrated circuit piezoelectric, respectively. These measurements are made by placing the laser and its cooling system inside the anechoic wind-tunnel facility. To ensure that the far-field microphone recorded only the aerofoil self-noise, acoustic wedges were placed around the laser-cooling system. Two synchronised measurements were performed on the suction and pressure sides of the aerofoil. The synchronisation between PIV and pressure measurements was achieved using the procedure outlined by Henning et al. (Reference Henning, Kaepernick, Ehrenfried, Koop and Dillmann2008). Lastly, separate wall-pressure and far-field acoustic measurements were performed without the PIV set-up to confirm the proper noise shielding of the wedges in the above synchronised case.
2.2. Planar PIV measurement set-up
The images for the planar PIV measurements have been acquired with a  $5.5$ megapixel sCMOS camera. An Evergreen ND:YAG dual pulsed laser was used as the light source. This dual pulse laser can yield up to
 $200$ mJ of energy per pulse. The pulse duration was set to
 $30$ ns. A portable smoke machine was used to seed, which generates a fog of glycerin droplets. The size of these droplets was roughly 1
 $\mathrm {\mu }$m in diameter. The anechoic room was filled with the glycerin droplets, and the images were acquired only when the glycerin droplets were distributed uniformly in the image plane. For the suction and pressure-side measurements, images were acquired at a sampling frequency of
 $8$ Hz. The digital magnification for the suction- and pressure-side measurements was approximately 114 and 132 pixel mm
 $^{-1}$, respectively. The time between image pairs was chosen to minimise the relative random error in estimating the particle displacement. Consequently, the free-stream particle displacement for the suction-side and pressure-side measurements was approximately
 $14$ and
 $13$ pixels, respectively.
Images were processed with Lavision's DAVIS 8.4 software using a multigrid iterative window deformation scheme. A total of nine passes was achieved. In the iterative multigrid scheme, an overlap of  $75\,\%$ and an elliptical weighting (elongated in the mean-flow direction) were used. For the suction-side vector calculations, the initial window size was
 $96 \times 96$ pixels, while the final window size for the suction-side measurement was
 $24 \times 24$ pixels, yielding a spatial resolution of approximately
 $0.21$ mm (a vector pitch of
 $0.0525$ mm). In total, approximately
 $4000$ images were acquired and processed for the suction-side measurements. For the pressure-side measurement calculation, the initial window size was
 $64 \times 64$ pixels, while the final window size for the suction-side measurement was
 $16 \times 16$ pixels, yielding a spatial resolution of approximately
 $0.12$ mm (a vector pitch of
 $0.04$ mm). In total,
 $2400$ images were acquired and processed for the pressure-side measurements.
In all the measurements, an average velocity field has been initially calculated by processing the first  $700$ images. For the subsequent calculations using the multipass scheme, the average velocity field is used as a predictor for the particle image displacement in the first pass. This increases the overall value of the particle displacement correlation. All the relevant measurement parameters are listed in table 1 for the convenience of the reader.
Parameters used for the planar PIV measurements.

2.3. Tomographic PIV set-up
The tomographic PIV (Tomo-PIV) measurements have been performed using four sCMOS cameras each with a sensor size of  $2560 \times 2160$ pixels arranged linearly in a side scattering mode to minimise reflections (see figure 4). Since the source region of aerofoil self-noise is near the trailing edge (see Amiet (Reference Amiet1976), for instance), the flow measurements were performed in the trailing-edge region. Camera sensors are rotated to align the largest and the smallest sides of the sensor with the spanwise and the streamwise directions of the aerofoil, respectively. The cameras are fitted with AF Nikkor 200 mm
 $1\,{:}\,4D$ lenses to achieve an average optical magnification of 56 pixel mm
 $^{-1}$. An ND-YAG dual pulsed laser from Litron Inc (Nano-PIV) was used as a light source, and the volume was generated using Lavision's volume optics module. The energy output was measured to be equal to
 $385$ mJ from laser
 $1$ and
 $425$ mJ from laser
 $2$. The size of the measured volume is approximately
 $3 (\rm {streamwise}) \times 4 (\rm {span}) \times 0.7 (\rm {wall normal})$ cm
 $^{3}$. Glycerin particles are used as seeding material, and an average physical particle size is estimated to be around 1
 $\mathrm {\mu }$m diameter. All the PIV data have been first processed using Lavision's commercial code DAVIS 8.4. For the processing of the Tomo-PIV data, the images were preprocessed to remove the background noise. The image quality was then improved with further image processing where local nonlinear filtering was used to remove surface reflections and a Gaussian smoothing filter of kernel size
 $3 \times 3$ applied to make the particles appear round and regular. The tomographic image reconstruction step was achieved using the Fast multiplicative algebraic reconstruction technique (Fast-MART) algorithm wherein a
 $10$ simultaneous MART (SMART) iteration is performed followed by nine smoothing operations. Since the source density is estimated to be slightly higher than
 $0.3$, the reconstruction of ghost particles cannot be avoided in the reconstructed field (Novara Reference Novara2013). To reduce the ghost particle reconstruction, the motion tracking enhancement(MTE) algorithm is used. In total, three MTE iterations are achieved before the final correlation analysis. The first MTE iterations are performed on a coarser grid to save time and also improve the accuracy of the predicted velocity. The last two MTE iterations were made on a finer grid of size
 $28 \times 28 \times 28$ voxel
 $^{3}$, which is also the size of the final grid. All the correlations are achieved using the direct correlation method. Before the final velocity correlation step, a zero velocity at the wall was applied and the reconstructed volume below the wall masked. These steps are found to improve the near-wall velocity predictions. Finally, the physical size of the voxel of interrogation is approximately
 $0.5$ mm
 $^{3}$ with a vector pitch of
 $0.125$ mm. In total, approximately
 $1700$ images were processed. All the relevant measurement parameters are listed in table 2 for the convenience of the reader.
Parameters used for the tomographic PIV measurements.

2.4. Uncertainty quantification
Finite recording time in measurements results in statistical spread of the measured quantity. This statistical spread or averaging uncertainty in estimating mean, standard deviation and higher-order statistics depends on the number of independent samples (Benedict & Gould Reference Benedict and Gould1996). The present authors (Sanjose et al. Reference Sanjose, Towne, Jaiswal, Moreau, Lele and Mann2019; Jaiswal et al. Reference Jaiswal, Moreau, Avallone, Ragni and Pröbsting2020) and several others have used the finite sampling time in PIV, wall-pressure and far-field acoustic measurements to estimate the averaging uncertainty in the first-, second- and fourth-order statistics. Following the same approach the averaging uncertainty in statistical quantities have been reported in table 3. The first- and second-order statistics are all below 1  $\%$ and 5
 $\%$ respectively. For the quantification of phase velocity (taken from Glegg & Devenport Reference Glegg and Devenport2017, p. 293), the averaging error (
 $\epsilon _{\varTheta _{ij}}$) in calculating the phase
 $\varTheta _{ij}$ between two RMPs, is given by the following equation:
 \begin{equation} \epsilon_{\varTheta_{ij}} = \frac{\sqrt{2} \times \sqrt{1-\gamma^{2}_{ij}}}{\gamma_{ij} \sqrt{N_{s}}}, \end{equation}
where,  $N_{s}$ is the number of independent samples and
 $\gamma ^{2}_{ij}$ is the magnitude squared coherence (MS coherence), while
 $\gamma _{ij}$ is simply its square root.
Uncertainty quantification for various measured quantities.

Lastly, table 3 also reports various random errors that are inherent to any PIV measurements (see Ghaemi, Ragni & Scarano (Reference Ghaemi, Ragni and Scarano2012), for instance).
Planar PIV set-up for synchronised velocity–pressure measurements.

Experimental set-up for the Tomo-PIV measurements and acoustic array.

Mean wall-pressure coefficient  $C_p$. Black circle with solid line
 $C_p$ distribution on the suction side; light grey circle with solid line
 $C_p$ distribution on the pressure side.

3. Wall-pressure analysis
The mean wall-pressure coefficient ( $C_p$) is plotted in figure 5. Here, (
 $x,y$) represents the fixed laboratory reference frame at the aerofoil midspan,
 $x$ being parallel to the jet axis and oriented with the flow, and the origin is taken at the aerofoil trailing edge. A plateau in the value of
 $C_p$ can be seen at approximately 0.85–0.88 chord (corresponding to the positions of RMPs 21 and 22), indicating a mean-flow recirculation bubble as was shown before by Sanjose et al. (Reference Sanjose, Towne, Jaiswal, Moreau, Lele and Mann2019). On the suction side, the flow encounters a favourable pressure gradient until approximately 0.60 chord. However, the mean wall pressure does not reveal the unsteady nature of the flow past an aerofoil. To reveal this, histograms of
 $C_p$ are plotted at different locations along the aerofoil in figure 6. Each histogram is computed using Matlab's built-in function histogram. To increase the confidence in estimating the probability density, a moving average filter was used (see Grandemange (Reference Grandemange2013), for instance). Figures 6(a) and 6(b) compare the effects of the moving average filter on the distribution. Although the distribution pattern is not substantially altered, the confidence in measurement is improved because averaging reduces measurement noise. Therefore, for the subsequent plots the moving average filter has been retained. On the one hand, from figure 6, the pressure is seen to have a broad distribution from RMP 22 to RMP 24. This broad pressure distribution is the first sign of the flapping of the LSB. On the other hand, the histogram of RMP 21 shows a very narrow distribution, indicating one preferred state of the LSB bubble, perhaps due to the phase locking. Finally, note that the probability density function is not only broadening toward the trailing edge but also switching from a unimodal distribution with a single peak to a bimodal distribution, similarly to what is observed for instance in a three-dimensional corner separation in a linear compressor cascade (Gao et al. Reference Gao, Ma, Zambonini, Boudet, Ottavy, Lu and Shao2015).
Probably density function of the loading. (a) RMP 21 ( $x/C =0.85$) without moving average filter; (b) RMP 21 (
 $x/C =0.85$) (with moving average filter); (c) RMP 22 (
 $x/C =0.88$); (d) RMP 23 (
 $x/C =0.90$); (e) RMP 24 (
 $x/C = 0.92$); (f) RMP 26 (
 $x/C =0.98$).

The autospectra of the wall-pressure fluctuations are plotted in figure 7. Figure 7(a) shows them at the leading edge whereas figure 7(b) focuses on the trailing-edge region. The latter autospectra have much higher levels, which is typical of a turbulent boundary layer. The former have levels at least one decade lower with much sharper slopes typical of laminar boundary layers on this aerofoil (Moreau & Roger Reference Moreau and Roger2005). For instance, RMPs 1 and 2 show very similar behaviour as was found at the same locations on the same aerofoil at 8 $^{\circ }$ angle of attack by Moreau & Roger (Reference Moreau and Roger2005). However, a high frequency broadband hump (beyond 1 kHz) starts to appear in the wall-pressure spectra from RMP 3 onwards, which suggests the presence of instabilities within the boundary layer. Its peak amplitude is observed near RMP 5 and then starts decaying toward mid-chord, most likely because of the positive mean pressure gradient observed in figure 5 that stabilises the boundary layer and any hydrodynamic instability. Moreover, all autospectra exhibit several discrete peaks superimposed over the broadband signal starting at RMP 3. A clear dominant peak starts emerging at 864 Hz from RMP 5 to the trailing edge (figure 7b). Only for RMP locations 1 and 2 are no peaks seen. Thus only a very narrow band of frequency gets amplified beyond RMP 3, resulting in peaks in the wall-pressure spectra. It was conjectured by Tam (Reference Tam1974) that this frequency selection is caused by a feedback loop. These peaks in the wall-pressure spectra are present from
 $7\,\%$ of the chord length until the aerofoil trailing edge. Note that these tones are several decibels (at least 10 to 20 dB) higher than the broadband contribution, a sign of resonance. These findings are in line with the results of Yakhina et al. (Reference Yakhina, Roger, Moreau, Nguyen and Golubev2020), who also reported that RMPs located close to the leading edge of the aerofoil show amplification in wall-pressure spectra at discrete frequencies, which are equal to that of the tonal noise frequencies. Furthermore, if these flow disturbances are phase locked with acoustic or hydrodynamic disturbances, then large parts of the aerofoil in the streamwise and spanwise directions should be correlated.
Autospectra of wall-pressure fluctuations on the suction side of the aerofoil placed at  $5\,^{\circ }$ and
 $16$ m s
 $^{-1}$: (a) leading-edge and mid-chord sensors (RMPs 1 to 9); (b) trailing-edge sensors (RMPs 21 to 28).

To verify the extent of correlation over the suction side of the aerofoil, the magnitude squared coherence (between different RMPs) is plotted in figure 8. Figure 8(a) shows that at the tone frequencies large parts of the aerofoil chord are correlated. In fact, RMP 3, located close to the leading edge of the aerofoil, correlates with RMP 26 that is close to the trailing edge, at the principal tone frequency. This substantiates that the feedback loop extends close to the leading edge of the aerofoil. This is consistent with the leading-edge receptivity theory (Saric et al. Reference Saric, Reed and Kerschen2002), and wavelength conversion processes seem to take place at the leading edge of the aerofoil in the present case. Similarly, figure 8(b) shows that, when the distance between two RMPs is smaller, large bands of frequencies show significant values of magnitude squared coherence. In contrast, at large separation distances (greater than  ${\sim }1 - 2 \times \delta _{95}$), the magnitude squared coherence is only significant for a very narrow band of frequencies. Similar results were obtained with the data sets of Yakhina (Reference Yakhina2017). Note that such high coherence levels at a given frequency over such large distances are only found when a resonance phenomenon such as a feedback loop is present. Indeed, for a fully turbulent flow field, the vortical structures dissipate quickly and consequently the streamwise correlation of wall-pressure fluctuations remain low and drops quickly with distance (see for instance figures 10 and 11 in Moreau & Roger Reference Moreau and Roger2005).
Magnitude squared coherence: (a) coherence for probes in the streamwise direction; (b) coherence for probes in the spanwise direction.

A RMP captures both acoustic and hydrodynamic pressure fluctuations. The latter, being the dominant ones in terms of magnitude, can mask the former. Nevertheless, the acoustic fluctuations can travel vast distances with small attenuation in any direction. In comparison, the hydrodynamic turbulent fluctuations undergo a rapid attenuation and are convected with the flow. This property can be used to distinguish between acoustic and hydrodynamic fluctuations, for example, when the RMPs are separated by considerable distance ( ${\sim }6 - 10 \times \delta _{95}$).
To establish the nature of the feedback loop, the convection velocities are calculated. The convection velocity can be calculated either by performing the cross-correlation on a filtered (band-passed) signal (see Willmarth & Wooldridge (Reference Willmarth and Wooldridge1962), for instance) or by calculating the derivative of the unwrapped phase for the range of frequency of interest (Moreau & Roger Reference Moreau and Roger2005; Del Álamo & Jiménez Reference Del Álamo and Jiménez2009). The latter is shown between RMPs 21 and 26 in figure 9. The black solid line shows information travelling in the downstream direction, while the red dashed line shows information travelling in the upstream direction. The existence of such waves travelling in both directions is a necessary condition for a feedback loop. Two other changes of phase occur at side peaks, i.e.  $\sim$738 Hz and
 $\sim$990 Hz. They all yield propagation velocities close to the speed of sound.
Phase of wall-pressure fluctuations between RMPs 21 and 26: dashed red line highlights the slope change at the dominant tone frequency.

To confirm this result and to obtain a more accurate estimate of propagation speed, the convection velocity has also been calculated using the cross-correlation approach. This procedure is encapsulated below:
(i) Correct the individual RMP signals for any distortion in phase (see Zambonini & Ottavy (Reference Zambonini and Ottavy2015), for instance).
(ii) Use zero-phase digital band-pass filtering to retain only the frequency range of interest.
(iii) Calculate the cross-correlation between the two filtered signals to determine the time lag for the maximum value of correlation.
(iv) Calculate the convection velocity by dividing the separation length by the time lag.
Nevertheless, even a small change in phase (due to the calibration procedure of the RMP) can lead to a significant error in convective velocity. To minimise the relative error, the probes which are separated by large distances are used to calculate the convection velocity. For this reason, the cross-correlation procedure has been found to yield consistent estimates of convection velocity without any data fitting. The results of the cross-correlation analysis in figures 10(a) and 10(b) show that the maximum cross-correlation coefficient has a negative time delay, implying that the disturbances travel upstream from the trailing edge towards the leading edge of the aerofoil. This unambiguously shows that a feedback loop exists, as shown by many studies in the past (Yakhina et al. Reference Yakhina, Roger, Moreau, Nguyen and Golubev2020). Furthermore, the convection speed of these disturbances is close to the acoustic velocity, i.e.  $327$ m s
 $^{-1}$ and
 $309$ m s
 $^{-1}$ for RMPs 26–7 and RMPs 26–9, respectively. This further proves that the feedback loop is acoustic. RMP probes upstream of RMP 7 are not used for the analysis because the value of the correlation is small (figure 8a), causing higher uncertainty in the estimation of phase (see (2.1)).
Cross-correlation: (a) between filtered (band-passed 650–1050 Hz) signals of RMPs 26 and 9; (b) between filtered (band-passed 650–1050 Hz) signals of RMPs 26 and 7.

4. Velocity field validation and analysis
To get a more quantitative information about the flow field, figure 11 shows the mean-flow field and the first-order statistics around the trailing edge of the CD aerofoil. A local reference frame ( $x_1,x_2$), normal and tangential to the aerofoil surface at RMP 26, is now used similarly to what Jaiswal et al. (Reference Jaiswal, Moreau, Avallone, Ragni and Pröbsting2020) defined at an 8
 $^{\circ }$ geometric angle of attack near the trailing edge of the CD aerofoil. Negative values of mean wall-parallel or streamwise velocity
 $U_1$ confirm the presence of a large re-circulation zone near the trailing edge (
 ${\sim }0.85 \times$ chord) on the suction side of the aerofoil. According to Nash et al. (Reference Nash, Lowson and McAlpine1999) the existence of the re-circulation region is a necessary condition for the aerofoil tones (Nash et al. Reference Nash, Lowson and McAlpine1999). This has been recently confirmed by several global stability analyses on two different aerofoils by Wu et al. (Reference Wu, Sandberg and Moreau2021). Furthermore, this separated shear layer undergoes turbulent re-attachment very close to the trailing edge of the aerofoil.
Velocity field around the aerofoil: (a) mean wall-parallel velocity; (b) mean wall-normal velocity; (c) standard deviation wall-parallel velocity; (d) standard deviation wall-normal velocity.

The flow on the pressure side is attached and laminar, as can be seen from low values of turbulent fluctuations in figures 11(c) and 11(d). This is not surprising since the pressure side encounters a mean favourable pressure gradient (see figure 5), and consequently it creates an unfavourable condition for the growth of any hydrodynamic disturbances at the present moderate Reynolds number. Since the turbulent fluctuations are negligible on the pressure side of the aerofoil (near the trailing-edge region), it appears that the pressure-side boundary layer does not participate in the generation of acoustic tones. However, to confirm this, the causality correlation between far-field acoustic pressure and near-field velocity fluctuations must be evaluated.
To validate the tomographic and planar PIV measurements, the mean and root-mean-square (r.m.s.) velocity profiles are compared at fixed midspan and at discrete streamwise locations, as shown in figures 12 and 13, respectively. A good comparison is achieved for wall-parallel velocity at all the streamwise locations shown in figure 12. Some discrepancies in measured wall-normal turbulent fluctuations are noticeable close to the wall. This is caused by the finite tomographic angular aperture in the direction of volume reconstruction (Scarano Reference Scarano2012). Lastly, limited spatial resolution results in the three-dimensional modulations (see Ragni et al. (Reference Ragni, Avallone, van der Velden and Casalino2019), for instance), which makes estimation of Reynolds stress less accurate near the wall for the Tomo-PIV measurements. Since the wall-parallel component of the velocity fluctuations decays very slowly (compared with wall-normal velocity fluctuations) near the wall, it requires prohibitively high spatial resolution to avoid any modulations of the measured flow structures. Furthermore, at locations close to the edge of the illuminated volume (RMP 22), this discrepancy is better evidenced. Nevertheless, the comparison between the r.m.s. velocities measured by Tomo-PIV and planar PIV is remarkable when compared with several Tomo-PIV measurements performed in the past on flow over aerofoils. This is partly because of the higher image magnification of the current Tomo-PIV measurements compared with the measurements of the past (see Rafati & Ghaemi Reference Rafati and Ghaemi2016, for instance).
Mean wall-parallel velocity comparison between Tomo- and planar PIV at various streamwise locations: (a) RMP 21; (b) RMP 22; (c) RMP 23; (d) RMP 24; (e) RMP 26.

The r.m.s. velocity components  $u'_i$ (at midspan) normalised by the inlet velocity
 $U_{\infty }$, i.e. 16 m s
 $^{-1}$: (a) RMP 22; (b) RMP 23; (c) RMP 24; (d) RMP 26.

Figure 12 also shows values of integral boundary-layer parameters that were calculated using the mean velocity profiles. Higher values of the shape factor  $H$, defined as the ratio of displacement to momentum thickness, between RMPs 21 and 24 confirms the presence of the LSB near the trailing edge of the aerofoil. This is consistent with the observed negative streamwise velocities
 $U_1$. In contrast close to the trailing edge, low values of the shape factor (around 1.9) suggest that the flow undergoes a mean turbulent reattachment. This is also evident looking at the fuller boundary-layer profile at RMP 26. This variation of the
 $H$-factor in the aft portion of aerofoil also confirms the evolution found in the three-dimensional lattice Boltzmann method DNS (LBM-DNS) (figure 10 in Sanjose et al. Reference Sanjose, Towne, Jaiswal, Moreau, Lele and Mann2019).
The boundary-layer profiles at RMPs 21 and 22 have inflection points. In fact, they satisfy the necessary condition for the existence of inviscid instability (Fjørtoft Reference Fjørtoft1950; Drazin & Reid Reference Drazin and Reid1981). A LSB is known to act as an amplifier of incoming disturbances that enter the laminar separated flow (Theofilis, Hein & Dallmann Reference Theofilis, Hein and Dallmann2000), and growing unstable modes of Kelvin–Helmholtz-type instability might emerge. These Kelvin–Helmholtz-type instabilities have been reported to exist downstream of a LSB (Watmuff Reference Watmuff1999). Kelvin–Helmholtz-type instabilities are marked by large, spanwise vortex rollers, which are predominantly two-dimensional (see Brown & Roshko Reference Brown and Roshko1974, for instance). Sanjose et al. (Reference Sanjose, Towne, Jaiswal, Moreau, Lele and Mann2019) also observed these two-dimensional rollers in their three-dimensional LBM-DNS. To confirm the presence of these two-dimensional rollers, the  $\varLambda _{ci}$ criterion (Zhou et al. Reference Zhou, Adrian, Balachandar and Kendall1999) has been used. Indeed, the velocity gradient tensor can be decomposed in Cartesian coordinates, such that the local streamlines are spanned by the eigenvectors of the velocity gradient tensor. In such a Cartesian coordinate reference frame, the swirling nature of the flow can be characterised by a plane that is normal to the principal axis of vortex stretching or compression. The strength of this local swirling motion is given by
 $\varLambda _{ci}$ (Zhou et al. Reference Zhou, Adrian, Balachandar and Kendall1999). Figure 14 shows the
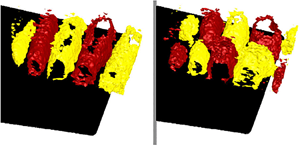
 $\varLambda _{ci}$ criterion, at the same instant, coloured by the streamwise velocity. Large spanwise vortex rollers, which are predominantly two-dimensional, are observed. Similar vortical structures, quiet or intense at different instants, were reported by Sanjose et al. (Reference Sanjose, Towne, Jaiswal, Moreau, Lele and Mann2019). Yet, when comparing with figure 5 in Sanjose et al. (Reference Sanjose, Towne, Jaiswal, Moreau, Lele and Mann2019), the rollers measured over a larger span exhibit a slightly wavier pattern before breaking down, stressing the three-dimensional nature of the transition to turbulence. Indeed, these structures break down into less coherent three-dimensional vortices near the trailing edge. This observation is further backed by figure 8(b), which shows lower values of magnitude squared coherence for large spanwise separation distance, a behaviour typical of fully developed turbulent boundary layers (see Wang et al. (Reference Wang, Moreau, Iaccarino and Roger2009), for instance).
The  $\varLambda _{ci}$ criterion coloured with wall-parallel velocity. Note that the span has been truncated to the measurement domain (
 $0.3 C$) to aid visualisation. The figures show the
 $\varLambda _{ci}$ criterion at the same instant, but with a different point of view.

The transport of streamwise turbulent kinetic energy can be evaluated using the third-order central moments  $\overline {{u'_1}^{3}}$ and
 $\overline {{u'_1}^{2} {u'_2}}$ shown in figure 15 (see Ma, Gibeau & Ghaemi (Reference Ma, Gibeau and Ghaemi2020), for instance). Like in the studies of Elyasi & Ghaemi (Reference Elyasi and Ghaemi2019) and Ma et al. (Reference Ma, Gibeau and Ghaemi2020), the present investigation confirms that the transport of turbulent kinetic energy is carried out by sweep motions (positive
 $\overline {{u'_1}^{3}}$ and negative
 $\overline {{u'_1}^{2} {u'_2}}$) in the near-wall region, and farther from the wall by the ejection motions (negative
 $\overline {{u'_1}^{3}}$ and positive
 $\overline {{u'_1}^{2} {u'_2}}$). This is true except very close to RMPs 21–22 (
 $0.84 - 0.87$ C) in the near-wall region. An overlap between ejection and sweep motions and the maximum of wall-normal stresses is observed. It has been speculated that this overlap is due to diffusion of turbulent energy by sweep and ejections (Elyasi & Ghaemi Reference Elyasi and Ghaemi2019). Furthermore, the distribution of ejection events is qualitatively similar to the findings of Elyasi & Ghaemi (Reference Elyasi and Ghaemi2019) and Ma et al. (Reference Ma, Gibeau and Ghaemi2020) for separated turbulent boundary layers. Yet, the region dominated by the sweep events starts shrinking. Therefore, in the present case the sweep events are much more localised and weakened after the separated boundary layer encounters turbulent reattachment. Lastly, in the present case the regions of ejections and sweeps are located next to each other. Thus the transport of streamwise turbulent kinetic energy is much more efficient here than in the cases considered by Elyasi & Ghaemi (Reference Elyasi and Ghaemi2019), Ma et al. (Reference Ma, Gibeau and Ghaemi2020).
Contours of the third-order central moments  ${\overline {{u'_i}^{3}}}$ (at mid-span) in the
 $x_1$-
 $x_2$ plane: (a)
 ${\overline {{u'_1}^{3}}}$; (b)
 ${\overline {{u'_1}^{2} {u'_2}} }$.

5. Far-field acoustics
Aerofoil tones consist of distinct peaks in far-field acoustic spectra. As mentioned above, these narrow peaks are intrinsic to the aerofoil tonal noise at moderate Reynolds number based on chord (Pröbsting et al. Reference Pröbsting, Scarano and Morris2015; Yakhina et al. Reference Yakhina, Roger, Moreau, Nguyen and Golubev2020), and as such they also exist in the case of the CD aerofoil (see Padois et al. (Reference Padois, Laffay, Idier and Moreau2015), Padois et al. (Reference Padois, Laffay, Idier and Moreau2016) and Sanjose et al. (Reference Sanjose, Towne, Jaiswal, Moreau, Lele and Mann2019), for instance). These observations are confirmed in the present case by the far-field acoustic pressure measurements shown in figure 16. The corresponding power spectral density of the far-field acoustic pressure at 1.21 m from the aerofoil trailing edge and at 90 $^{\circ }$ from the jet axis is shown in figure 16(a). Note that the levels are clearly above the background noise measured without the aerofoil (grey line), over the whole relevant frequency range (up to 10 kHz). A clear dominant tone at 864 Hz emerges over a broadband hump ranging from 300 to 1500 Hz. Two side tones also appear at
 $\sim$738 Hz and
 $\sim$990 Hz, corresponding to the above phase inversion in the wall-pressure fluctuations yielding acoustic propagation velocities. Similar spectral features are found at all angular locations around the aerofoil, and are very similar to the wall-pressure spectra close to the trailing edge shown in figure 7(b). This is consistent with what Moreau & Roger (Reference Moreau and Roger2009) found using the extended Amiet model for trailing-edge noise (Amiet Reference Amiet1976; Roger & Moreau Reference Roger and Moreau2005). As mentioned in the introduction, the frequency of the primary tone
 $f_S$ satisfies (1.1), and the frequency separation
 ${\rm \Delta} f$ between the primary and secondary tones is constant (equal to 126 Hz in the present case), as previously observed by Paterson et al. (Reference Paterson, Vogt, Fink and Munch1973) and Arbey & Bataille (Reference Arbey and Bataille1983) for instance. If a feedback loop length
 $L$ is inferred from (5) in Arbey & Bataille (Reference Arbey and Bataille1983)
 \begin{equation} \frac{L {\rm \Delta} f}{U_\infty} = 0.37 M_\infty^{{-}0.15},\end{equation}
we obtain  $L=0.55C$, which is beyond mid-chord between RMPs 7 and 9. For these sensor locations a strong tone at
 $f_S$ was observed in the wall-pressure autospectra (figure 7). In contrast, the linear stability analysis for the same case (see figure 25 in Sanjose et al. Reference Sanjose, Towne, Jaiswal, Moreau, Lele and Mann2019) predicts the location of the instability to be around
 $0.78C$ (
 $L=0.22C$). The former points to locations with almost zero mean pressure gradient or mild favourable pressure gradient, while the latter corresponds to the location close to the LSB. It is worth mentioning that the assumptions of small perturbations will not hold at locations close to the LSB, as shown below; therefore, the use of linear stability theory (LST) is not strictly valid. Nevertheless, LST is agnostic to the aerofoil geometry used, while (5.1) was obtained through data fitting flows past an NACA-0012 aerofoil. If the length of the feedback loop
 $L$ and the convection velocity of the flow instabilities
 $U_c$ are known, then the frequency of the tones can be predicted with the following equation (proposed by Arbey & Bataille Reference Arbey and Bataille1983):
 \begin{equation} f_n = \frac{U_c}{L} (n+1/2) \left(1+\frac{U_c}{a_{\infty}-U_\infty}\right)^{{-}1}.\end{equation}
If  $L$ is estimated with (5.1) and
 $U_c$ taken as the convection velocity of the flow instability (
 $\simeq 10$ m s
 $^{-1}$), (5.2) yields the following frequencies 718, 848 and 979 Hz, close to the experimental ones. If
 $L$ predicted by LST is used instead, the following frequencies 487, 813 and 1138 Hz can be obtained, which clearly discards such a feedback loop length. Yet, the constant 0.37 in (5.1) might not be more valid than the one in (1.1) for the CD aerofoil, and a longer feedback loop length
 $L$ extending all the way to RMP 5 in the leading-edge region (
 ${\simeq }0.8C$), where the first strong tone at
 $f_S$ appears, could be more appropriate and consistent with the aforementioned wall-pressure fluctuations. This leads to the following frequencies 762, 852 and 942 Hz, again close to the experimental ones. Nevertheless, as already mentioned in the introduction, it should be emphasised that all these simplified models rely on strong assumptions such as constant convection velocities and do not provide much physical insight into the physical mechanisms at stake such as the vortex dynamics that yields the observed acoustic signature. Moreover, given the uncertainty on the values input in (5.1) and (5.2), it is also impossible to clearly choose between the two proposed scenarios (mid-chord or leading-edge region).
Far-field acoustic measurements at 1.21 m from the aerofoil, and  $90^{\circ }$ from the jet axis: (a) ——– (black) sound pressure level measured with the aerofoil, - - - - - - (grey) background sound pressure level measured without the aerofoil; (b) directivity plot at the principal tone frequency at 864 Hz.

Narrow band frequency–time analysis using wavelet transform of far-field acoustic pressure measured by a microphone, which is placed at  $1.21$ m from the aerofoil and
 $90^{\circ }$ from the jet axis.

Figure 16(b) shows the directivity pattern of the far-field acoustic pressure at the principal tone frequency (864 Hz). A dipolar nature of the acoustic tones is confirmed. The noise radiation is principally along the jet axis. Small asymmetry is attributed to the aerofoil camber and to the fact that the aerofoil is placed at a non-zero angle of attack.
However, since acoustic spectra are time-averaged quantities, they cannot reveal the intermittent character of aerofoil tonal noise. Thus, to characterise unsteady behaviour of aerofoil tonal noise, a wavelet transformation (Farge Reference Farge1992) was carried out on the far-field microphone signal. The continuous wavelet transform was performed using a derivative of Gaussian wavelet. Figure 17 shows the wavelet transform of a single microphone pressure signal. The tonal noise shows strong modulation in frequency and amplitude. Based on the works of Padois et al. (Reference Padois, Laffay, Idier and Moreau2016), the present tonal noise case falls under the second regime of laminar boundary-layer instability noise, which is characterised by a more intermittent occurrence of the principal tone. This is also consistent with the results found in the three-dimensional LBM-DNS (figure 15 in Sanjose et al. Reference Sanjose, Towne, Jaiswal, Moreau, Lele and Mann2019). It also confirms the aforementioned strong nonlinearity close to the LSB.
6. Causality analysis
To identify the boundary-layer instability responsible for aerofoil tones, causality correlation between boundary-layer disturbances and far-field acoustic pressure has been performed. The causality correlation can be estimated using Pearson's correlation coefficient. However, it requires choosing of an appropriate metric to quantify the near-field source term. According to Amiet's theory and its extension (Amiet Reference Amiet1976; Roger & Moreau Reference Roger and Moreau2005), wall-pressure fluctuations are the noise source for the far-field acoustic pressure, justifying the above shape similarity of the respective spectra. However, only the near-field velocity data are provided by PIV. Among the various velocity components, the wall-normal velocity fluctuations are the principal drivers of wall-pressure fluctuations (see Jaiswal et al. (Reference Jaiswal, Moreau, Avallone, Ragni and Pröbsting2020), for instance). Therefore, the latter can be used as a source term in the causality study. Pearson's correlation coefficient  $R_{u'_2p_a'}(\boldsymbol {x},t)$ is then defined as
 \begin{equation} R_{u'_2 p_a^{\prime}}(\boldsymbol{x},t) = \frac{\overline{u^{\prime}_2(\boldsymbol{x},t) p_a^{\prime}(\boldsymbol{x},t+t_f)}}{\overline{u^{\prime}_2(\boldsymbol{x},t)} \times \overline{p_a^{\prime}(\boldsymbol{x},t+t_f)}},\end{equation}
where  $t_f$ is the time of flight or the time taken by the acoustic disturbances to arrive at the far-field microphone location, and
 $\overline {u^{\prime }_2(\boldsymbol {x},t)}$ is the standard deviation of the wall-normal velocity. Finally,
 $p_a'$ is the far-field acoustic pressure, which is recorded using a single microphone placed normal to the aerofoil at midspan (see figure 3).
Figure 18 shows Pearson's correlation coefficient that is referred to as the causality correlation from now on, as it relates the cause and effect of the noise. The causality correlation  $R_{u'_2p_a'}(\boldsymbol {x},t)$ shows several regions of negative and positive correlation regions/lobes. These lobes of negative and positive correlation extend beyond the boundary-layer thickness, and are reminiscent of the Kelvin–Helmholtz modal shape identified numerically by Sanjose et al. (Reference Sanjose, Towne, Jaiswal, Moreau, Lele and Mann2019), who performed a spectral POD analysis.
Causality analysis between the near-field wall-normal velocity fluctuations and the far-field acoustic pressure: (a) causality correlation  $R_{u'_2 p_a^{\prime }}(\boldsymbol {x},t)$; (b) cross-power spectral density of the causality correlation
 $S_{u'_2p_a'}$.

The highest value of the correlation is achieved slightly upstream of the trailing edge. This is expected because the trailing-edge noise is caused by the scattering of vortices at the trailing edge (Howe Reference Howe1978; Roger & Moreau Reference Roger and Moreau2005). Furthermore, the maximum correlation coefficient between the upwash velocity and the far-field acoustic disturbance is negative, implying a negative phase between the two quantities. The distance between the negative and positive lobes of value  $R_{u'_2p_a'}(\boldsymbol {x},t)$ is equal to half the wavelength of the principal tone frequency. In order to determine the wavelength of the principal tone frequency, the convection speed near the trailing edge is calculated. This is done using the time resolved wall-pressure data. The relation between spacing of the correlation pattern and principal tone frequency becomes more obvious if one moves to the Fourier domain. The absolute value of Fourier transform of the causality correlation (
 $S_{u'_2p_a'}$) is plotted against frequency in figure 18(b). A peak at the principal tone frequency reinforces the relation between principal tone frequency and spacing of the correlation pattern. Since in the present case the Kelvin–Helmholtz modal pattern is obtained using causality correlation, it can be unambiguously concluded that the Kelvin–Helmholtz-type instability is responsible for the present acoustic feedback loop, yielding the sharp intermittent aerofoil tonal noise.
In stark contrast to the patterns seen on the suction side, no discernible pattern can be seen on the pressure side of the aerofoil from the  $R_{u'_2p_a'}(\boldsymbol {x},t)$ plot. As a word of caution to the reader, slightly higher values of
 $R_{u'_2p_a'}(\boldsymbol {x},t)$ on the pressure side are an artefact of dividing
 $R_{u'_2p_a'}(\boldsymbol {x},t)$ by close to zero values of
 $u'_2$, as shown in figure 11(d). Thus, it can be concluded that the pressure-side events do not participate in the far-field acoustic tone generation. Desquesnes et al. (Reference Desquesnes, Terracol and Sagaut2007) had hypothesised that the amplitude modulation in far-field pressure fluctuations can be attributed to the coupling between the suction- and pressure-side disturbances. However, the pressure side of the CD aerofoil at this particular flow condition is not only laminar (figure 11) but also does not correlate with far-field acoustic pressure (figure 18). Therefore, the coupling between pressure- and suction-side disturbances is not a necessary condition for amplitude modulation, as already stated by Pröbsting (Reference Pröbsting2015) for the NACA-0012 aerofoil. This has also been recently confirmed by a global stability analysis on two different aerofoils including the present CD aerofoil by Wu et al. (Reference Wu, Sandberg and Moreau2021). Furthermore, the phase locking between near-field sources and the far-field acoustic pressure causes periodic shedding of coherent structures from the LSB (Pröbsting Reference Pröbsting2015). Therefore, plotting the two-point correlation of the wall-normal velocity fluctuations (figure 19) produces the same pattern of negative and positive regions. Figure 19 also suggests that the aerofoil tones are the result of a two-dimensional instability mode, which is the goal of the next section.
Two-point wall-normal velocity correlation for a fixed point located 1 mm from the wall at RMP  ${22}$.

7. Proper orthogonal decomposition
To unravel the modes of the flow present in such a self-sustained oscillating flow, POD has been used. One of the advantages of POD over linear stability studies employed in the past (see McAlpine (Reference McAlpine1997), for instance) is that, unlike the latter, POD does not invoke the restrictive assumption of linearity or any assumptions on the magnitude of the disturbances. In the present study, POD has been performed using the method of snapshots algorithm developed by Sirovich (Reference Sirovich1987). The reader is referred to Holmes et al.'s (Reference Holmes, Lumley, Berkooz and Rowley2012) monograph for details. For the planar PIV case, 800 snapshots of synchronised microphone-PIV measurements have been recorded and processed. The in-house POD algorithm was implemented in Matlab. To validate and test its robustness, the POD results are compared with that obtained using DAVIS (Lavision's commercial software) in figure 20. An excellent agreement between the energy content of these two implementations for the first 100 modes can be seen.
Cumulative energy of the first 100 modes.

Figure 20 shows that the first 15 modes account for approximately  $60\,\%$ of the total kinetic energy. To reveal the spanwise behaviour of the POD modes, the Tomo-PIV data have been used. To get a complete three-dimensional picture, 800 snapshots from the Tomo-PIV measurements have been used for the POD analysis. The cumulative energy distributions of the modes from the Tomo-PIV measurements are also shown in figure 20. It can be noticed that, for the same flow, the cumulative energy distribution is lower compared with the planar PIV. This is not surprising because the flow appears to be homogeneous in the spanwise direction (see figure 19). To quantify the turbulence kinetic energy of homogeneous turbulence, a large number of modes is required (see Glegg & Devenport (Reference Glegg and Devenport2001), for instance). However, planar PIV measurements have been done uniquely in the wall-normal direction, where the turbulence is inhomogeneous due to the wall blocking (Jaiswal et al. Reference Jaiswal, Moreau, Avallone, Ragni and Pröbsting2020). Consequently, in Tomo-PIV measurements, a higher number of modes is required to quantify the turbulence kinetic energy compared with the planar PIV case.
Figures 21 and 22 show the first eight modes of the wall-normal velocity fluctuations. The modes of the wall-normal velocity fluctuations are especially useful because the wall-normal velocity fluctuations are directly linked to trailing-edge noise compared with wall-parallel velocity fluctuations (Jaiswal et al. Reference Jaiswal, Moreau, Avallone, Ragni and Pröbsting2020). In figure 21 we can clearly see that the modes  $\varPhi ^{2}_3$ and
 $\varPhi ^{2}_4$ form modal pairs since they are almost perpendicular to each other and they contain almost equal energy. These modes are not perfectly orthogonal because they are affected by the stochastic nature of turbulence. The modal shape is similar to what was obtained from causality correlation analysis in figure 18(a). Furthermore, the wavelength of these modes (
 $\varPhi ^{2}_3$ and
 $\varPhi ^{2}_4$) is equal to the principal tone frequency, which classifies them as normal modes. It is interesting to note in the present case that the normal modes of aerofoil tones are not the most energetic ones.
Wall-normal component of the POD spatial eigenfunctions  $\varPhi ^{2}_i$ in the
 $x_1$-
 $x_2$ plane: (a) mode
 $\varPhi ^{2}_1$; (b) mode
 $\varPhi ^{2}_2$ ; (c) mode
 $\varPhi ^{2}_3$ ; (d) mode
 $\varPhi ^{2}_4$.

Wall-normal component of the POD spatial eigenfunctions  $\varPhi ^{2}_i$ on the
 $x_1$-
 $x_2$ plane: (a) mode
 $\varPhi ^{2}_5$; (b) mode
 $\varPhi ^{2}_6$ ; (c) mode
 $\varPhi ^{2}_7$; (d) mode
 $\varPhi ^{2}_8$.

The POD modes from Tomo-PIV data are plotted in figure 23, which shows that the first modal pair ( $3$ and
 $4$) is essentially two-dimensional. These modes appear to be the trace of the main two-dimensional rollers seen in figures 14 and 19. Furthermore, these modes are present throughout the measurement volume, i.e. until the near wake region. Modes 6 and 7 appear to be a result of spanwise modulation of modes 3 and 4, respectively. The two-dimensionality of these tonal noise modes (modes 3 and 4) suggests any changes in the boundary condition along the span of the aerofoil will mitigate the aerofoil tone. Indeed, reduction in tone amplitude was reported in the experimental investigation of Moreau et al. (Reference Moreau, Laffay, Idier and Atalla2016), who used a modular aerofoil instead of a single-block aerofoil. The gap or the kapton film at the junctions created the spanwise disruption in this case.
Wall-normal component of the convective POD spatial eigenfunctions (a)  $\varPhi ^{2}_3$ and (b)
 $\varPhi ^{2}_6$ in the Tomo-PIV volume. The amplitudes have been normalised by the maximum value of the spatial eigenfunctions.

At this point, it is instructive to compare the present case with the one where the LSB is excited externally. For example, Kurelek et al. (Reference Kurelek, Kotsonis and Yarusevych2018) found significant changes in the LSB length and boundary-layer transition when the flow is exited externally with acoustic disturbances. Furthermore, Kurelek et al. (Reference Kurelek, Kotsonis and Yarusevych2018) also performed a POD analysis, and the two modal pairs they obtained look very similar to the present case. The only difference being the order of the modal pairs and their energy content, both of which are higher in Kurelek et al.'s (Reference Kurelek, Kotsonis and Yarusevych2018) study. Another important distinction between the present study and that of Kurelek et al. (Reference Kurelek, Kotsonis and Yarusevych2018) and Michelis et al. (Reference Michelis, Kotsonis and Yarusevych2018a) is that, unlike in Kurelek et al. (Reference Kurelek, Kotsonis and Yarusevych2018) and Michelis et al. (Reference Michelis, Kotsonis and Yarusevych2018a), no irregular modulation of disturbances (modes 6 and 7) in the spanwise direction is observed. This regular spanwise modulation also implies that a single geometrical discontinuity in span will not be enough to completely suppress the acoustic tones, again corroborating the findings of Moreau et al. (Reference Moreau, Laffay, Idier and Atalla2016).
As a LSB is subjected to natural and periodic excitation, a variation in its streamwise and spanwise wavelength is observed (Michelis et al. Reference Michelis, Kotsonis and Yarusevych2018a). Michelis et al. (Reference Michelis, Kotsonis and Yarusevych2018a) also found that, when vortex shedding is locked to the excitation frequency, spanwise deformations diminish and the structures break up further downstream. Given that in the present case the CD aerofoil generates tonal noise that has an amplitude and a frequency modulation, the spanwise modulation of the disturbance (modes 6 and 7) can be most likely linked to the observed modulation amplitude of the tonal noise. This is also consistent with Amiet's model and its extension (Amiet Reference Amiet1976; Roger & Moreau Reference Roger and Moreau2005) that show that the far-field acoustic spectra are directly proportional to the spanwise correlation length of the wall-pressure fluctuations, and justifies the good agreement reported by Moreau & Roger (Reference Moreau and Roger2009) for a similar flow regime with tonal noise (see figure 9 and the case at  $-5^{\circ }$ in figure 15(a) in Moreau & Roger Reference Moreau and Roger2009).
8. Conclusion
A comprehensive experimental investigation of aerofoil tones has been carried out for a CD aerofoil at low Mach number of  $0.05$ and low-to-moderate Reynolds number (based on chord) of
 $1.4 \times 10^{5}$ at a low geometrical angle of attack of 5
 $^{\circ }$, for which intermittent tonal noise had been reported previously. Microphones have been used to quantify near-field wall-pressure noise sources and far-field acoustic pressure. Synchronised detailed flow measurements using planar and Tomo-PIV have been performed to yield the velocity field.
Large parts of the aerofoil chord and span exhibit high correlations of wall-pressure fluctuations with strong peaks in the auto-spectra at the tonal noise frequency (at least 10 dB above the broadband noise level). The resonance and the causality implied by these wall-pressure measurements also establish the existence of an acoustic feedback loop. Indeed, for the remote microphone probes separated by a significant geometrical distance, disturbances travel upstream at near sonic speeds ( $\sim$ Mach 1), giving compelling evidence for the presence of acoustic feedback. Furthermore, these acoustic disturbances can travel far upstream to locations near the leading edge and persist even in the presence of a favourable pressure gradient. This does not support the hypothesis of Arbey & Bataille (Reference Arbey and Bataille1983) that the acoustic feedback loop will be closer to the aerofoil mid-chord. Nevertheless, it is consistent with the analytical works of Goldstein (Reference Goldstein1983) and the recent experimental evidence provided by Pröbsting & Yarusevych (Reference Pröbsting and Yarusevych2021) in that acoustic disturbances travelling upstream enter the leading-edge region of the aerofoil.
The pressure side of the CD aerofoil is not only laminar (figure 11) but also does not exhibit any coherent structure correlated with the far-field acoustic pressure (figure 18). Therefore, the coupling between pressure- and suction-side disturbances is not a necessary condition for amplitude modulation, as already stated by Pröbsting (Reference Pröbsting2015) for the NACA-0012 aerofoil and found by a global stability analysis on two different aerofoils by Wu et al. (Reference Wu, Sandberg and Moreau2021). Therefore, amplitude modulation requires neither a communication between the two sides of the aerofoil nor a transition to turbulence on the pressure side, the latter argument being used by Pröbsting (Reference Pröbsting2015) to negate Reference Desquesnes, Terracol and SagautDesquesnes et al.'s hypothesis.
The far-field acoustic signals analysed with wavelet transform show that far-field acoustic disturbances undergo significant amplitude and frequency modulation. The acoustic measurements corroborate the findings of Desquesnes et al. (Reference Desquesnes, Terracol and Sagaut2007), Padois et al. (Reference Padois, Laffay, Idier and Moreau2016), Yakhina (Reference Yakhina2017) and Pröbsting (Reference Pröbsting2015). Pearson's causality correlation was calculated between near-field wall-normal velocity fluctuations and far-field acoustic measurements, and gives rise to the Kelvin–Helmholtz-type modal structure. Furthermore, large two-dimensional roller structures reminiscent of a Kelvin–Helmholtz-type instability are also seen, confirming most of the findings of the three-dimensional DNS by Sanjose et al. (Reference Sanjose, Towne, Jaiswal, Moreau, Lele and Mann2019). POD analysis shows that these flow structures are the most dominant convective modes having two-dimensional patterns. Compared with forced cases (Kurelek et al. Reference Kurelek, Kotsonis and Yarusevych2018; Michelis et al. Reference Michelis, Kotsonis and Yarusevych2018a), the convective POD modes have lower energy content. Higher convective modes (modes 6 and 7 in the present case) appear to be a result of spanwise modulation of the dominant convective modes. Compared with the forced cases (Kurelek et al. Reference Kurelek, Kotsonis and Yarusevych2018; Michelis et al. Reference Michelis, Kotsonis and Yarusevych2018a) the modulation of disturbances appears to be more regular. This modal structure can explain why, when using a modular aerofoil, Moreau et al. (Reference Moreau, Laffay, Idier and Atalla2016) measured a reduction in aerofoil tonal noise magnitude and not a total elimination of aerofoil tones. This also confirms that two-dimensional simulations cannot fully assess the main features of aerofoil tones, as suggested by Tam & Ju (Reference Tam and Ju2012) and de Pando et al. (Reference de Pando, Schmid and Sipp2014). Trailing-edge serrations or liner-type porous appendages both create modulations in span, and have been successfully used to mitigate aerofoil tones in the past (Moreau et al. Reference Moreau, Laffay, Idier and Atalla2016; Gelot & Kim Reference Gelot and Kim2020).
Acknowledgements
The authors would like to acknowledge the help of Y. Fang and B. Dignou during the PIV measurements. They also acknowledge the help and support of Lavision Inc. for providing the Evergreen laser, which was used in the synchronised PIV measurements. Vector computations for Tomo-PIV measurements were made on the supercomputer Graham, managed by Compute Canada.
Funding
This work was supported by the Canadian NSERC Discovery grant (no.RGPIN-2014-04111).
Declaration of interests
The authors report no conflict of interest.
Data availability statement
Raw data of Tomo-PIV were processed at the Compute Canada's HPC center. Derived data supporting the findings of this study are available from the first author upon reasonable request.



