Population monitoring is an important part of responding to a nuclear or radiological emergency. 1 While much progress has been made in radiological and nuclear planning, little data has been collected on how long it will take to process a large population through a community reception center (CRC), 1 also known as reception centers for nuclear power plant exercises. 2 The process of population monitoring activities has many stations. This study focused on main stations used for contamination screening, decontamination, and registration of individuals who arrive at the CRC. According to radiological emergency response plans, people affected by the radiation incident will be sent (or directed) to CRCs for screening and decontamination. Individuals potentially affected by the incident could also be directed to go home to a mass care shelter or a hospital. CRCs, when established, will likely help alleviate the burden on hospitals and other emergency medical systems in that they can screen and decontaminate large populations thus allowing hospitals to focus on triage and treatment of those who may be critically injured or require immediate medical attention.
CRC operations are resource intensive. To effectively manage scarce resources (both staff and radiation detection equipment), realistic estimates of screening capacity for CRCs and potential solutions to address bottlenecks are necessary. Current screening capacity predictions are based on detector response times, specifically portal monitor screening times, 3–6 simplified throughput equations, or best estimates from subject matter experts. These methods do not account for the human factors of both staff and individuals arriving at the CRC as well as impact of stations beyond the initial contamination screening station. For these reasons, the US Centers for Disease Control and Prevention (CDC) began assisting state and local communities, which includes public health departments, emergency management agencies, and others, in the planning, and execution of functional exercises where timing data collection would be a priority. As a result of these efforts, timing data from 11 exercise sites were collected and evaluated to create timing data sets. These timing data in turn were compared to expected values based on current guidance and subject matter expert assumptions. Having timing data that reflects realistic service times for population monitoring is vital to calculate anticipated throughput at CRCs, and key to creating a model for planners to evaluate their response capacity.
Methods and materials
From 2016 to 2019, the CDC collected service time data observations from 11 exercises across the country. 6 of the exercises were performed by Radiation Emergency Preparedness (REP) 2 communities, which are routinely evaluated for nuclear power plant exercises. The remaining 5 communities are not part of the REP program but have CRC plans for response to nuclear and radiological emergencies, thus, are not required to exercise, nor be evaluated on a scheduled basis. Each community exercised their current plans and performed their just-in-time training as they would for a real event.
To assure that the service time data collected would be a representative sample size of each station at the exercise, all communities were asked to have at least 20 individuals move through the stations. Many of the communities had 40 or more individuals move through the CRC.8 of the exercises included the use of actor cards from the CRC drill toolkit, 7 and involved integration of mental and behavior health needs, translation assistance, mobility assistance, and persons with pets.
Assumptions
It was assumed that all staff performed their duties as they would in a real event. As with any exercise or real event, staff experience and training will vary. Deviation from perfect proper procedures were made by all types of staff, therefore, all were deemed to be true, and realistic to how the process would be conducted in a real event. Staff fatigue was assumed and accounted for, as exercises spanned 6 - 8 hours including set-up and tear-down times. CRC operations were performed for 2-4 hours.
Timing data collection process and analysis
This study employed the time-and-motion technique for observations, which uses timekeepers to record how long each task takes to perform. Reference Finkler, Knickman, Hendrickson, Lipkin and Thompson8 Just-in-time training and documentation for timing data collection were developed to ensure that all exercises used the same procedure. 9 Paper forms and stopwatch to record start and stop times were used on site, the information was then transferred to an electronic database to compile and aggregate the collected times. Timing forms were then collected, and the raw data were input into this database and used to calculate minimum, average, and maximum service times. These data were calculated for the aggregate station service time data across all exercises. To ensure confidentiality, location specific exercise data is not presented in this paper. Detailed descriptions of what activities were included at each station are provided in the following sections along with variation in processes. Service times were considered complete when the individual completed a station process and moved to the next station. An example of how a participant would move through each station is shown in the CRC Flow Diagram (Figure 1). Prior to performing analysis, each exercise data set was screened for potential errors due to incorrect timekeeper notation. Incorrect data includes incomplete times or times where the start time was later than the stop time. As part of data quality control/assurance, observations deemed incorrect were removed from this study (∼150 observations out of 2532 of total observations or approximately 6%).
Flow diagram of population processing at community reception center exercises.

Stations exercised and their processes
Contamination screening
Service times for both portal monitor and handheld radiation detection instrument (meter) screening were collected.
Portal monitor service times include the time it took an individual to approach the portal when directed by a staff member, the equipment response time to deem whether the individual is contaminated, and the time lapse for the interaction following exiting the portal monitor, which might include directions to the next station and answering questions from the individual. To ensure consistency throughout the process, markers were placed on the floor before entering and upon exiting the portal monitor, and timekeepers were instructed to use these markings to record start and stop times.
Handheld screening service times were collected for 2 cases: partial and full body screening. Partial body screening was simulated using a handheld meter to monitor only the head, hands, feet, and shoulders. 4 Full body screening covered the use of the handheld meter for the entire surface area of the individual. In both types of handheld screening, service times included instructing the individual to walk to the next available screener, completing the entire screening process, completing the documentation that went along with screening procedures, and ended when the individual was given information on where the contamination was found, and instructions to proceed to the next station.
Decontamination
The goal of decontamination is to remove as much of the external contamination as possible. Service times were collected for 2 types of decontamination: partial and full body. For partial decontamination, individuals were instructed to wash at the sinks using soap and water. The participants were to wash their face, arms (if the skin was bare), and hands. The service times recorded included the process of instructing the individual on how to self-decontaminate, followed by the proper process of decontamination, drying off, and giving instructions to move to post-decontamination screening.
Full body decontamination was defined when the individual was required to take a shower. All individuals wore bathing suits under their clothes so that the process of undressing and redressing could be included in the timing collection. Showers ranged from permanent showers in schools, decontamination tents with shower heads, and firetrucks that had shower nozzles. The full body decontamination service time recorded included the process of instructing the individual on how to self-decontaminate, showering, drying off, and re-dressing. They were then instructed to move to the handheld screening station for post-decontamination screening.
Registration
The registration process varied the most among all exercises. Data collection methods for registration included paper forms, and electronic via computer or tablet. The amount of information collected ranged from minimal contact information to 10 pages of an epidemiological survey. Service times for registration included an individual being directed to the next available registration table, completion of the registration form, and answering any additional questions. Often, CRC plans have registration as the last station and individuals are either discharged to a shelter, to their home, to a hospital, or another designated location.
Current throughput estimates and service times assumptions
Throughput estimates for population monitoring are currently based on limited exercise measurements or educated guesses from nuclear power plant exercises that only focus on the contamination screening station. Current guidance states that the estimated throughput calculations are based on the average time (hours),
3
 $\bar T$
, for 6 individuals to pass through a portal monitor that is then used to calculate hourly throughput as seen in the following equation. Usually, no more than 6 individuals are timed.
 $$Hourly\;Throughput = {1 \over {\bar T}}$$
Since these are based on detector response times, calculated screening times, or extremely limited time measurements, this approach does not consider human factors. Calculated screening times for handheld detectors are derived from knowledge of the target threshold for contamination and scanning area of the probe but are not included in throughput estimates. 4
Ethics
This study was determined to not be a human subject research and, not to require Internal Review Board review because observers did not interact with participants moving through the exercise. No personal identifiable information was collected. Time motion observations included solely start and stop times for participants entering and exiting each station. At each exercise, all staff, observers, and volunteers signed consent waivers to participate in the exercise.
This activity was reviewed by CDC and was conducted consistent with applicable federal law and CDC policy.Footnote ii
Results
Raw timing data were aggregated across all exercises and recorded in minutes and seconds (Table 1). Observations from each station are included in the discussion to provide insight on what might have affected service times.
Summary of station service times collected (minutes: seconds)

* Screening time used for calculated average throughput per portal monitor. This yields a throughput of 600 people per hour per monitor. 3
+ Percent difference of average observed exercise times from guidance times. Negative values represent percent lower than guidance value.
c 267% corresponds to the difference of 22 seconds from the 6 seconds standard used by jurisdictions when calculating throughput so it was chosen as the comparison.
d Calculated total time to screen 1 person for contamination over their whole body. This is based on the average surface area of a reference man, area of the detector probe used for screening, and the speed at which the detector will respond to a certain level of contaminated material. 4
e Calculated time to screen hands, face, feet, and shoulders which is estimated to be 20% the surface area of the total body. The service time is 20% of the full body screening time. 4
Contamination screening
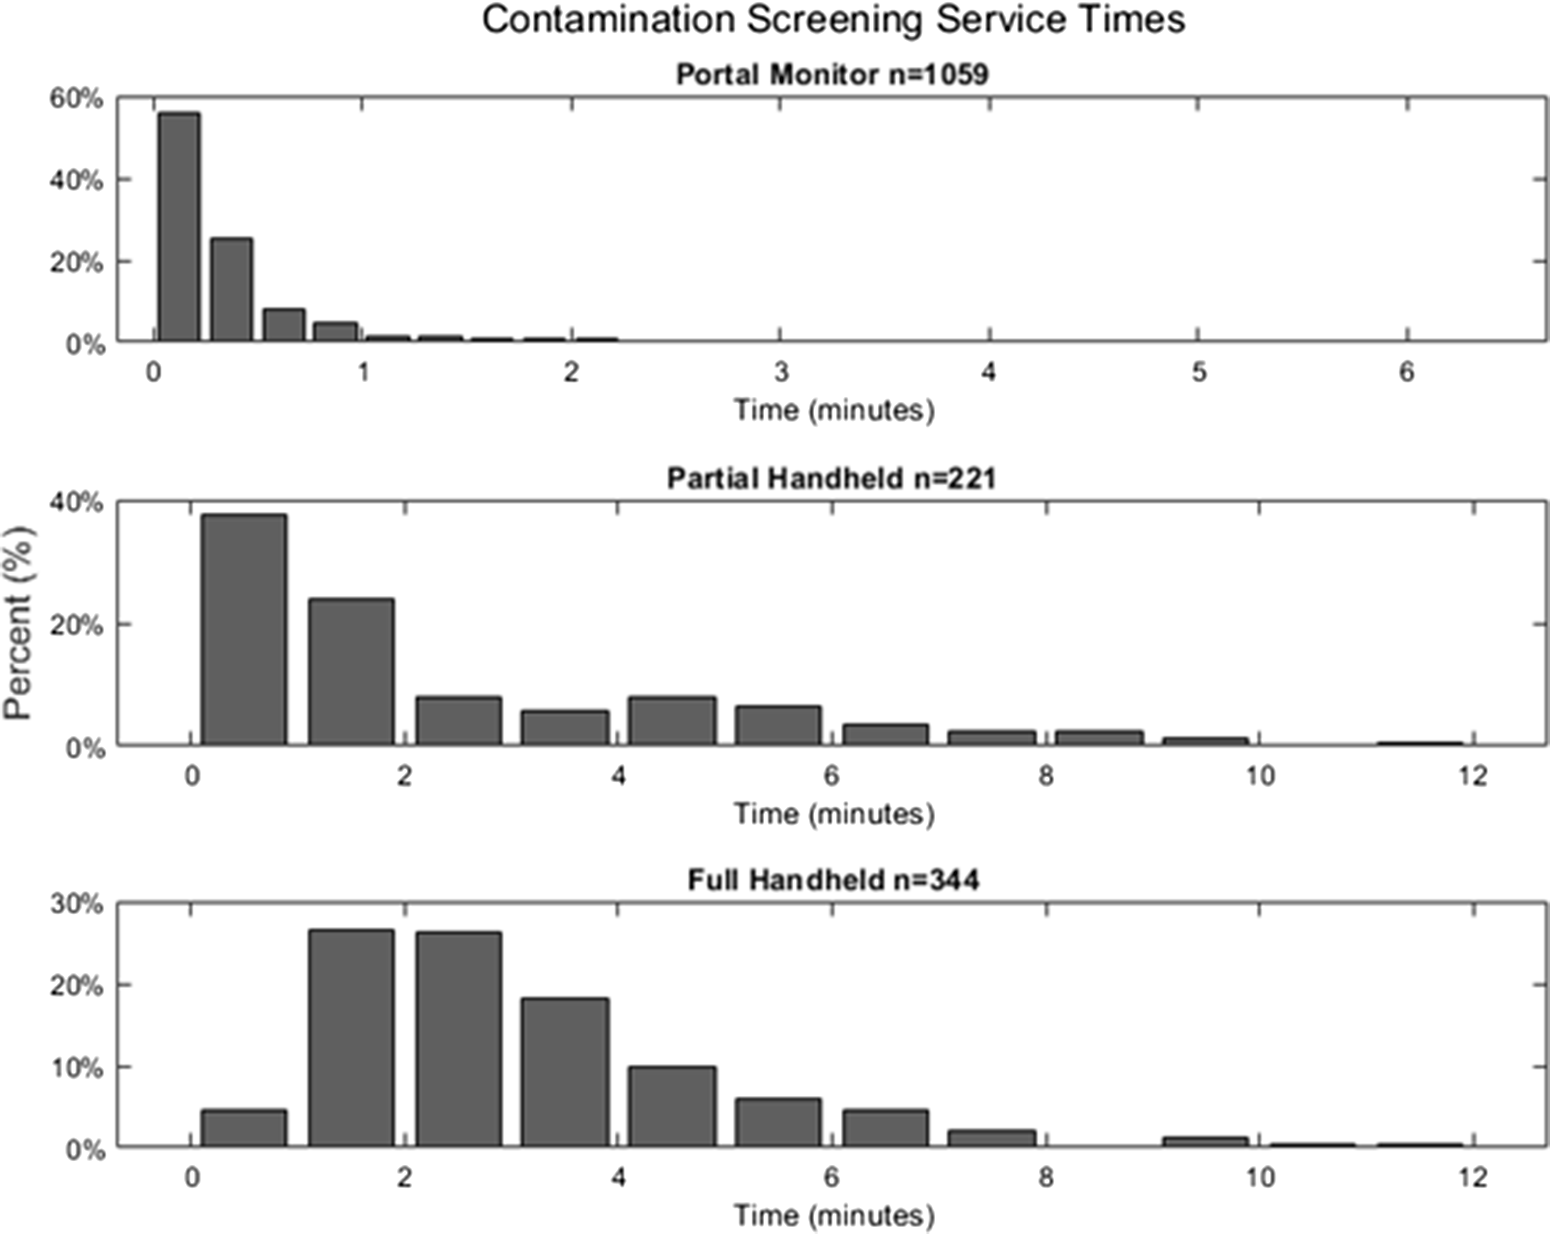
Due to differences in equipment and their associated procedures, service times for contamination screening methods are separated into those using a portal monitor and those using handheld screening methods. A more detailed breakdown of the station times is shown in Figure 2.
Percent distribution of service times for contamination screening stations, portal monitor n = 1059, partial handheld n = 221, and full handheld n = 344.

Portal monitor service times ranged from 2 seconds to 6 minutes 21 seconds, with an average service time of 22 seconds (n=1059). 20 of the 1059 observations were above 2 minutes, so a sensitivity analysis was performed by removing these observations and calculating the modified average service time. The modified average service time was found to be 20 seconds, which is only 9% less than the original average. Due to the insignificant change in the average and the realism of longer service times to represent those needing assistance, the 20 observations were kept in the data set.
Service times for full body handheld screening ranged from 32 seconds to 11 minutes 17 seconds, whereas the partial body handheld screening times ranged from 6 seconds to 11 minutes. The average time to perform full body screening was 3 minutes 9 seconds (n=344) and partial body screening was 2 minutes 27 seconds (n=221). It should be noted that the partial body screening is meant to cover only a portion of the body, roughly 20%, 4 which should have translated to significantly lower average screening times. The observed average partial body screening time was 78% of the average full body screening time meaning that the speed of scanning (surface area scanned per second) was slower for partial body screening.
Aggregate exercise data presented in this paper is compared with the current detector derived published estimates (Table 1). 3,4 Both average portal monitor and partial body handheld screening times were much longer than the times provided in guidance documents by267% and 213%, respectively. The average full body handheld screening times were 19% lower than the guidance value.
Decontamination
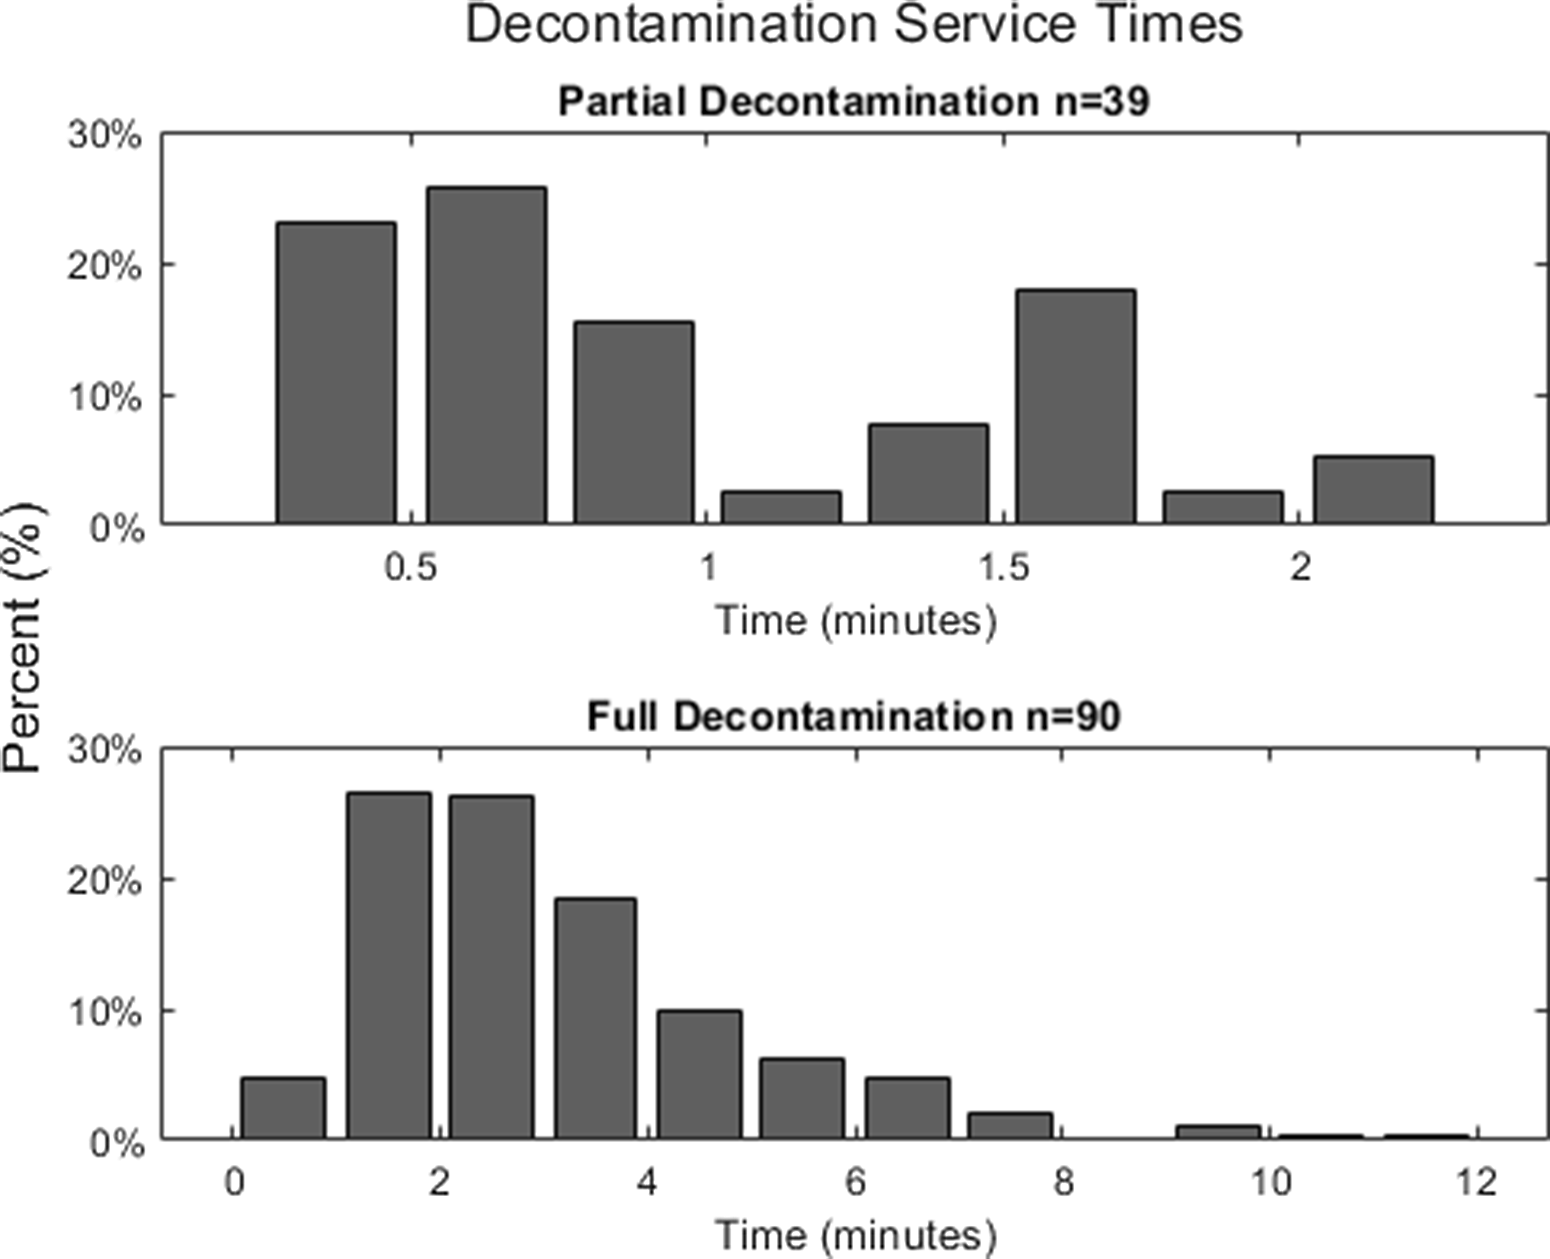
Service times for decontamination methods were considered separately for full body and partial body decontamination (Table 1). Full body decontamination times ranged from 29 seconds to 15 minutes 21 seconds, with an average time of 4 minutes 29 seconds (n=90). Service times for partial body decontamination ranged from 20 seconds to 2 minutes 12 seconds, with an average time of 58 seconds (n=40). The distribution of observations for partial decontamination had 2 peaks, while full body decontamination had 1 major peak (Figure 3). The partial body decontamination observations are more evenly spread but had the lowest number of observations per station. This distribution may change with additional observations.
Percent distribution of service times for decontamination stations, partial decontamination n = 39, full decontamination n = 90.

Registration
Service times for the registration process ranged from 15 seconds to 33 minutes 14 seconds (Table 1). The average time to complete registration for an individual was 4 minutes 57 seconds (n = 627).
Paper vs electronic
Due to the difference in delivery method, time to complete registration using paper forms and electronic registration have been separated for comparison (Figure 4).
Percent distribution of registration service times, electronic data collection n = 527, paper form collection n = 101.

Paper forms took on average, 7 minutes 22 seconds (n = 101), while electronic registration took 4 minutes and 29 seconds (n = 527). Most service times for both registration methods were under 10 minutes but each type of registration had observations that were significantly longer with paper registration taking a maximum of 22 minutes and 1 second, and electronic registration taking a maximum of 33 minutes and 14 seconds.
Throughput estimates with exercise times
The average portal monitor service time was used to calculate the CRC throughput estimate for 1 portal monitor based on current FEMA guidance. Using exercise data, the estimated throughput time is approximately 164 people per hour. The throughput estimate using current guidance estimates 3 is 600 people per hour, which is 3.6 times the estimate using observed exercise times.
Discussion
Summary findings from the 11 CRC exercises illustrated that service times associated with population monitoring activities often range widely depending on many factors. It was observed that large scale radiological exercises require many resources and can be difficult to perform. Hence, process times will likely reflect the incident scenario. Large scale time motion studies designed to evaluate the true CRC station processing times during a radiological emergency are not found in the scientific literature. Reference Kramer, Johnson, Hauck, Capello and Quayle10 Previous studies only conducted small scale observational studies or focused on batch processing of persons who pass through portal monitors. Reference Li, Capello, Jeng, Hauck and Kramer11
This study focused on time motion observations at CRC stations to gather data for modeling realistic service times. All observations and data points were weighted equally. In a real emergency it is very likely that there will be additional, intervening factors that influence actual time, including a range of staff experience and abilities, differences in needs and behavior of the arriving population, etc. To account for these and other factors, collected time data are aggregated into a larger data set for use in model development which is not discussed in this paper. By providing aggregate versus site specific data, this study could be more applicable at other locations in the United States.
A summary discussion of the observations for each station is provided below:
Contamination screening
Portal monitor
Portal monitor processing times increased when participants in wheelchairs had difficulty or were unable to easily pass through the portal monitor frame, individuals became anxious upon hearing a portal alarm, or staff experienced equipment failures such as failure to register an individual when passing through the portal monitor. Portal processing time increased when individuals requested information from staff, required mental health assistance for anxiety, and required a translation or other type of assistance. As wait times increased, many individuals requested an explanation for the delay, as well as information regarding what to expect at each station and what happens if the portal monitor alarm sounds. Wait times also increased when more people were anxious, desired to reunite with or find their families, or required assistance from staff. Staff fatigue increased with time at-post, physical exhaustion from the day’s workload, and mental stress from a plethora of anxious persons with multiple requests and questions. Staff fatigue often resulted in people receiving less information and staff support as the workday progressed.
Handheld screening
Some staff using handheld instruments stopped screening once they discovered an individual was contaminated. Shorter screening times were also a result of staff moving the detector probe faster than recommended which would result in a decreased level of detection sensitivity. Longer screening times occurred when potentially contaminated areas needed to be rescreened, individuals did not understand or follow staff instructions, and people had personal belongings or equipment that also needed screening. Some staff reported difficulty reading the detector measurements due to small text or tic marks and completing contamination forms, while others were very cautious and processed people at a much slower rate than recommended. Staff operating handheld detectors commented that their arms and back began to ache after a few hours of operation, indicating that CRC shifts should organize rest periods and take other measures to prevent physical injury.
Screening technique and speed deviated among both new and experienced staff where years of experience did not necessitate proper use of detection equipment. Observed times presented in this study are likely realistic and representative of the actions performed during a simulated or real event. For staff who screened faster than the recommended training rate, this raised the contamination threshold because the speed at which the detector moves determines its sensitivity to find radioactive material. For example, a higher level of contamination would be required to trigger a detector alarm when scanning speed is increased beyond recommended levels. Controlling screening speed variances could likely be achieved by having an additional staff member monitor and note when screening speed and technique deviations occur, correcting the scanning speed, and thereby limiting the time staff incorrectly performs this task.
Decontamination
Full body decontamination
Service times were impacted by water temperature and type of decontamination method used. Colder or lukewarm water resulted in quicker shower times whereas showers with more comfortable water temperature resulted in longer shower times. Decontamination tents tended to have less privacy resulting in showers averaging faster throughput when compared to showers taken in locker rooms. Slip hazards for staff and individuals moving through the decontamination station occurred when water began to accumulate both from constant flow of showers, and steam in the enclosed shower areas. When someone slipped in a shower facility, activities had to pause. As the showers continued, temperatures in the decontamination areas and humidity increased, resulting in the earlier onset of staff fatigue than predicted.
Some exercise sites chose to include an identification form with the clothing and belongings of the contaminated individuals. The addition of the form increased processing times slightly.
Partial body decontamination
Even though there was less water flow at the partial decontamination station than at the full decontamination unit, slip hazards also developed as the exercises went on.
Potential reasons for the 2 distinct peaks of service times collected are that participants were washing themselves as quickly as possible as they might in normal circumstances, or they chose to be very meticulous leading to longer times. More timing data needs to be collected to determine if the peaks normalize into 1.
Registration
The main factor impacting variations in registration time was the length of the form (number of questions) used during the exercises. As bottlenecks grew at the registration stations, exercise directors chose to shorten the electronic and paper registration forms. Every exercise that utilized electronic data collection experienced either technical problems with equipment, software, or both; resulting in system inoperability and pausing service for some time. When faced with technical difficulties that could not be resolved, sites either chose to terminate registration activities or switch to paper forms.
Limitations
All timing data were collected at exercises and may not be representative of a real-world emergency. Exercises used volunteers to move through CRCs and incorporated actor cards to be as realistic as possible. Populations arriving at a CRC during an emergency are likely to be more distressed and require additional assistance or direction. Due to the pre-planned nature of exercises, staff had time to plan and train for the event, which means that they may have been more prepared than during an unplanned event. By not controlling for pre-planning bias, this limitation likely altered response times. Other exercise locations partially controlled this variable by providing staff with Just in Time training to mimic a real staff response during a radiation event. Staff did not wear full personal protective equipment (PPE) other than gloves and face mask. If additional levels of PPE were required, this may result in longer service times due to more limited mobility or the added stress of heat.
Actor cards include accommodation needs such as hearing and sight impairment as well as translation and mobility assistance. While many exercise locations were able to adequately assist the small numbers of those who required additional services, future time motion studies should include more variation in actors that depict representative needs and backgrounds of the arriving population. Additional consideration should be given for sites that had difficulty processing those in wheelchairs through portal monitors. There are newer models of portal monitors that may be more appropriate for screening those in wheelchairs or who need other mobility assistance. The registration station has the most variation with form length, type (paper vs. electronic), and collection method (interview versus self-fill). Different combinations of these factors should be exercised more to aid in the determination of which type of registration method might best suit varying levels of arriving populations and levels of contamination. Further examination of factors associated with decontamination strategies (e.g., washing time, water temperature, environmental conditions, real event individual frustrations, fear, and anxieties, etc.) likely furthered the timing analysis and conclusions for these stations. CRCs may have additional stations for biological sample collection, pet assessment, mental health counseling, and others; therefore service times need to be collected for all stations to effectively evaluate the contribution each added station has on potential capacity estimates and overall throughput time. Due to the complexity and interactions of multiple stations in the CRC, it may be more appropriate to model throughput by using each station’s time distribution versus the simplified equation that accounts for the initial and often fastest station, only.
Conclusions
Population monitoring is a key and resource intensive public health operation in the aftermath of a radiological emergency. Depending on the type of incident, the population that would require screening (either to assess contamination or to provide reassurance) will likely far exceed capacity of jurisdictions that have had little to no experience with exercising and planning for a radiological event. While current guidance provides technical estimates of potential throughput numbers and response times, it is imperative to continue to exercise and collect real data for service times at CRCs using larger sample sizes. These data present more realistic measurements of service times as it is aggregated over many states with varied levels of staff training and experience. Planners should be aware that CRC calculated throughput, based solely on current guidance, 3 will not account for the impact of additional stations following contamination screening. This approach will likely result in an overestimation of capacity, thus hindering the community’s ability to prepare for, and respond to a real event. Current guidance should therefore consider adding the real-world factors (such as persons needing assistance or requiring different amounts of time to decontaminate and be screened) into the proposed timing estimates that jurisdictions should follow.
The range of service times for each station illustrates the importance of incorporating human factors into service time and throughput estimates. The equipment response time should be considered as a minimum processing time, but not the average, when performing throughput calculations as it is only 1 part of a multi-station process. It is important to evaluate the entire CRC and each station’s service times as opposed to only evaluating 1 station such as with current guidance. 2 Using only 1 station to determine the overall response capacity will drastically overestimate the ability of the CRC to handle a large-scale radiological event. To account for the distribution of service times and to incorporate a more accurate wait time into throughput estimates for CRCs, the US Centers for Disease Control and Prevention has created a discrete event model and web-based simulation tool, CRC SimPLER, 12 for radiation planners and emergency managers to model and visualize how stations are used over time, identify where additional resources might be needed, and estimate overall capacity for their CRC plans. The CRC SimPLER will be discussed in a future paper.
Acknowledgements
We would like to thank NACCHO, the state and local participants, and all others who volunteered to allow us to collect time motion observations at their functional CRC exercises.
Disclaimer
The findings and conclusions in this report are those of the authors and do not necessarily represent the official position of the US Centers for Disease Control and Prevention (CDC).