

CHARACTERISTICS OF NEURONAL SOMATA IN SENSORY GANGLIA
Dorsal root ganglion (DRG) and trigeminal (TG) sensory neurons are the first relay in the somatosensory pathway for the transmission of pain signals from the periphery, including the skin and internal organs, to the brain (Willis and Coggeshall, Reference Willis and Coggeshall2004). As a result of the pseudounipolar structure of the sensory neuron, afferent spikes flowing through the peripheral branch of the axonal process can bypass the cell body, i.e. soma, and directly reach the central branch of the process and its terminals (Amir and Devor, Reference Amir and Devor2003a). Nevertheless, these neurons rely on afferent spike invasion into their somata for regulation (Amir and Devor, Reference Amir and Devor2003a). Spike invasion provides the necessary cues for sensory neurons to synthesize, transport and maintain optimal levels of ion channels, receptors and proteins at the peripheral and central terminals. The roles of somata in afferent signaling, however, are far from passive. In addition to responding afferent inputs, neuronal somata have been found to actively affect the signal getting into the spinal cord. During tetanic stimulation of afferent fibers, somatic spikes become delayed or distorted as the stimulation frequency approaches the refractory period of the soma. This results in the generation of extra spikes in the peripheral or central processes, thus disrupting the fidelity of signal transmission (Amir and Devor, Reference Amir and Devor2003b). Following injury, the somata in DRG neurons become spontaneously active and fire action potentials for a prolonged period of time (Liu et al., Reference Liu, Chung and Chung1999). The ectopic discharges in the somata are thought to trigger and maintain the sensitization in the spinal cord and underlie neuropathic pain generated after nerve injury (Liu et al., Reference Liu, Wall, Ben-Dor, Michaelis, Amir and Devor2000; Sukhotinsky et al., Reference Sukhotinsky, Ben-Dor, Raber and Devor2004; Devor, Reference Devor2009).
The somata of sensory neurons are densely packed in DRGs and TGs. However, they do not form morphologically defined synapses with one another. Each soma is tightly enwrapped by a layer of satellite glial cells (SGCs) (Pannese, Reference Pannese1981), which are often coupled with each other with gap junctions (Pannese et al., Reference Pannese, Ledda, Cherkas, Huang and Hanani2003; Huang et al., Reference Huang, Cherkas, Rosenthal and Hanani2005). Individual neuronal soma with its surrounding SGCs is enclosed by a connective tissue sheath and form a functional unit (Hanani, Reference Hanani2005). A lack of synaptic contacts among neuronal somata together with the close apposition between neurons and surrounding SGCs suggests that bidirectional neuron–SGC communication may have an essential role in afferent signaling. It is therefore of great interest to understand how the soma in a neuron communicates with surrounding SGCs, how SGCs influence neuronal activity and how changes in the communication under injurious conditions contribute to ecotopic discharge of sensory neurons and production of chronic pain.
ATP IS THE MAJOR FAST-ACTING TRANSMITTER RELEASED FROM THE SOMATA OF SENSORY NEURONS
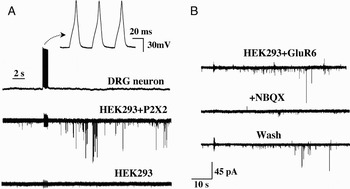
Neurons communicate with each other and with glia through the release of transmitters. In response to KCl depolarization or capsaicin stimulation, neuropeptides, such as substance P (SP) and calcitonin gene-related peptide (CGRP) have been found to be released from cultured DRG and TG neuronal preparations, which contain neuronal cell bodies as well as neurites (Mason et al., Reference Mason, Peterfreund, Sawchenko, Corrigan, Rivier and Vale1984; Hingtgen and Vasko, Reference Hingtgen and Vasko1994). To determine whether neuronal somatic release indeed occurs, we used DRG preparations devoid of neurites and combined membrane capacitance and intracellular Ca2+ dye measurements to show that the somata of DRG neurons undergo robust Ca2+-dependent exocytosis in response to membrane depolarization (Huang and Neher, Reference Huang and Neher1996). Ca2+-independent exocytosis was later found to also occur in the same preparation (Zhang and Zhou, Reference Zhang and Zhou2002). Using the single-cell immunoblot technique, we further showed that SP is released from individual neuronal somata (Huang and Neher, Reference Huang and Neher1996). Radioimmunoassay of SP or CGRP released from neuron-enriched cultured TG cells (Matsuka et al., Reference Matsuka, Neubert, Maidment and Spigelman2001) or TG slices (Ulrich-Lai et al., Reference Ulrich-Lai, Flores, Harding-Rose, Goodis and Hargreaves2001) confirmed the conclusion by showing that a substantial portion of the neuropeptide release is from the somata of sensory neurons. Because most peptides function as modulators of neuronal transmission, it is important to determine whether fast acting neurotransmitters such as ATP or glutamate are released from neuronal somata and whether they are directly involved in the neuron–SGC communication in sensory ganglia. ATP was found to be released from pre-myelinated axons of cultured DRG neurons (Stevens and Fields, Reference Stevens and Fields2000; Ishibashi et al., Reference Ishibashi, Dakin, Stevens, Lee, Kozlov and Stewart2006) and co-released with SP from acutedly dissociated TG neurons (Matsuka et al., Reference Matsuka, Neubert, Maidment and Spigelman2001). We used the sniffer patch recording method to test whether vesicular release of ATP or glutamate in fact takes place in the somata of DRG neurons (Zhang et al., Reference Zhang, Chen, Wang and Huang2007). The method consists of pulling an outside-out patch from an HEK cell that is overexpressed with purinergic P2X2R-EGFP or glutamatergic GluR6-EGFP receptors and pressing it onto the surface of the soma of a DRG neuron. The expressed receptors on the HEK cell patch then become the biosensors that detect the release of ATP or glutamate (Fig. 1). Following electric stimulation of the somata of DRG neurons, miniature excitatory postsynaptic current (mEPSC)-like activity can be detected by the sniffer pipette, thus suggesting that ATP or glutamate is vesicularly released. Because of the abundance and robustness of ATP release, it has been studied in great detail (Zhang et al., Reference Zhang, Chen, Wang and Huang2007). The identification of ATP as the released substance is further substantiated by the observations that mEPSC-like activity disappears when ATP and ADP are degraded by the enzyme, apyrase or when the P2XR antagonist, PPADS, are applied (Zhang et al., Reference Zhang, Chen, Wang and Huang2007). The ATP release depends on the presence of external Ca2+ and the activation of L-type Ca2+ channels in neurons. With increased stimulus frequency, the release activity increases and the latency between the stimulus and release is shortened. The amplitude distribution of ATP release events can be fitted with multiple Gaussians of equally spaced peaks, further suggesting the quantal nature of the ATP release (Zhang et al., Reference Zhang, Chen, Wang and Huang2007).
Stimulation of DRG neurons evokes ATP or glutamate release. (A) (Upper) Examples of action potentials evoked in a DRG neuron by a current stimulus train under current clamp conditions. (Lower) Activation of the DRG neuron evoked mEPSC-like activity in a sniffer patch expressing P2X2-EGFP receptors and held at −80 mV. The same stimulus did not evoke any activity in another outside-out patch excised from a non-transfected HEK cell. Adapted from Zhang et al. (Reference Zhang, Chen, Wang and Huang2007) (Copyright © 2007 by National Academy of Sciences, USA). (B) Stimulation of another DRG neuron evoked mEPSC-like activity in a sniffer patch expressing GluR6-EGFP receptors. The activity was blocked by the application of the GluR antagonist, NBQX. The activity resumed when the antagonist was washed out.

NEURONAL SOMA COMMUNICATES WITH SGCs THROUGH SOMATIC RELEASE OF ATP
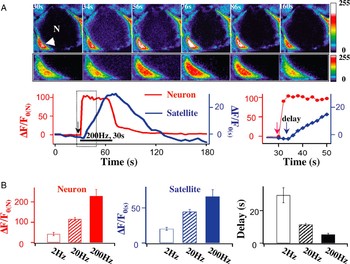
One of the likely functions of neuronal somatic release is to communicate with SGCs. Although there is a great deal of evidence that astrocytes and glial cells in the central nervous system (CNS) respond to synaptic inputs (Matsui and Jahr, Reference Matsui and Jahr2004; Wang et al., Reference Wang, Lou, Xu, Tian, Peng and Han2006), few have studied the direct activation of glial cells by neuronal somata. To establish direct neuron to SGC communication in sensory ganglia, it is essential to establish that SGCs surrounding the soma of a neuron respond to afferent nerve stimulation. A straightforward approach is to determine Ca2+ signaling between a neuron and surrounding SGCs in ganglia. When a Ca2+ dye, e.g. Fluo4, is loaded into DRGs, changes in intracellular Ca2+ ([Ca2+]i) in both the neuron and SGCs can be monitored simultaneously as afferent fibers of DRG neurons are electrically stimulated. Following nerve stimulation, the [Ca2+]i in the neuron invariably increases first; the [Ca2+]i in surrounding SGCs then increases with a delay (Fig. 2; Zhang et al., Reference Zhang, Chen, Wang and Huang2007). As stimulus frequency of afferent nerves increases, the magnitudes of [Ca2+]i in both the neuron and SGCs increase and the delay between Ca2+ signals is shortened. These observations suggest that the somata of sensory neurons indeed communicate with SGCs. Since the L-type Ca2+ channel blocker, nimodipine, completely blocks the [Ca2+]i increase in both the neuron and SGCs, activation of L-type Ca2+ channels in the neuron is essential for neuron–SGC communication (Zhang et al., Reference Zhang, Chen, Wang and Huang2007). Because apyrase abolishes the [Ca2+]i increase in SGCs, but had no effect on [Ca2+]i in the neuron, ATP is the major transmitter mediating the neuron–SGC communication (Zhang et al., Reference Zhang, Chen, Wang and Huang2007).
Neuronal somata communicate with SGCs. (A) (Upper) [Ca2+]i responses in a neuron (N) and in one of the SGCs surrounding the soma (arrow) following afferent nerve fiber stimulation (200 Hz, 30 s). The time at which the image was taken is indicated by the number at the upper left corner in each frame. Enlarged views of the SGC are shown directly below. Color-coded intensity calibration bar is shown on the right. A different color-coded calibration is used in the enlarged view to highlight the fluorescence change in the SGC. Neuron diameter = 19.3 µm. (Lower) Time courses of the [Ca2+]i-induced fluorescence changes, i.e. [(F minus F 0)/F 0] = ΔF/F 0, in the neuron (red) (ΔF/F 0(N)) and in the SGC (blue) (ΔF/F 0(S)). F 0 is the basal fluorescence in either the neuron or the SGC before nerve stimulation. The horizontal line indicates the period of nerve stimulation. Responses in the dotted box are shown on an expanded scale to the right. Nerve stimulation evoked [Ca2+]i increase in the neuron first and then in the SGC with a delay. The [Ca2+]i signal in the SGC had a later onset and a slower recovery than the [Ca2+]i increase in the neuron. (B) Neuronal soma–SGC interactions depend on the frequency of nerve stimulation. With increasing stimulus frequency, the peak [Ca2+]i in both neurons and SGCs increased and the delay between the soma and SGCs was shortened (n = 4–6). Adapted from Zhang et al. (Reference Zhang, Chen, Wang and Huang2007) (Copyright © 2007 by National Academy of Sciences, USA).

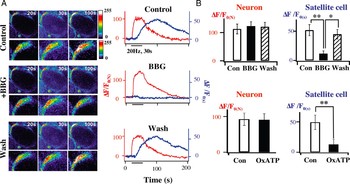
ATP signals sensory inputs in DRGs by activating purinergic ionotropic P2XRs and metabotropic P2YRs (Burnstock, Reference Burnstock2000; North, Reference North2002; Ruan and Burnstock, Reference Ruan and Burnstock2003; Fields and Burnstock, Reference Fields and Burnstock2006). Both P2XRs and P2YRs are found in the somata, axons and terminals of DRG neurons and in surrounding SGCs and Schwann cells (Grubb and Evans, Reference Grubb and Evans1999; Hanani, Reference Hanani2005; Kobayashi et al., Reference Kobayashi, Fukuoka, Yamanaka, Dai, Obata and Tokunaga2005, Reference Kobayashi, Fukuoka, Yamanaka, Dai, Obata and Tokunaga2006). P2X2–P2X6 mRNAs are found in DRG neurons (Kobayashi et al., Reference Kobayashi, Fukuoka, Yamanaka, Dai, Obata and Tokunaga2005). Homomeric P2X3Rs and heteromeric P2X2/3Rs receptors are the major P2XRs in the somata, peripheral and central terminals of small- and medium-sized sensory neurons (Burgard et al., Reference Burgard, Niforatos, van Biesen, Lynch, Touma and Metzger1999; North, Reference North2002). These receptors are responsible for transmitting sensory information from the periphery to the spinal cord (Bardoni et al., Reference Bardoni, Goldstein, Lee, Gu and MacDermott1997; Gu, Reference Gu2003; Nakatsuka and Gu, Reference Nakatsuka and Gu2006) and from the orofacial areas to the trigeminal subnucleus caudalis (Jennings et al., Reference Jennings, Christie and Sessle2006). P2X7 and P2X4 are the primary P2XR subtypes found in SGCs (Kobayashi et al., Reference Kobayashi, Fukuoka, Yamanaka, Dai, Obata and Tokunaga2005). A unique feature of sensory ganglia is that P2X7Rs are abundantly expressed in SGCs, but are not expressed in DRG neurons (Kobayashi et al., Reference Kobayashi, Fukuoka, Yamanaka, Dai, Obata and Tokunaga2005; Zhang et al., Reference Zhang, Han, Faltynek, Jarvis and Shieh2005; Chen et al., Reference Chen, Zhang, Wang, Li, Gu and Huang2008). At the same time, P2X3Rs are the highest expressed P2XRs in DRG neurons but are not found in SGCs (Kobayashi et al., Reference Kobayashi, Fukuoka, Yamanaka, Dai, Obata and Tokunaga2005; Chen et al., Reference Chen, Zhang, Wang, Li, Gu and Huang2008). This separate expression of the P2X3R and P2X7R provides us with a convenient way to differentiate the actions of ATP on neurons and on SGCs in DRGs. From Ca2+ imaging experiments, we found that the P2X7R antagonists, brilliant blue G (BBG) and oxATP, blocked afferent fiber-induced [Ca2+]i increase only in SGCs, but not in the neuron (Fig. 3) (Zhang et al., Reference Zhang, Chen, Wang and Huang2007). When Ca2+ channels in the neuron were activated by high KCl (80 mM), [Ca2+]i in both neuron and SGCs were increased. BBG again blocked the KCl-induced [Ca2+]i increase in SGCs without affecting [Ca2+]i changes in the neuron (Zhang et al., Reference Zhang, Chen, Wang and Huang2007). These observations suggest that in response to afferent stimulation or KCl-induced depolarization, activation of P2X7Rs in SGCs is the key event mediating the responses of neuronal soma to SGC communication.
Neuronal soma–SGC cell communication depends on the activation of P2X7Rs. (A) The reversible P2X7R antagonist, BBG (1 µM) inhibited the [Ca2+]i-induced fluorescence increase in a SGC, i.e. (ΔF/F 0(S)), but had no effect on the [Ca2+]i increase in a neuron, i.e. (ΔF/F 0(N)). The blocking effect of BBG was reversed after wash. (B) Average blocking actions of BBG and the irreversible P2X7R antagonist, oxATP. BBG had no effect on ΔF/F 0(N) in neuronal somata (n = 7), but reduced ΔF/F 0(S) increase by 78.6% (n = 15). Irreversible oxATP (100 µM) had no effect on ΔF/F 0(N) increase in neuronal somata (n = 4), but decreased ΔF/F 0(S) increase in SGCs by 73.8% (n = 9). Adapted from Zhang et al. (Reference Chen, Zhang, Wang, Li, Gu and Huang2007) (Copyright © 2007 by National Academy of Sciences, USA).

SGCs EXERT FEEDBACK CONTROL OF NEURONAL SOMATIC ACTIVITY THROUGH THE ACTIVATION OF P2X7Rs
To understand the role of the SGCs in sensory information processing, it is important to study SGCs responses to neuronal signaling and to determine whether SGCs provide active feedback control of neuronal activity in sensory neurons. There is a great deal of information concerning the influence of neuronal activity by glia in the CNS (Volterra and Meldolesi, Reference Volterra and Meldolesi2005; Haydon and Carmignoto, Reference Haydon and Carmignoto2006; Perea and Araque, Reference Perea and Araque2010). Glial cells respond to electrical and mechanical stimulation by releasing a variety of gliotransmitters, e.g. ATP, glutamate, GABA and prostaglandin E2 (PGE2) (Volterra and Meldolesi, Reference Volterra and Meldolesi2005). ATP released from astrocytes has been found to initiate [Ca2+]i oscillation and Ca2+ waves that propagate among astrocytes (Guthrie et al., Reference Guthrie, Knappenberger, Segal, Bennett, Charles and Kater1999; Cotrina et al., Reference Cotrina, Lin, Lopez-Garcia, Naus and Nedergaard2000). When ATP released from astrocyte is converted to adenosine by extracellular adenosine triphosphatases (ATPases), A1 receptors in hippocampal neurons become activated and glutamatergic synaptic responses are depressed (Zhang et al., Reference Zhang, Wang, Ye, Ge, Chen and Jiang2003). Such heterosynaptic suppression is absent in transgenic mice in which ATP release from astrocytes is impaired (Pascual et al., Reference Pascual, Casper, Kubera, Zhang, Revilla-Sanchez and Sul2005). When caged Ca2+ or ATP-induced glutamate release from astrocytes coincides temporally with the postsynaptic depolarization of CA1 neurons in the hippocampus, long-term potentiation can be evoked at CA3–CA1 synapses (Perea and Araque, Reference Perea and Araque2007). In addition, glutamate released from astrocytes has been found to evoke slow inward currents through extrasynaptic NMDA receptors and to activate multiple hippocampal CA1 neurons synchronously (Fellin et al., Reference Fellin, Pascual, Gobbo, Pozzan, Haydon and Carmignoto2004).
In sensory ganglia, the influence of SGC activation on neuronal activity is not well understood. Electrical properties of SGCs in DRG and TG neurons have been studied. Unlike neurons, SGCs do not express voltage-dependent Na+ channels, but express Ca2+-dependent, inwardly rectifying and voltage-dependent K+ channels (Cherkas et al., Reference Cherkas, Huang, Pannicke, Tal, Reichenbach and Hanani2004; Vit et al., Reference Vit, Jasmin, Bhargava and Ohara2006; Zhang et al., Reference Zhang, Mei, Zhang, Ma, White and Donnelly2009). Thus, SGCs are not electrically excitable. On the other hand, SGCs express a variety of receptors. They respond to external stimuli by changes in cytosolic Ca2+ through the opening of Ca2+-permeable receptors, e.g. ionotropic purinergic P2XRs (Zhang et al., Reference Zhang, Chen, Wang and Huang2007; Ceruti et al., Reference Ceruti, Fumagalli, Villa, Verderio and Abbracchio2008) or by mobilizing Ca2+ from intracellular Ca2+ stores through the activation of metabotropic receptors, e.g. P2YRs (Weick et al., Reference Weick, Cherkas, Hartig, Pannicke, Uckermann and Bringmann2003; Ceruti et al., Reference Ceruti, Fumagalli, Villa, Verderio and Abbracchio2008). Therefore, SGCs use intracellular Ca2+ for signaling, similarly to glial cells in the CNS. In trigeminal neuron–SGC mixed cultures, mechanical stimulation of SGCs has been shown to evoke Ca2+ waves that spread to the neighboring neuron and among the nearby SGCs. The Ca2+ signaling is mediated by P2Rs and gap junctions (Suadicani et al., Reference Suadicani, Cherkas, Zuckerman, Smith, Spray and Hanani2009).
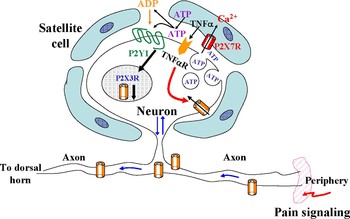
Because P2X7Rs in SGC cells directly respond to somatic ATP release (Fig. 3), we examined whether activation of P2X7Rs affects neuronal activity (Zhang et al., Reference Zhang, Chen, Wang and Huang2007; Chen et al., Reference Chen, Zhang, Wang, Li, Gu and Huang2008). When nerve fibers of DRGs are subject to tetanic trains of stimulation, a large increase in TNFα release can be observed (Zhang et al., Reference Zhang, Chen, Wang and Huang2007). The release is greatly diminished in the presence of the P2X7R antagonist, oxATP, suggesting that activation of P2X7Rs in SGCs mediates the TNFα release. Studying the action of TNFα on the activity of DRG neurons, we found that TNFα potentiates P2X3R-mediated currents and enhances the action potential firing of somata. Therefore, the SGC P2X7R-mediated release of TNFα exerts an excitatory action on DRG neurons (Zhang et al., Reference Zhang, Chen, Wang and Huang2007).
P2X7R activation has been directly linked to the post-translational maturation and release of cytokines, e.g. TNFα and interleukin 1β (IL-1β), from glial cells after injury (Colomar et al., Reference Colomar, Marty, Medina, Combe, Parnet and Amedee2003; Ferrari et al., Reference Ferrari, Pizzirani, Adinolfi, Lemoli, Curti and Idzko2006; McGaraughty et al., Reference McGaraughty, Chu, Namovic, Donnelly-Roberts, Harris and Zhang2007; Zhang et al., Reference Zhang, Chen, Wang and Huang2007; Skaper et al., Reference Skaper, Debetto and Giusti2010). P2X7R knock-out mutant mice lack the ability to release IL-1β from peritoneal macrophages in response to ATP stimulation (Solle et al., Reference Solle, Labasi, Perregaux, Stam, Petrushova and Koller2001) and fail to develop swollen paws or joint cartilage lesions as wild-type animals do when treated with collagen monoclonal antibodies to induce arthritis (Labasi et al., Reference Labasi, Petrushova, Donovan, McCurdy, Lira and Payette2002). Furthermore, in mice lacking P2X7Rs, thermal and mechanical hypersensitivity following inflammation, nerve ligation or lipopolysaccharide (LPS) treatment are absent (Chessell et al., Reference Chessell, Hatcher, Bountra, Michel, Hughes and Green2005; Clark et al., Reference Clark, Staniland, Marchand, Kaan, McMahon and Malcangio2010) and LPS- or BzATP-induced release of IL-1β is greatly diminished (Clark et al., Reference Clark, Staniland, Marchand, Kaan, McMahon and Malcangio2010). Most cytokines released from immune cells are through the endoplasmic reticulum-to-Golgi exocytic pathway (Moqbel and Coughlin, Reference Moqbel and Coughlin2006). However, P2X7 receptor-mediated cytokine release appears to occur through alternate routes. They include the ATP binding cassette transporter that is linked to a P2X7R-associated chloride conductance (Marty et al., Reference Marty, Medina, Combe, Parnet and Amedee2005), microvesicle shedding (MacKenzie et al., Reference MacKenzie, Wilson, Kiss-Toth, Dower, North and Surprenant2001; Bianco et al., Reference Bianco, Pravettoni, Colombo, Schenk, Moller and Matteoli2005) and membrane blebbing (Wilson et al., Reference Wilson, Wilson, Surprenant and North2002). Recently, a hemichannel protein, pannexin-1 was found to be associated with P2X7Rs and is required for P2X7R-mediated release of cytokine (Pelegrin and Surprenant, Reference Pelegrin and Surprenant2006; Iglesias et al., Reference Iglesias, Locovei, Roque, Alberto, Dahl and Spray2008, Reference Iglesias, Dahl, Qiu, Spray and Scemes2009; Surprenant and North, Reference Surprenant and North2009).
In addition to the excitatory effect, activation of P2X7R in SGCs was also found to exert inhibitory actions on DRG neurons (Chen et al., Reference Chen, Zhang, Wang, Li, Gu and Huang2008). Studying the basal ATP release from DRGs using a luciferase assay, we showed that the ganglia endogenously released ATP and the release was greatly reduced by treating DRGs with oxATP. Thus, P2X7Rs mediate a significant portion of the ATP release from SGCs. When P2X7Rs and their mediated ATP release were blocked, an increase in P2X3R expression in DRG neurons was observed. Furthermore, reducing P2X7R expression with P2X7R-siRNA also increased the P2X3R expression. Thus, P2X7R activation tonically suppresses the expression of P2X3Rs in DRG neurons. In addition, we found that the suppression was largely eliminated by treating ganglia with the P2Y1R antagonist, MRS2179, suggesting that the activation of metabotropic P2Y1Rs in neurons is required for the inhibitory P2X7R–P2X3R expression control. Treatment of DRGs with the Krebs cycle inhibitor, fluorocitrate, disrupted SGC activity and hence blocked the activation of P2X7Rs. Under such a condition, P2X3R expression was enhanced (Chen et al., Reference Chen, Zhang, Wang, Li, Gu and Huang2008). Preincubation of DRGs with the P2Y1R agonist, 2MeSADP, in the presence of fluorocitrate restored the inhibition of P2X3R expression. Thus, activation of neuronal P2Y1Rs, which is downstream of P2X7Rs, is sufficient for the P2X7R–P2X3R inhibitory control. Taken together, the observations suggest that activation of P2Y1Rs is necessary and sufficient for the inhibitory control of P2X3R expression by P2X7Rs (Chen et al., Reference Chen, Zhang, Wang, Li, Gu and Huang2008).
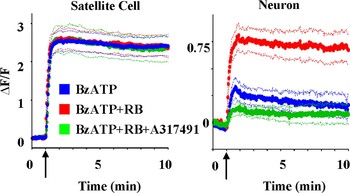
Ca2+ imaging analyses of DRGs were also used to determine the functional effect of the SGC-neuronal soma control (Fig. 4; Chen et al., Reference Chen, Zhang, Wang, Li, Gu and Huang2008). When P2X7Rs in SGCs were activated by the application of the P2X7R agonist BzATP, we observed a large [Ca2+]i increase in SGCs (Fig. 4, left), but only a moderate [Ca2+]i increase in the neuron (Fig. 4, right). Preincubation of the P2Y1R antagonist, reactive blue 2 (RB) for 1 h did not change [Ca2+]i in SGCs further, but greatly increased [Ca2+]i in the neuron. The [Ca2+]i increase was P2X3R mediated because the [Ca2+]i change in the neuron was blocked by the P2X3R antagonists, A317491. Thus, P2Y1R activation in neurons is required for glial P2X7Rs to exert their inhibitory control on P2X3Rs. This conclusion is further supported by behavioral observations (Chen et al., Reference Chen, Zhang, Wang, Li, Gu and Huang2008). Application of α,β meATP to the rat hindpaw elicited repetitive paw lifting (flinching), a nocifensive behavior known to be mediated by P2X3Rs. Down-regulation of P2X7R with P2X7-siRNA elicited a large increase in flinching responses. The increase was abolished when P2Y1Rs was activated by 2MeSADP. Thus, activation of P2Y1R effectively curtails the P2X3R-mediated nociceptive responses.
Blocking the P2YR enhances P2X3R activity in neurons. Activation of P2X7Rs by acute application of BzATP (100 µM) elicited a [Ca2+]i-induced fluorescence increase in SGCs (left), but a rather small [Ca2+]i increase in neurons (right). Following 1 h preincubation of DRGs with the P2YR antagonist, RB (1 µM), BzATP did not change [Ca2+]i in SGCs, but produced a large increase in [Ca2+]i signals in neurons. This observed [Ca2+]i increase in neurons is mediated by P2X3Rs because the increase was blocked when the P2X3 antagonist, A317491 (60 µM), was applied with BzATP. The thick lines represent the average [Ca2+]i responses of 10–15 neurons or those of 16–26 SGCs. The thin lines are the SEs of the average values. The arrows indicate the starting time of drug applications. Adapted from Chen et al. (Reference Chen, Zhang, Wang, Li, Gu and Huang2008) (Copyright © 2008 by National Academy of Sciences, USA).

P2X7Rs, which are richly expressed in SGCs, have two unique channel properties (Sperlagh et al., Reference Sperlagh, Vizi, Wirkner and Illes2006; Jarvis and Khakh, Reference Jarvis and Khakh2009). First, the P2X7R is relatively insensitive to ATP. The EC50 (~100 µM) of ATP for P2X7R is ~10 times higher than that for the P2X2R and P2X3R. Second, prolonged P2X7R activation renders the receptor progressively non-selective to cations (pore dilation), thus allowing passage of large molecules (Virginio et al., Reference Virginio, MacKenzie, North and Surprenant1999; Khakh and North, Reference Khakh and North2006). These properties make P2X7R activation dependent on cell activity. Strong stimulation or injury increases ATP release from activated neurons (Cook and McCleskey, Reference Cook and McCleskey2002), glia and immune cells (Bianco et al., Reference Bianco, Pravettoni, Colombo, Schenk, Moller and Matteoli2005; Franke et al., Reference Franke, Krugel and Illes2006). The level of extracellular ATP concentration would reach a sufficient level to activate P2X7Rs. Neurotransmitters, such as glutamate (Sperlagh et al., Reference Sperlagh, Kofalvi, Deuchars, Atkinson, Milligan and Buckley2002; Duan et al., Reference Duan, Anderson, Keung, Chen and Swanson2003), GABA (Sperlagh et al., Reference Sperlagh, Kofalvi, Deuchars, Atkinson, Milligan and Buckley2002; Papp et al., Reference Papp, Vizi and Sperlagh2004) and ATP (Zhang et al., Reference Zhang, Wang, Ye, Ge, Chen and Jiang2003) and neuromodulators, such as d-serine (Yang et al., Reference Yang, Ge, Chen, Zhang, Shen and Wu2003) and endocannabinoid 2-AG (Walter et al., Reference Walter, Dinh and Stella2004), are found to be released from glia following the activation of P2X7Rs. In addition to vesicular release, glial cells use additional mechanisms for transmitter release. They include outflow through anion channels, leakage from connexin and hemichannels, reversal of uptake of transporters and efflux through the P2X7R pore (Duan and Neary, Reference Duan and Neary2006; Scemes et al., Reference Scemes, Suadicani, Dahl and Spray2007; Malarkey and Parpura, Reference Malarkey and Parpura2008). Unlike Ca2+-dependent exocytosis observed at nerve terminals, P2X7R-mediated release from glial cells does not depend on the extracellular Ca2+ concentration (Duan et al., Reference Duan, Anderson, Keung, Chen and Swanson2003). Because of its unique requirement of high ATP concentration for activation, P2X7Rs are thought to specifically respond to high neuronal activity associated with neuronal degeneration (Le Feuvre et al., Reference Le Feuvre, Brough and Rothwell2002; Sperlagh et al., Reference Sperlagh, Vizi, Wirkner and Illes2006), spinal cord injury (Wang et al., Reference Wang, Arcuino, Takano, Lin, Peng and Wan2004) and abnormal pain (McGaraughty et al., Reference McGaraughty, Chu, Namovic, Donnelly-Roberts, Harris and Zhang2007; Skaper et al., Reference Skaper, Debetto and Giusti2010).
Very few studies show that activation of P2X7R is neuroprotective (Suzuki et al., Reference Suzuki, Hide, Ido, Kohsaka, Inoue and Nakata2004; Chen et al., Reference Chen, Zhang, Wang, Li, Gu and Huang2008). Due to the requirement of high ATP concentration for P2X7R activation, it is generally assumed that P2X7Rs play a minor role in influencing neuronal activity under normal conditions. Our study of SGC to neuron communication in DRGs suggests that this is not the case. We found that P2X7Rs are endogenously activated by basal ATP release and tonically down-regulate P2X3R expression in DRG neurons under normal conditions (Chen et al., Reference Chen, Zhang, Wang, Li, Gu and Huang2008). Since extracellular ATP concentration is kept at a low level in the presence ecto-ATPase and ecto-apyrase under these conditions, it remains to be determined how P2X7Rs are activated endogenously in DRGs. P2X7R activation depends on the location of the receptor relative to ATP release sites. SGCs are tightly wrapped around the somata of DRG neurons with a narrow gap (~20 nm) (Pannese, Reference Pannese1981; Hanani, Reference Hanani2005). If P2X7Rs are located in the vicinity of ATP release sites, the local ATP concentration at the P2X7R can be sufficiently high (5–500 µM) (Pankratov et al., Reference Pankratov, Lalo, Verkhratsky and North2006) for their activation without requiring a high level of neuronal activity. Thus, the extent of P2X7R activation may not be a direct function of ‘global’ extracellular ATP concentration.
SGC–NEURONAL SOMA INTERACTIONS AFTER INJURY
It is well documented that inflammation and nerve injury alter the properties of sensory neurons. As the results of a reduction of firing threshold and an increase in excitability after injury, these neurons become spontaneously active and/or fire action potentials at high frequencies in response to external stimuli (Zhang et al., Reference Zhang, Song and LaMotte1999; Cherkas et al., Reference Cherkas, Huang, Pannicke, Tal, Reichenbach and Hanani2004; Ma and LaMotte, Reference Ma and LaMotte2005; Dublin and Hanani, Reference Dublin and Hanani2007). These abnormalities contribute to pathological nociceptive (pain) behaviors, e.g. hyperalgesia and allodynia. Because SGCs can have profound effects on neuronal activity (Zhang et al., Reference Zhang, Chen, Wang and Huang2007; Chen et al., Reference Chen, Zhang, Wang, Li, Gu and Huang2008), it is important to understand whether the communication between SGCs and the somata of sensory neurons changes after injury.
In the somatosensory system, inflammation and nerve injury initiate many changes in glial cells. They include several-fold increase in the coupling between SGCs through gap junctions in DRGs (Pannese et al., Reference Pannese, Ledda, Cherkas, Huang and Hanani2003; Cherkas et al., Reference Cherkas, Huang, Pannicke, Tal, Reichenbach and Hanani2004; Hanani, Reference Hanani2005; Dublin and Hanani, Reference Dublin and Hanani2007; Zhang et al., Reference Zhang, Mei, Zhang, Ma, White and Donnelly2009), a decrease in inwardly rectified K+ currents in SGCs (Takeda et al., Reference Takeda, Tanimoto, Nasu and Matsumoto2008b; Zhang et al., Reference Zhang, Mei, Zhang, Ma, White and Donnelly2009), activation of extracellular signal-regulated kinase in astrocytes and microglia (Zhuang et al., Reference Zhuang, Gerner, Woolf and Ji2005), a large increase in the number of activated microglia in the spinal cord (Beggs and Salter, Reference Beggs and Salter2007), upregulation of P2X4Rs in microglia (Tsuda et al., Reference Tsuda, Shigemoto-Mogami, Koizumi, Mizokoshi, Kohsaka and Salter2003; Trang et al., Reference Trang, Beggs and Salter2006) and induction of BNDF release from microglia to reduce GABA inhibitory control in dorsal horn neurons (Coull et al., Reference Coull, Beggs, Boudreau, Boivin, Tsuda and Inoue2005). In addition, glial cells facilitate immune responses after injury. Cytokines have been found to exaggerate nociceptive responses in the spinal cord (Watkins et al., Reference Watkins, Milligan and Maier2003; Raghavendra et al., Reference Raghavendra, Tanga and DeLeo2004; Marchand et al., Reference Marchand, Perretti and McMahon2005; McMahon et al., Reference McMahon, Cafferty and Marchand2005; Takeda et al., Reference Takeda, Takahashi and Matsumoto2009). TNFα and IL-1β are important pain mediators in sensory neurons (Marchand et al., Reference Marchand, Perretti and McMahon2005; Takeda et al., Reference Takeda, Takahashi and Matsumoto2009). Only low levels of TNFα and IL-1β are detected in DRG neurons and SGCs of normal rats and mice (Ohtori et al., Reference Ohtori, Takahashi, Moriya and Myers2004; Xu et al., Reference Xu, Xin, Zang, Wu and Liu2006). After inflammation or nerve injury, these cytokines are upregulated rapidly in both neurons and SGCs (Ohtori et al., Reference Ohtori, Takahashi, Moriya and Myers2004; Miyagi et al., Reference Miyagi, Ohtori, Ishikawa, Aoki, Ozawa and Doya2006; Xu et al., Reference Xu, Xin, Zang, Wu and Liu2006; Takeda et al., Reference Takeda, Tanimoto, Kadoi, Nasu, Takahashi and Kitagawa2007). Similarly, TNFα type 1 receptors (TNFR1s) and IL1R1 in DRG or TG neurons are expressed only in modest amount in neurons and SGCs normally, but are increased several fold after nerve injury or inflammation (Ohtori et al., Reference Ohtori, Takahashi, Moriya and Myers2004; Inglis et al., Reference Inglis, Nissim, Lees, Hunt, Chernajovsky and Kidd2005; Takeda et al., Reference Takeda, Tanimoto, Kadoi, Nasu, Takahashi and Kitagawa2007). The increase in TNFα and TNFRs following inflammation and nerve injury was found to coincide with the production of hyperalgesia or allodynia (Wieseler-Frank et al., Reference Wieseler-Frank, Maier and Watkins2005). Treatment of the rat paw with these cytokines reduces nociceptive thresholds and produces nociceptive hypersensitivity (Sachs et al., Reference Sachs, Cunha, Poole and Ferreira2002). Acute treatment of DRG with TNFα and IL-1β increases intracellular Ca2+ transients in neurons (Pollock et al., Reference Pollock, McFarlane, Connell, Zehavi, Vandenabeele and MacEwan2002), depolarizes membrane potentials, reduces threshold currents for action potentials and elicits spontaneous firing in DRG neurons (Liu et al., Reference Liu, Li, Brull and Zhang2002; Schafers et al., Reference Schafers, Lee, Brors, Yaksh and Sorkin2003; Takeda et al., Reference Takeda, Tanimoto, Kadoi, Nasu, Takahashi and Kitagawa2007). The mechanisms underlying these direct actions of TNFα and IL-1β on sensory neurons include a reduction of voltage-dependent K+ currents (Diem et al., Reference Diem, Meyer, Weishaupt and Bahr2001; Takeda et al., Reference Takeda, Kitagawa, Takahashi and Matsumoto2008a) and an increase in Ca2+-dependent inward currents (Pollock et al., Reference Pollock, McFarlane, Connell, Zehavi, Vandenabeele and MacEwan2002). The effects of TNFα can be long lasting. A single injection of TNFα into DRGs was found to produce allodynia that lasts for more than 10 days (Schafers et al., Reference Schafers, Lee, Brors, Yaksh and Sorkin2003). Long-term exposure to TNFα results in an increase in PGE2 production (Sachs et al., Reference Sachs, Cunha, Poole and Ferreira2002; Fehrenbacher et al., Reference Fehrenbacher, Burkey, Nicol and Vasko2005) and potentiates TRPV1 responses in DRG neurons (Nicol et al., Reference Nicol, Lopshire and Pafford1997). Our observations that TNFα is released from SGCs following strong stimulation, a condition that invariably occurs following injury, and TNFα treatment increases neuronal excitability are consistent with the view that injury-induced release of cytokines from SGCs markedly affects the activity of somata in DRG neurons.
Because SGCs are found to exert inhibitory action on neuronal activity under normal conditions (Chen et al., Reference Chen, Zhang, Wang, Li, Gu and Huang2008), it is of interest to determine the P2X7R–P2X3 inhibitory control after injury. We studied the effect of P2X7R–P2X3R control on von-Frey filament-induced allodynia and on P2X3R-mediated α,β meATP-induced paw flinching in inflamed rats (Chen et al., Reference Chen, Zhang, Wang, Li, Gu and Huang2008) and nerve injury rats (preliminary studies). Following inflammation and nerve injury, allodynia and flinch behaviors were exaggerated. When P2X7Rs were activated by the P2X7R agonist, BzATP, the exaggerated responses became greatly diminished in both rat models. In rats treated with BzATP plus the P2X7R antagonist, oxATP or BBG, the protective action of BzATP was much reduced (preliminary studies). Thus, P2X7R–P2X3R inhibitory control persists after injury. Activation of P2X7Rs is effective in curbing the inflammation and nerve-injury-induced hyperalgesia.
We also determined the P2X7–P2X3R expression control in DRGs isolated from inflamed rats. P2X3R expression is increased after inflammation (Xu and Huang, Reference Xu and Huang2002; Chen et al., Reference Chen, Zhang, Wang, Li, Gu and Huang2008). Activation of P2X7Rs by BzATP reduces P2X3R expression. The reduction is blocked following the oxATP plus BzATP treatment. Thus, P2X7R exerts inhibitory control on P2X3R expression in inflamed rats, similar to that observed in normal rats (Chen et al., Reference Chen, Zhang, Wang, Li, Gu and Huang2008). We are investigating whether P2X7R activation by BzATP affects the P2X3R expression in nerve injured rats.
CONCLUSIONS
Studies of neuronal soma–SGC interactions in sensory ganglia in the last few years have led investigators to appreciate the interdependence between neuronal somata and SGCs in regulating peripheral signaling and the prominent role that P2X7Rs play in the neuron–SGC communication (Hanani, Reference Hanani2005; Zhang et al., Reference Zhang, Chen, Wang and Huang2007; Chen et al., Reference Chen, Zhang, Wang, Li, Gu and Huang2008; Miller et al., Reference Miller, Jung, Bhangoo and White2009; Suadicani et al., Reference Suadicani, Cherkas, Zuckerman, Smith, Spray and Hanani2009; Takeda et al., Reference Takeda, Takahashi and Matsumoto2009; Skaper et al., Reference Skaper, Debetto and Giusti2010). In response to afferent nerve fiber stimulation, somatic release of ATP from DRG neurons activates P2X7Rs in SGCs (Zhang et al., Reference Zhang, Chen, Wang and Huang2007). Because P2X7Rs are expressed only in SGCs (Kobayashi et al., Reference Kobayashi, Fukuoka, Yamanaka, Dai, Obata and Tokunaga2005; Chen et al., Reference Chen, Zhang, Wang, Li, Gu and Huang2008), they exert feedback control on neuronal activity exclusively through SGC–neuron interactions. Studies of SGC–neuron control suggest that P2X7R activation exerts both inhibitory and excitatory influences on the activity of the somata of sensory neurons (Fig. 5; Zhang et al., Reference Zhang, Chen, Wang and Huang2007; Chen et al., Reference Chen, Zhang, Wang, Li, Gu and Huang2008). Under normal conditions, the P2X7R–P2X3R inhibitory control keeps P2X3R activity in neurons at an optimal level (Chen et al., Reference Chen, Zhang, Wang, Li, Gu and Huang2008). After injury, P2X7Rs are involved in cytokine release to promote wound healing while maintaining P2X7R–P2X3R inhibitory control. Following severe injury, an increased P2X7R-mediated cytokine release can overwhelm the P2X7R inhibitory control and give rise to the overexcitation of sensory neurons. The challenge is to determine how to balance the inhibitory and excitatory SGC–neuron controls in order to prevent the production of abnormal neuronal activity and pathological pain conditions. Because of the complex modulation of neuronal activity by P2X7R activation, direct inhibition of P2X7R would not be an effective way to control chronic pain or neurodegeneration disorders induced by tissue or nerve injury. Blocking the P2X7R-associated protein, pannexin-1 hemichannel, which is found to be involved in the P2X7R-mediated cytokine release or pore dilation (Iglesias et al., Reference Iglesias, Dahl, Qiu, Spray and Scemes2009; Pelegrin and Surprenant, Reference Pelegrin and Surprenant2009), is likely to be a better strategy to curb the deleterious effects of P2X7R overexcitation. P2X7Rs have also been found to be upregulated in SGCs of avulsion-injured DRGs isolated from chronic neuropathic pain patients (Chessell et al., Reference Chessell, Hatcher, Bountra, Michel, Hughes and Green2005). The P2X7R appears to have an equally central role in SGC–neuronal soma signaling in human DRGs. Judicious choice of a site for controlling P2X7R activity would be essential for making the P2X7R a useful therapeutic target. Glial cells are found to wrap around the soma of neurons in the CNS (Perea et al., Reference Perea, Navarrete and Araque2009). Similar neuronal soma–glial cell interactions and controls may well occur in the brain and in the spinal cord.
Neuronal soma–SGC communication. A schematic drawing illustrates the afferent-stimulated ATP release from the soma of a DRG neuron and the excitatory (red arrow) and inhibitory (black arrow) control of the neuronal activity by SGCs.

ACKNOWLEDGEMENT
The work is supported by grants from National Institutes of Health (NS30045 and DE017813).
Statement of interest
None